Cheil Worldwide Stock Against the Korean Ad Sector It Dominates
Contents
Cheil Worldwide stock sits inside the index that grades it
Measured by market capitalization, 58.11 percent of the Korean advertising sector is one company. That company is the subject of this piece, and I found the figure printed as a warning above the numbers I had actually asked for.
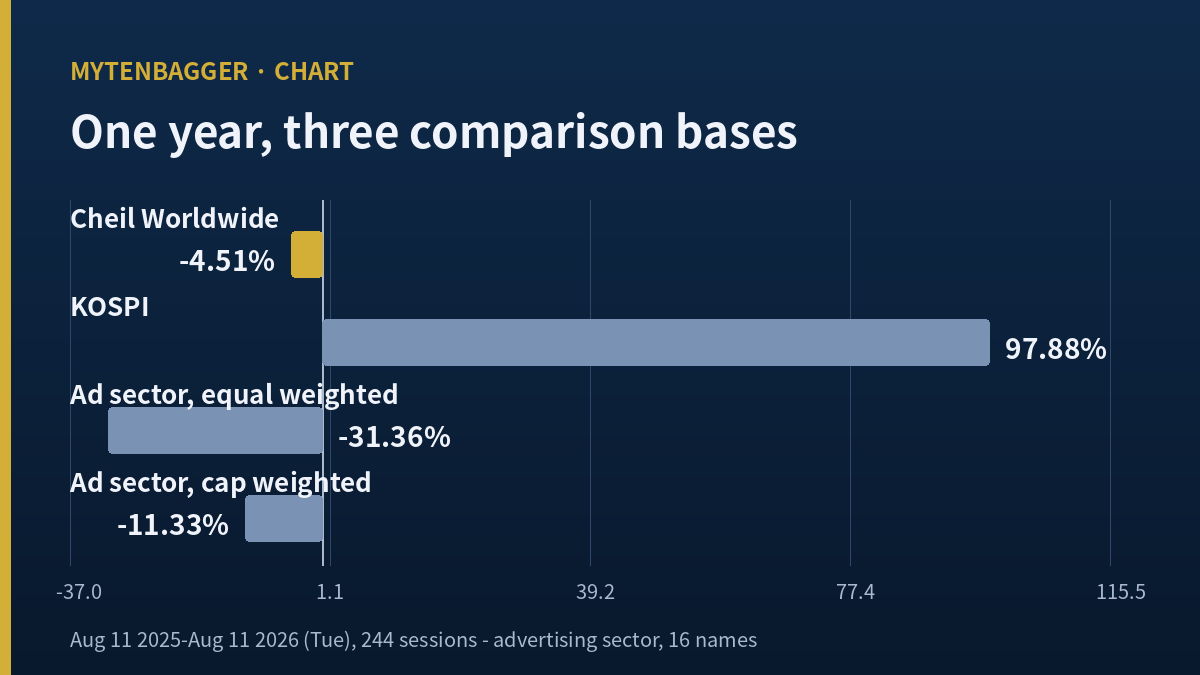
The numbers underneath were these. Over the 244 trading sessions from August 11, 2025 to August 11, 2026, the stock returned minus 4.51 percent while the advertising sector returned minus 31.36 percent. Excess return of plus 26.85 points. Verdict: beat the sector. Over the same window the KOSPI, Korea’s main board index for large and mid-cap listings, returned plus 97.88 percent, so against the market the stock lost by 102.39 points.
I nearly wrote that plus 26.85 into the first line of my case for this stock. Then I read the warning again. More than half of the index I had beaten, by value, was me.
Three comparisons, and what each one survives
| The same minus 4.51 percent, compared with | Result | Can I lean on it? |
|---|---|---|
| Advertising sector, equal weighted, self excluded (minus 31.36%) | plus 26.85 pts | No. The comparison group is defined by removing the company that is 58.11% of it. |
| Advertising sector, market cap weighted (minus 11.33%) | plus 6.82 pts | No. Same reason, and the answer shrinks to a quarter of the first one on the same data. |
| The other 15 listings, ranked (median minus 31.11%) | 3rd of 16 | Yes, but thinly. A rank is weighting agnostic. A rank alone does not buy anything. |
Two of the three came out. What follows is what I did with the one that stayed, and with the absolute figures I went to once the relative ones were gone.

Why the sector figure for Cheil Worldwide stock cannot carry weight
The tool I use groups Korean advertising into 16 listings. Add their market values together and this one company accounts for 58.11 percent. At the August 11, 2026 close of KRW 19,050 and 115,039,536 shares outstanding, that is a market capitalization of KRW 2,191.5 billion, roughly USD 1.55 billion by my calculation. The other 15 companies combined are worth less than this one.
A sentence that sets this company against that index is grammatically fine and logically circular. “The advertising sector had a poor year and this company held up” comes close to “this company held up better than this company” when the yardstick is more than half made of the company.
The tool knows about this, which is why its default calculation is equal weighted with the subject removed. Strip the company out and the remaining 15 listings returned minus 31.36 percent over the year, and that is where the plus 26.85 points comes from. Removing yourself does break the circularity. It also leaves a small comparison group whose character changes completely when one member is taken out, and it quietly assumes that a company worth 58.11 percent of the sector faces the same conditions as the fifteen that together are worth less. I have not verified that assumption and neither has the tool.
One rule change cuts the excess return to a quarter of its size
I asked the same tool for the same year on a market cap weighted basis. The sector return moves from minus 31.36 percent to minus 11.33 percent, and the excess return falls from plus 26.85 points to plus 6.82 points. The verdict moves from “beat the sector” to “marginally ahead.”
The reason is arithmetic. Under market cap weighting the 58.11 percent member drags the index toward itself. If the company returns minus 4.51 percent, the index is pulled toward minus 4.51 percent, and the company’s measured outperformance falls automatically. Push that all the way and a company’s excess return against itself is zero. Plus 6.82 points is a point on the road to that zero. It does not mean this business went from 26.85 points of skill to 6.82 points of skill.
The ratio of the two answers is 25.40 percent by my calculation. Same stock, same window, same underlying prices, one line of methodology changed, and the answer became a quarter of what it was. I do not put a figure with that property into a case for owning something. The question of which weighting is correct is beside the point, because neither one tells me a fact about this business.
One related number belongs here. The stock’s beta is 0.085 and its correlation with the market is 0.168, the lowest pair I have recorded on any Korean listing I have written up. While the KOSPI fell 30.38 percent from its June 22, 2026 peak of 9,114.55 to 6,345.53 on August 11, 2026, this stock gave up 4.51 percent. That looks like resilience. It is at least as likely to be the mechanical result of very low market sensitivity, and I cannot tell the two apart from the data I have.
What is left of Cheil Worldwide stock once both comparisons go
One relative figure survives a change of weighting: the rank. The company placed 3rd of 16, in the top 18.8 percent, ahead of 13 of its listed peers whose median return was minus 31.11 percent. Ranks are built by sorting individual returns, so index weights never enter.
The tool’s own caveats travel with that rank. Only the 16 listings that traded across the whole window are counted, one late listing was excluded, and companies that were delisted were never in the sample to begin with. It is third place among survivors. It also says only that this company fell less than most Korean advertising listings over one year. It says nothing about whether the price today is a good one.
So I went to absolute figures, and found two: operating profit of KRW 36.5 billion in the first quarter of 2026 and KRW 92.7 billion in the second. Approximately USD 25.8 million and USD 65.5 million. The first is the lowest in more than four years of quarterly history. The second is level with the year before.
The first quarter of 2026 was the lowest in seventeen quarters
Single quarter operating profit from Korea’s electronic disclosure system, in billions of won, from the first quarter of 2022:
| Year | Q1 | Q2 | Q3 | Q4 |
|---|---|---|---|---|
| 2022 | 58.49 | 88.01 | 93.12 | 71.79 |
| 2023 | 53.42 | 84.68 | 93.44 | 75.99 |
| 2024 | 54.54 | 88.21 | 95.57 | 82.40 |
| 2025 | 58.49 | 92.12 | 95.89 | 90.39 |
| 2026 | 36.51 | 92.7 | not reported | not reported |
Consolidated, from the Korean electronic disclosure system. Korean quarterly filings report flow items cumulatively, so single quarters here are the prior cumulative figure removed, and fourth quarters are the annual total with three quarters of cumulative removed. Both are my own arithmetic. The 2026 Q2 entry of 92.7 is the company’s own July 24, 2026 announcement and carries one fewer decimal place than the rest of the table.
Across the sixteen quarters from the start of 2022 to the end of 2025, single quarter operating profit stayed between KRW 53.42 billion and KRW 95.89 billion, roughly USD 37.7 million to USD 67.7 million. The first quarter of 2026 came in at KRW 36.51 billion, which is KRW 16.91 billion below the bottom of that run, about USD 11.9 million, a drop of 31.66 percent against the previous low. Seventeen quarters in, that is the first reading outside the run.
Against the same quarter of 2025, revenue fell from KRW 1,039.42 billion to KRW 1,017.57 billion, down KRW 21.85 billion or 2.10 percent, while operating profit fell from KRW 58.49 billion to KRW 36.51 billion, down KRW 21.98 billion or 37.58 percent.
I want to flag something I chose not to do with those two declines. Dividing one by the other to produce a ratio is the exact structure I used on a different company in my previous piece, so I am leaving it alone here even though the material is sitting right there. Having the ingredients is not a reason to cook the same dish twice in a row.
Instead, here is the figure from that quarter that works against me. Net income went up. It moved from KRW 28.03 billion in the first quarter of 2025 to KRW 28.26 billion in the first quarter of 2026, up KRW 0.23 billion or 0.82 percent. Operating profit lost 37.58 percent and the bottom line held. Something below the operating line moved the other way and I have not established what it was.
The second quarter, reported on July 24, 2026, matched the year before
The company’s second quarter, announced on July 24, 2026, showed revenue of KRW 1,074.5 billion (down 4 percent), operating profit of KRW 92.7 billion (up 0.6 percent), net income of KRW 63.5 billion (up 24 percent) and gross profit of KRW 489.6 billion (up 1.2 percent). Against the KRW 92.12 billion of the prior year second quarter, operating profit gained KRW 0.58 billion, or 0.63 percent by my calculation. That reading falls back inside the sixteen quarter run in the table above.
Which makes the first half look like this. Operating profit of KRW 129.21 billion in the first half of 2026 against KRW 150.61 billion in the first half of 2025, a fall of KRW 21.40 billion or 14.21 percent. But the first quarter alone accounted for a fall of KRW 21.98 billion. The second quarter put KRW 0.58 billion back, so the half year decline is smaller than the single quarter decline that produced it.
In other words, the entire first half shortfall at this company came out of one quarter. Look at either quarter on its own and you reach the opposite conclusion. I am not willing to average the two into a single sentence about the business.
Two operating margins for Cheil Worldwide stock, and the one the company leads with
The figure the company puts first
The headline number in the second quarter release was not revenue. It was gross profit of KRW 489.6 billion, split into KRW 107.6 billion at the Korean parent and KRW 382.0 billion across consolidated overseas subsidiaries. Those two add exactly to the total. By service line the company gave digital 56 percent, retail and below-the-line 30 percent, and above-the-line advertising 14 percent.
Second quarter operating profit of KRW 92.7 billion measured against gross profit of KRW 489.6 billion gives 18.93 percent. The same KRW 92.7 billion measured against revenue of KRW 1,074.5 billion gives 8.63 percent. Both are mine, and they differ by more than a factor of two. The 7.41 percent full year operating margin that appears on data screens uses the second method.
In agency businesses, reported revenue can swell with media spend that the agency places on behalf of clients, and the amount the agency actually retains sits closer to the gross profit line. If that applies here, setting this company’s operating margin beside a manufacturer’s operating margin breaks on contact. I have not read the revenue accounting policy note in the annual filing, so I am carrying both figures and declaring neither of them the right one.
Omnicom, and the table I did not build
For an international point of comparison I took Omnicom Group (NYSE: OMC), the US advertising holding company now reporting its first clean quarters after absorbing Interpublic. Its second quarter of 2026, released on July 28, 2026, showed revenue of USD 6,562.5 million, organic growth of 6.1 percent, GAAP operating profit of USD 922.5 million at a 14.1 percent margin, non-GAAP adjusted operating profit of USD 1,009.6 million at 15.4 percent, GAAP net income of USD 584.8 million, GAAP diluted earnings per share of USD 2.08, and adjusted diluted earnings per share of USD 2.65, up USD 0.60 from USD 2.05, a gain of 29 percent as Indian trade press summarized it and as Storyboard18 reported the same day.
Then I started building a margin table and stopped. To put Omnicom’s 14.1 percent beside this company’s 18.93 percent in one row, both companies would have to be measuring against the same kind of revenue, and I read Omnicom’s results release without opening the quarterly filing itself. I know the convention is that US agency holding companies report close to net revenue. A convention is not a verified basis for a comparison table. So there is no margin table in this piece.
Something does survive the abandoned table. Omnicom posted 6.1 percent organic growth in the quarter; this company posted 1.2 percent gross profit growth. Those two growth definitions are also not the same, so this is not a ranking either. What I will record is that both comparisons I set out to build in this piece failed, and they failed for different reasons. In one, the comparison group contained the subject. In the other, the two sides were measured on different units.
Figures I left out of the Cheil Worldwide stock case
The dividend, because this pattern belongs to another piece
The dividend per share was KRW 1,230 in both 2024 and 2025, about USD 0.87. Against the August 11, 2026 close of KRW 19,050 that is a yield of 6.46 percent by my calculation; the 6.42 percent on the data screen uses the August 10, 2026 close of KRW 18,970. Total dividends work out to KRW 141.5 billion, roughly USD 99.9 million, or 67.83 percent of consolidated 2025 net income. The payout ratio field on my screen shows two values, 68.2 and 59.7, and I could not establish which was which, so I used neither.
A flat dividend with a rising yield is a pattern I have already built a piece around at another company. I do not build the same one twice inside a short span.
Interest expense, for the same reason
Annual interest expense rose from KRW 43.61 billion in 2024 to KRW 63.01 billion in 2025, up KRW 19.40 billion or 44.48 percent by my calculation, while the debt to equity ratio barely moved, from 124.32 percent to 125.93 percent. Debt flat and interest up is a pattern I have written about before, so here I only confirmed the interest coverage figure of 2.59 and moved on. It reproduces as first quarter 2026 operating profit of KRW 36.51 billion over first quarter interest expense of KRW 14.09 billion, which pins that field to a single trailing quarter.
Four derived fields on the data screen, because I could not pin their basis
Four came out. The screen’s EBITDA of KRW 36.51 billion equals first quarter operating profit to the last won, and the disclosure feed carries no depreciation account, so it reads as a copy. The equity field of KRW 1,379.5 billion differs from the KRW 1,539.64 billion consolidated equity in the first quarter 2026 filing by KRW 160.14 billion, or 10.40 percent; the screen’s own 123.0 percent debt ratio reproduces as 1,893.72 divided by 1,539.64, which confirms the ratio uses the consolidated figure and the equity field does not. Book value per share of KRW 16,125 multiplied by the share count gives KRW 1,855.01 billion, which is KRW 315.37 billion more than consolidated equity, and since I cannot say which statement it is drawn from, I removed price to book from the case entirely. The three year revenue growth field also came out, with no way to check how it was built.
One thing I did check, and it held
Paid-in capital of KRW 23.0 billion divided by 115,039,536 shares gives KRW 199.93, and KRW 200 multiplied by the share count gives KRW 23.008 billion, so the KRW 200 par value reconciles. There is no stock split flagged in the data and I found no record of a treasury share cancellation having been executed. That last point matters for the counterpoints below.
Eleven arguments against my reading of Cheil Worldwide stock
- The sell side is pointed the other way. Analyst Jung Ji-soo at Meritz Securities carried a buy view and wrote KRW 26,000 into a July 20, 2026 note, about USD 18.36, calling the stock 9.5 times 2026 estimates. Those estimates were gross profit of KRW 1,895.4 billion, up 1.9 percent, and operating profit of KRW 334.9 billion, down 0.6 percent, as relayed by Korean press. I did not read that note itself.
- Twelve percent of the shares are held in treasury and may be canceled in stages. The same note expected the plan to firm up during the second half of 2026. Twelve percent is roughly 13,804,744 shares by my arithmetic, and canceling them would reset every per share figure in this piece.
- Every screening test passes. Revenue scale, operating margin, earnings per share, return on equity, price to earnings, price to book and positive operating profit all clear on the seven point checklist I run, for a score of 100. That is the first perfect score I have recorded.
- Net income rose in the quarter I am worried about. The first quarter of 2026 delivered KRW 28.26 billion against KRW 28.03 billion. My reading looks only at the operating line.
- The rank does not depend on any of this. Third of 16, ahead of 13 listings, holds under either weighting. What I struck out was an excess return figure. The fact that this company fell less than its listed peers still stands.
- The company’s own measure shows a healthy margin. Second quarter operating profit against gross profit is 18.93 percent. Reading 8.63 percent off a screen and concluding the business is low margin would be a mistake.
- The second quarter recovered. KRW 92.7 billion is level with the prior year and back inside the sixteen quarter run. If the first quarter was a one-off, my waiting costs a quarter.
- The dividend is substantial. KRW 1,230 per share for a second year running, a 6.46 percent yield on the August 11, 2026 close by my calculation.
- Annual results are remarkably steady. From 2022 through 2025, annual operating profit stayed between KRW 307.52 billion and KRW 336.89 billion. That four year spread is KRW 29.37 billion, or 9.55 percent of the low end.
- Low market sensitivity did the defensive work. With a beta of 0.085 and correlation of 0.168, the stock lost 4.51 percent while the market lost 30.38 percent. Whether that is quality or simply low connection to the index is a fair argument.
- My own sector index is a synthetic one. It is not an official Korean exchange sub-index; the tool assembled 16 listings and classified them. The 58.11 percent that this whole piece turns on is true only within that classification, and I am not going to pretend otherwise.

The sector that is mostly one company
The shares trade on the KOSPI, the senior board of the Korea Exchange, under code 030000. The KOSDAQ, which comes up constantly in Korean coverage, is the separate growth board and is not where this listing sits. Foreign ownership stands at 18.28 percent, and the market capitalization sits near USD 1.55 billion.
The structural point sits one level above that. There is no Korean advertising sector product I could find in either market, and given that one company is 58.11 percent of that sector by value, a sector vehicle would effectively be this single stock under a collective name. So the sector route that would normally express a view on Korean advertising without picking a name does not exist, and if it did exist it would not diversify anything. You either own this company directly or you have no exposure to the industry at all. That is a structural fact about the market, and it is the same fact that made my excess return figure unusable.
written before about a Korean stock whose screen multiple needed checking against what it
The three inputs I am leaving behind
I opened this with three reasons to like the company and closed with one. The two sector figures came out because the comparison group contained the subject, and the rank stayed but does not buy anything on its own. The two absolute figures I fell back on argue with each other.
Nobody should take that on trust, so here are the three inputs, laid out so the same work can be redone from scratch. One: the sector concentration, 58.11 percent by market capitalization across 16 listings, with the subject included. Two: the same one year return of minus 4.51 percent measured against minus 31.36 percent equal weighted with self excluded, and against minus 11.33 percent market cap weighted. Three: single quarter operating profit of KRW 36.51 billion and KRW 92.7 billion against a sixteen quarter run of KRW 53.42 billion to KRW 95.89 billion. Anyone who reruns those three and reaches a different conclusion is welcome to it; the point of writing the inputs down is that the disagreement can then be about the numbers.
My own position stays where it started: a wait for one figure. And one deadline I will name, because it is close. The Korean semi-annual filing is due August 14, 2026, and if the treasury holding disclosed there comes in well below 12 percent, my eighth counterpoint collapses and I will have been repeating a sell side figure without checking it. That would mean rebuilding the list of arguments against myself, which in this piece is the part I trust most.
Prices, market capitalization and multiples in this piece reflect the August 11, 2026 Korean close as I checked them at the time of writing; publication comes later, so live quotes will differ. Korean won is the reference currency throughout and USD conversions are approximate, at roughly KRW 1,416 per dollar on that same date. Financial figures follow consolidated statements filed with Korea’s electronic disclosure system and the company’s own release; the second quarter results were cross-checked against Korean press reports from Herald Business and Seoul Economic Daily, which I am paraphrasing into English and not quoting directly. Shareholder return history is from the company investor relations pages, and Omnicom’s outlook commentary from Bloomberg. Screen data is a Kiwoom feed whose snapshot timestamp is the evening of August 10, 2026, one session behind the close used here. I also keep a running note on a Korean stock where I decided to wait for a dated event before acting, which is the same discipline applied to a different trigger.
- KT Nasmedia Earnings Tripled on Sales That Rose Only 23%
- Innocean Price Target: Eight Firms Sit Above the 52-Week High