
Why Hana Tour Operating Cash Flow Turns Negative in Q2
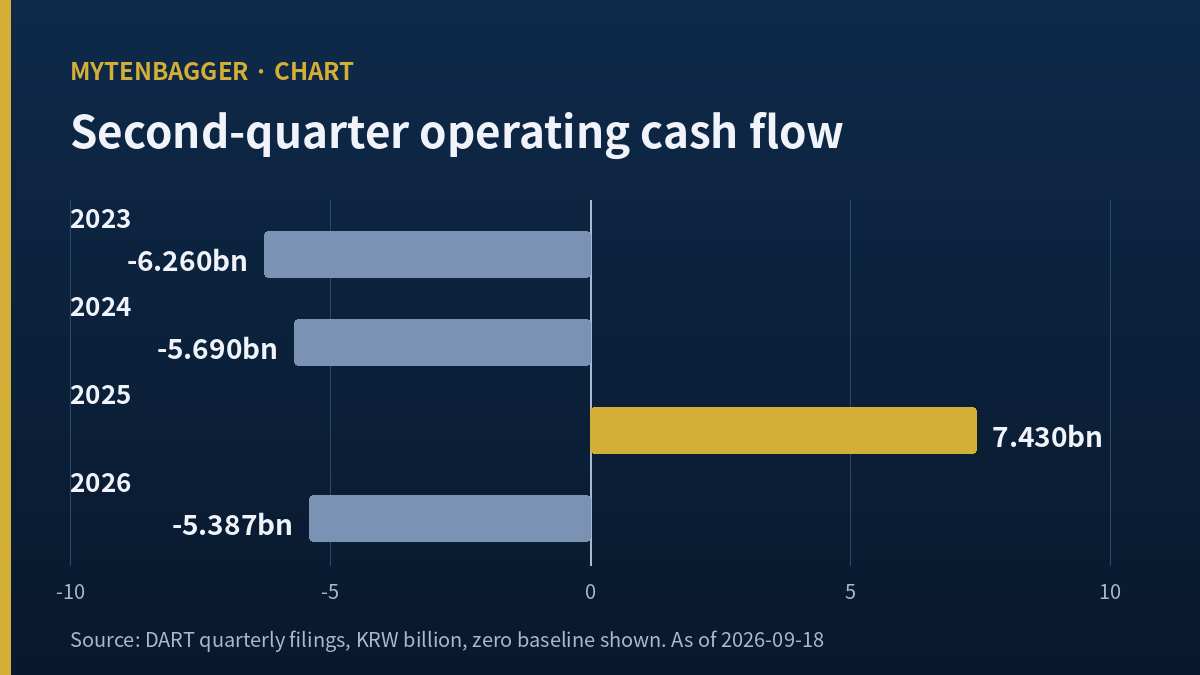
I went into the cash flow statement behind Hana Tour stock looking for one number and came out with a pattern I had not expected. Over the four most recent second quarters, the company reported net profit every single time, adding up to KRW 50.558 billion (about USD 36.5 million at 1,383.3 KRW per USD on 2026-09-18). Over those same four quarters, operating cash flow added up to negative KRW 9.907 billion. The company earned roughly KRW 50.6 billion on paper in its April-to-June quarters and handed back roughly KRW 9.9 billion in cash. That gap of about KRW 60.5 billion is what this note is about, and it is why I read Hana Tour stock as a business whose reported quarter and its cash quarter sit in different places within the year.
I should say plainly where I stand before the numbers start. I do not own this company and I have no order working. Its market value of KRW 475.57 billion (USD 343.80 million) puts it outside the largest hundred listings in Korea, so my default position here is observation. What follows is a reading of published statements, not a call.
Four second quarters, two columns that disagree
| Quarter | Net profit for the quarter | Operating cash flow for the quarter | Do the two agree in sign |
|---|---|---|---|
| Apr-Jun 2023 | KRW 19.827 bn | KRW -6.260 bn | No |
| Apr-Jun 2024 | KRW 12.637 bn | KRW -5.690 bn | No |
| Apr-Jun 2025 | KRW 11.146 bn | KRW 7.430 bn | Yes |
| Apr-Jun 2026 | KRW 6.948 bn | KRW -5.387 bn | No |
Both middle columns are single-quarter figures I derived by subtracting each first-quarter cumulative filing from the corresponding half-year filing. The cumulative values are as disclosed; the differences are mine. Three of the four rows disagree in sign, and the one that agrees is also the smallest cash number of the four.
Contents
The Closing Price I Used for Hana Tour Stock, and Three That Disagreed
Four Korean quote services gave me four different prices for the same session, so I had to settle on a rule before anything else. The daily price series marks 2026-09-18, a Friday, at KRW 30,700 and flags that row as final, with 84,723 shares traded on the regular exchange session alone. A separate indicator screen from the same server shows KRW 30,650 with no final flag on it. A third service displays KRW 31,800 under a label reading September 17 at 15:30, but the actual September 17 close was KRW 31,900 and KRW 31,800 was the September 18 opening price. That same third service puts market capitalization at KRW 494.1 billion under a September 16 label, and dividing it by the 15,491,028 shares outstanding gives KRW 31,896, which lands on the September 17 close instead.
My rule is the simplest one I can defend: take the row that carries a final flag. So the close in this note is KRW 30,700 on 2026-09-18, and the market value of KRW 475,574,559,600 is my own multiplication of that close by the share count, not a figure copied from any screen. When the services disagree on a session, I also leave daily percentage moves out of the text entirely, and there are none in this note.
Four Second Quarters of Hana Tour Stock Point One Way for Cash
Here is the fuller series, all of it derived the same way, by taking the difference between consecutive cumulative filings. In 2023 the four quarters ran KRW 34.634 billion, negative KRW 6.260 billion, KRW 47.476 billion and KRW 40.876 billion. In 2024 they ran KRW 49.776 billion, negative KRW 5.690 billion, KRW 52.677 billion and negative KRW 8.751 billion. In 2025 they ran KRW 23.480 billion, KRW 7.430 billion, KRW 96.732 billion and negative KRW 26.556 billion. So far in 2026 the first quarter brought in KRW 19.015 billion and the second took out KRW 5.387 billion.
Read down the second-quarter column and three of four are negative. Read down the first-quarter column and all four are positive, totaling KRW 126.905 billion against the second-quarter total of negative KRW 9.907 billion. The third quarters are positive in all three years I can see. That is a business whose cash arrives early in the year and leaves in the middle of it, and the reported profit line does not carry any of that information.
The First Quarters All Point Up
I want to be careful about what I am claiming, because there is an easy story here and it is not one I can fully document. A tour operator collects deposits and balances before departure, and the largest bookings in the Korean outbound market cluster ahead of the summer. If money comes in during January to March against trips that depart in June to August, then the first quarter shows an inflow and the second shows the payment going out to airlines and hotels. That would produce exactly the pattern I see.
The part I can prove and the part I am reading into it
What I cannot do is show you the line item that proves it. I did not open the notes to the financial statements to separate advance receipts from the rest of the liability side, and the company reports total liabilities of KRW 490.408 billion at the end of 2025 against total equity of KRW 167.123 billion without breaking the first number apart in anything I read. So I am stating the pattern as fact, because the four columns are arithmetic, and stating the explanation as my best reading, because it is.
What the Cash Gap Around Hana Tour Stock Is Not
Three things this gap is not, and I think naming them matters more than naming what it is.
It is not a loss. Every one of those four second quarters carried positive net profit, and the most recent one, at KRW 6.948 billion, came alongside operating profit of KRW 5.440 billion on revenue of KRW 115.436 billion. It is not a full-year problem either: 2025 as a whole produced operating cash flow of KRW 101.086 billion against operating profit of KRW 57.626 billion, so the year converted more cash than it reported as profit. And it is not capital spending. Capital expenditure in the first half of 2026 came to KRW 1.993 billion, which is small enough that it cannot be moving a cash line that swings by tens of billions between quarters.
What it is, as far as I can defend it, is a timing property of the business. That distinction matters for anyone sizing a quarterly figure in isolation. If someone reads the second quarter of this company on its own and treats the cash outflow as deterioration, the first quarter three months earlier said the opposite with a larger number, and both were true.

Four Companies in the Same Sector Bracket Sit Behind This One
Hana Tour sits in the hotels, restaurants and leisure bracket, and I have written about four of its bracket-mates already. With GKL I sized the company against a casino levy bracket that had not been set yet. With Kangwon Land I looked at a quarter where operating profit and net profit pointed opposite ways. With Hotel Shilla I split the gap to the index and found the sector owned most of it. And with Pan Ocean I followed seventeen tankers into a 2028 delivery schedule.
None of those four turned on the timing of cash inside a year, which is what makes this one different for me. Casinos collect at the table on the day. Shipping collects against a charter that runs for months. A tour operator takes money from a customer weeks before the trip and pays the airline and the hotel around the departure. The bracket label is the same for all of them; the moment when money arrives is not. I carried no figures from those four pieces into this one, because setting their figures next to mine would mean comparing collection cycles that are not built alike.
A Peer That Counts Something, and Why Hana Tour Stock Cannot Sit Beside It
I picked the peer on one criterion, and it was not size or geography. I looked for a listed travel company that publishes a non-financial unit of volume next to its financial statements, the way this one publishes how many people it sent abroad. Booking Holdings does exactly that, reporting 1,235 million room nights, gross bookings of USD 186.1 billion, revenue of USD 26.9 billion and net income of USD 5.4 billion for full-year 2025 in its release dated 2026-02-18. The same annual figures appear as revenue of USD 26,917 million and operating income of USD 9,487 million in the financial summary I used to check them, and 9,487 divided by 26,917 gives an operating margin of 35.2454 percent, which matches the margin stated on that page.
Then I tried to do the obvious thing and could not. Dividing Booking Holdings revenue by room nights gives USD 21.7951 per room night, and operating income gives USD 7.6818 per room night. Those are clean numbers and they are useless to me here, because a room night is not a departing traveler. One person on a ten-day trip can generate many room nights, and a package customer counted once by a Korean tour operator may never appear as a room night at all if the hotel was contracted in a block. The two units count different things, so I am reporting the attempt and its failure instead of a comparison. What the peer did give me is the knowledge that publishing a volume unit alongside the accounts is normal in this industry, which made me trust the Korean disclosure enough to build on it.
I Built the Multiples Behind Hana Tour Stock Myself
Adding the four most recent quarters of profit attributable to owners of the parent gives KRW 39.309 billion. Divided by 15,491,028 shares that is KRW 2,537.53 per share, and against the KRW 30,700 close the price-to-earnings multiple works out at 12.0984. Equity attributable to owners stood at KRW 142.622 billion at the end of June 2026, which gives KRW 9,206.75 per share and a price-to-book multiple of 3.3345.
I built both because the screens do not agree and one of them cannot be checked. One indicator screen reports earnings per share of KRW 2,036 while stating in its own metadata that the figure was produced by dividing the current price by the price-to-earnings multiple, which means testing that multiple with that earnings figure is circular by construction. The same screen labels revenue of KRW 586.9 billion as a last-four-quarters figure, but it matches the 2025 full-year revenue of KRW 586.902 billion to the last digit, and its operating profit and net profit match the 2025 annual figures too. A third service offers earnings per share of KRW 1,833 and a multiple of 17.4. Three sources, three answers, so I went back to the filings.
Where I Stand on Hana Tour Stock and Nine Ways I Could Be Wrong
I am observing and not holding. The cash pattern described above does not by itself make the company cheap or expensive; it changes which quarter I would use to judge it. Below I list what could break this reading, ordered by the date on which I could first check each one. I am not ordering them by likelihood, because that ordering would be my opinion and this one is a schedule.
- Checkable now, if I open the notes. Advance receipts may not be the driver of the swing at all. My explanation rests on a liability breakdown I did not read.
- Checkable now. I produced the single-quarter figures myself by taking one cumulative disclosure away from the next, so any restatement between the two would flow straight into them.
- Checkable now. Consolidated cash flow includes subsidiaries whose businesses may not follow the outbound travel season at all.
- Checkable now. Profit attributable to owners fell 60.8441 percent in 2025 to KRW 31.896 billion from KRW 81.459 billion, and I did not establish why. That number is the numerator of my earnings multiple.
- November 16, 2026. The third-quarter report is due, and the third quarter has been positive for cash in all three years I can see. If it is not this time, the seasonal reading weakens immediately.
- November 16, 2026. The same report shows whether the second-quarter outflow reversed or persisted into the following period.
- With the 2026 annual report. The company published a 2025 to 2027 plan for total shareholder returns of around 50 percent, with a payout ratio of 30 to 40 percent and buybacks and cancellations of 10 to 20 percent, and its own dividend table shows payout ratios of 164.7, 43.7 and 56.5 percent for 2023, 2024 and 2025. Three results above a stated range of 30 to 40 percent come from the company’s own arithmetic and not from mine, and the third year of the plan will say whether the stated range or the practice moves.
- Whenever the next estimate lands. KB Securities analyst Choi Yong-hyun cut the 2026 operating profit estimate by 19.3 percent on 2026-05-13 and Kiwoom Securities analyst Ahn Do-hyun cut his operating profit forecast by 11 percent the following day. I am printing the size of the cuts and not the valuations either house attached to them, because I could not open the underlying reports and I will not vouch for a figure I have not seen. Two cuts of that different a size tell me the estimate error in this sector is currently wide.
- Not checkable on a schedule. Fuel surcharges and the exchange rate are outside the company’s control. Management attributed the weaker second quarter to fuel surcharge increases and to holding package prices down so customers would absorb less of them.
Three Ways the Next Two Reports Could Read
Because the whole argument rests on timing, it is worth writing down in advance what each of the next two filings would have to look like for me to keep it, adjust it, or drop it. I am setting these out as branches and not as probabilities, since I have four years of one quarter and that is a thin base for weighting anything.
In the first branch the third quarter of 2026 lands positive on operating cash flow, somewhere in the range the three prior third quarters occupied, which ran from KRW 47.476 billion in 2023 to KRW 96.732 billion in 2025. If that happens, the seasonal reading holds and the second-quarter outflow of KRW 5.387 billion becomes an ordinary feature of the year. In that case I would also expect the full-year 2026 cash figure to land above full-year operating profit, as it did in 2025 when KRW 101.086 billion of operating cash flow sat against KRW 57.626 billion of operating profit.
In the second branch the third quarter is positive but noticeably smaller than the three before it. That would not break the pattern, but it would tell me the amount of money moving through the collection cycle has shrunk, which for a business that handles customer money ahead of departure is a volume signal arriving before the revenue line shows it. I would then start watching the size of the swing and not just its direction.
In the third branch the third quarter is negative. Two consecutive negative quarters would mean I have been describing a drift and calling it a season. At that point the correct move is not to adjust the reading but to discard it, because the four-column table at the top of this note would no longer be describing what the company does. I would also owe the correction in a following piece, since the claim here is specific enough to be wrong in public.
One more thing sits underneath all three branches. The first half of 2026 produced KRW 13.628 billion of operating cash flow in total, against KRW 30.910 billion in the first half of 2025 and KRW 44.086 billion in the first half of 2024. The company discloses all three as cumulative half-year totals, so unlike the single quarters above I did not have to build them. Measured that way, the first six months of 2026 moved 44.0893 percent of what the same six months of 2025 moved, and 30.9123 percent of what they moved in 2024. Two consecutive halves down by roughly a third and then by more than half is a slope, and none of the three branches above makes it go away.
I am deliberately not turning that slope into a forecast. The half-year figure is an aggregate of two quarters that behave in opposite directions, so a decline in the total can come from a smaller inflow in the first quarter, a larger outflow in the second, or both at once. Here it was mostly the first: KRW 19.015 billion came in during January to March 2026 against KRW 23.480 billion a year earlier and KRW 49.776 billion the year before that. The quarter that collects is collecting less. Whether that reflects fewer bookings, earlier departures, or a change in when customers settle their balances is a question the statements do not answer, and I would rather leave it open than fill it in.
What Would Have to Move to Change This Reading
I will close by sizing the thing instead of summarizing it. The four second quarters in the table carry a combined positive net profit of KRW 50.558 billion and a combined negative operating cash flow of KRW 9.907 billion. The distance between those two totals is KRW 60.465 billion, which is USD 43.71 million at the rate above, and which is 12.7 percent of the KRW 475.574 billion market value I calculated. That is the size of the question, and it is not small relative to the company.
For the reading to break, one quarter would be enough in a specific way. If the third quarter of 2026 comes in with negative operating cash flow, then what I described is seasonal in appearance only, and is really a drift that happens to have started in the spring, and the whole note would need rewriting around a different question. If instead the third quarter is positive and the fourth is negative, as it was in 2024 and 2025, then I would have two halves of a year that behave differently and I would stop reading any single quarter of this company on its own. The number I will look up first in November is not operating profit. It is the cash flow statement, and specifically the line that the income statement never shows me.
Sources and the Numbers I Left Out of Hana Tour Stock
Four things I could have used and set aside. The 250-session high of KRW 53,400 and low of KRW 28,600, because the label describing how that range is built has disagreed with its own contents in past checks and I did not spend the time to verify it here. The treasury share history, where a board resolution on 2025-04-15 canceled 549,253 shares against a then-outstanding count of 16,039,185, followed by a 2025-12-02 filing for the purchase of 853,606 shares for KRW 39.65 billion; I could not reconcile those two events against the 15,491,028 shares outstanding as of the 2026-09-18 session and so I left the topic alone. The traveler counts the company publishes monthly, which belong to a different question than this one. And the debt ratio path from 293.44 percent at the end of 2025 to 256.37 percent at the end of June 2026, which I mention here only so it is on the record.
Financial figures come from the electronic disclosure filings, quarterly and annual, with single-quarter values built the way described above. Price and volume are the final row for Friday 2026-09-18 on the regular exchange session. Market capitalization is my own multiplication. Quarterly results commentary comes from Etoday and Dealsite, both Korean-language outlets whose reporting I am paraphrasing into English and not quoting in the original. Shareholder return figures come from Digital Today and the company’s own investor page. The exchange rate of 1,383.3 KRW per USD is the Seoul market daytime close for 2026-09-18, confirmed at Money Today and Asia Economy. The next statutory filing deadline is Monday, November 16, 2026.