Daeduck Electronics Earnings Behind a 116x P/E Multiple
A minimum return-on-equity screen is a sensible thing to leave switched on. Daeduck Electronics reported a 2.71 percent return on equity in 2024. A screen like that removes it before anyone sees the name, and never asks whether that number described the business or described one point in a cycle.
It described a point in a cycle. In the first six months of 2026 this company earned KRW 121.575 billion (about USD 85.88 million) in operating profit, which is 2.4780 times what it earned in the whole of 2025. The stock is up 347.44 percent over twelve months. I am writing this on the day I finally opened the file.
Having opened it, I am still only watching. The reason is arithmetic, and it takes the rest of this piece to explain.
Contents
The Arithmetic I Could Not Run on Daeduck Electronics Stock
Here is the question I could not answer. What does this company earn in a year? Below are five defensible answers, each with a source. The largest is 24.9670 times the smallest.
| Candidate answer | USD equivalent | Where it comes from |
|---|---|---|
| KRW 11.259 billion | USD 7.95 million | 2024 actual, audited |
| KRW 49.061 billion | USD 34.65 million | 2025 actual, audited |
| KRW 243.150 billion | USD 171.75 million | First half of 2026, doubled (my calculation) |
| KRW 255.200 billion | USD 180.26 million | Hana Securities 2026 estimate |
| KRW 281.104 billion | USD 198.56 million | Second quarter of 2026, multiplied by four (my calculation) |
All five are honest. All five come from real numbers. And a valuation multiple built on the first is a different object from one built on the last, by a factor of nearly twenty-five. This is the state I am in with this company, and I do not move off watching a business while I am in it.
Twenty times, between two years
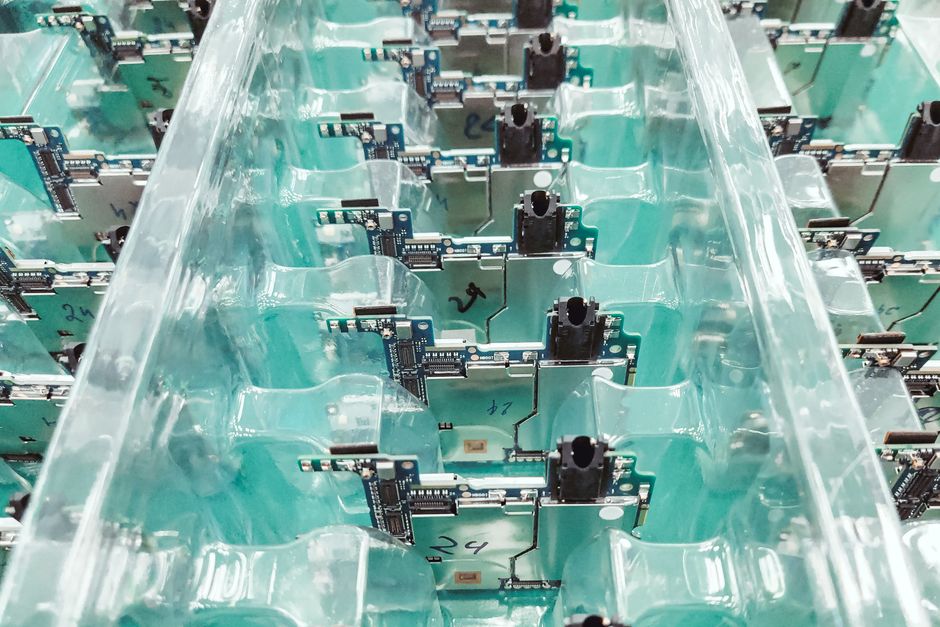
Daeduck Electronics (KOSPI: 353200) makes semiconductor package substrates and multilayer printed circuit boards. KOSPI is the main board of the Korea Exchange, roughly the local equivalent of the NYSE, with the smaller KOSDAQ board sitting alongside it for growth names. This company is on the main board and is not a small one. Market capitalization was KRW 5.298 trillion (about USD 3.7420 billion) at the August 12, 2026 close.
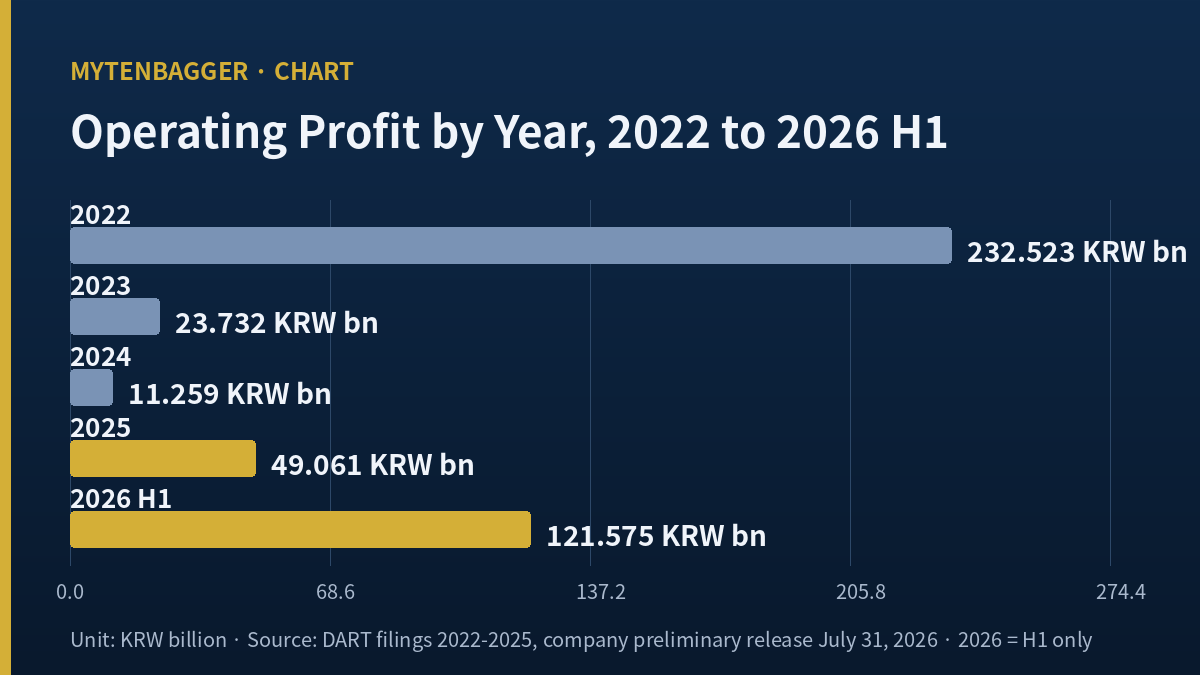
Its annual operating profit was KRW 232.523 billion (USD 164.25 million) in 2022 and KRW 11.259 billion (USD 7.95 million) in 2024. Dividing one by the other gives 20.6522 times by my calculation. Same company, same plants, broadly the same products, two years apart. Measured as a margin the swing runs from 17.67 percent to 1.26 percent, a factor of 13.9987.
| Year | Revenue | Operating profit | Margin | Net profit |
|---|---|---|---|---|
| 2022 | KRW 1,316.163bn | KRW 232.523bn | 17.67% | KRW 183.925bn |
| 2023 | KRW 909.651bn | KRW 23.732bn | 2.61% | KRW 25.377bn |
| 2024 | KRW 892.135bn | KRW 11.259bn | 1.26% | KRW 23.762bn |
| 2025 | KRW 1,065.294bn | KRW 49.061bn | 4.61% | KRW 47.605bn |
| 2026 first half | KRW 747.289bn | KRW 121.575bn | 16.27% | KRW 103.177bn |
Consolidated, from Korean regulatory filings; the 2026 half-year row is the company’s own preliminary release of July 31, 2026 and has not been through the semi-annual filing yet. The margin column is operating profit divided by revenue, computed by me; the filings print the two amounts and not the ratio. USD equivalents throughout use KRW 1,415.7 per dollar.
Part of the 2023 and 2024 collapse was demand. Part of it was cost the company had built for itself. Korean trade outlet Dealsite reported in May 2025 that roughly KRW 540 billion (USD 381.44 million) went into capacity between 2020 and 2023, that a further KRW 270 billion (USD 190.72 million) of FC-BGA capacity spending had been pushed out three years to the end of 2027, and that FC-BGA utilization at that point was under fifty percent. Depreciation on the finished lines runs regardless of whether the lines are full.
I cannot separate the demand piece from the cost piece with what is published. That matters, because the same two pieces are moving in the other direction now, and I would like to know which one is doing the lifting.
Where Daeduck Electronics Stock Sits, and on What Date
Everything below uses the August 12, 2026 (Wed) close of KRW 107,200, which is USD 75.72. I wrote this early on August 13, 2026 (Thu), so August 12 was the last completed session.
| Item | Value | Note |
|---|---|---|
| Close | KRW 107,200 / USD 75.72 | August 12, 2026 (Wed) |
| Market capitalization | KRW 5.298tn / USD 3.7420bn | 107,200 times 49,417,286 shares, my calculation |
| Trailing earnings multiple | 116.00 times | On trailing EPS of KRW 924.16 |
| 250-day high and low | KRW 198,000 / KRW 20,700 | Intraday; a span of 9.5652 times |
| Against that high and low | 54.14% of high, 417.87% above low | Recomputed at 107,200 |
| On closing prices | Peak KRW 190,900 (May 29), trough KRW 74,500 (Jul 30) | Down 43.84%, up 43.89% |
| Twelve-month return | +347.44% | 4th of 100 in its sector; sector median −15.44% |
| Debt to equity, interest cover | 30.10%, 7.73 times | First quarter of 2026 |
| Dividend | KRW 500 per share (USD 0.35), 0.47% | 2025 fiscal year |
One note on the price itself, because I got two different numbers from the same data vendor. Its headline quote reads KRW 107,600 while the daily series inside the same response ends at KRW 107,200 for August 12. Pulling the daily bars settled it: August 10 (Mon) closed at 107,600, August 11 (Tue) at 104,700, August 12 (Wed) at 107,200. The headline quote is Monday’s close, and its timestamp says so. Because of that, the three position statistics the vendor ships alongside it (54.3, −45.7 and 419.8) are all struck on 107,600, so I recomputed them on 107,200 for the table above. Market capitalization on 107,600 comes to KRW 5,317,299,973,600, matching the vendor’s figure to the won, which confirms which day it used.
Eighteen Quarters Behind Daeduck Electronics Stock, in One Column
Korean quarterly filings report flow items cumulatively, so the raw figures have to be unwound before they mean anything. These are discrete quarters. Amounts in KRW billion.
| Quarter | Revenue | Operating profit | Margin |
|---|---|---|---|
| 2022 Q1 | 305.351 | 44.772 | 14.66% |
| 2022 Q2 | 342.960 | 61.886 | 18.04% |
| 2022 Q3 | 371.401 | 77.532 | 20.88% |
| 2022 Q4 | 296.451 | 48.333 | 16.30% |
| 2023 Q1 | 217.653 | 10.273 | 4.72% |
| 2023 Q2 | 219.859 | 5.612 | 2.55% |
| 2023 Q3 | 237.787 | 1.416 | 0.60% |
| 2023 Q4 | 234.352 | 6.431 | 2.74% |
| 2024 Q1 | 214.765 | −2.886 | −1.34% |
| 2024 Q2 | 238.239 | 10.903 | 4.58% |
| 2024 Q3 | 232.654 | 9.218 | 3.96% |
| 2024 Q4 | 206.477 | −5.976 | −2.89% |
| 2025 Q1 | 215.375 | −6.202 | −2.88% |
| 2025 Q2 | 245.858 | 1.866 | 0.76% |
| 2025 Q3 | 286.173 | 24.448 | 8.54% |
| 2025 Q4 | 317.888 | 28.949 | 9.11% |
| 2026 Q1 | 346.314 | 51.298 | 14.81% |
| 2026 Q2 | 400.975 | 70.276 | 17.53% |
KRW billion. The margin column is my own division of the two printed columns and does not appear in the filings.
Across those eighteen rows the lowest operating profit is KRW −6.202 billion (2025 Q1) and the highest is KRW 77.532 billion (2022 Q3). The span is KRW 83.734 billion, about USD 59.15 million, and the sign changes four times inside it: negative in 2024 Q1, positive in 2024 Q2, negative again in 2024 Q4, positive from 2025 Q2 onward.
Revenue moved inside a 1.9420 band
Over the same eighteen quarters revenue ranged from KRW 206.477 billion (USD 145.85 million) to KRW 400.975 billion (USD 283.23 million). Highest divided by lowest is 1.9420 by my calculation. Revenue stayed inside a factor of two while profit crossed zero in both directions.
This is not a piece about operating leverage
The paragraph above invites that reading, and the reading is correct as far as it goes. Heavy fixed costs make small revenue moves into large profit moves. I have already written that argument about other companies, and repeating the same structure two pieces in a row would be writing the same article twice with different names in it.
What I am measuring here is different. Operating leverage describes the relationship between two lines. What I need is the dispersion of one line, considered on its own. If a company’s annual operating profit can be KRW 11 billion or KRW 233 billion, then I do not know what number belongs underneath a price. That question survives whether or not I understand the mechanism producing the swing. It is a question about my own procedure, and the mechanism does not answer it.
Every Quarter I Multiplied by Four Came Out Wrong
I tested the procedure I normally reach for against this company’s history, and it failed twice.
Take 2022 Q3. Operating profit of KRW 77.532 billion (USD 54.77 million) was the largest quarter the company had ever printed to that date. Treat it as normal and multiply by four and you get KRW 310.128 billion (USD 219.06 million). The four quarters that actually followed, from 2022 Q4 through 2023 Q3, summed to 48.333 + 10.273 + 5.612 + 1.416 = KRW 65.634 billion (USD 46.36 million). The projection overshot by 4.7251 times, my calculation.
Now take 2025 Q1. Operating profit of KRW −6.202 billion, annualized, gives a year of KRW −24.808 billion. The year came in at positive KRW 49.061 billion. That miss was not about magnitude at all. The sign was wrong.
So what happens if I run the same arithmetic today? The 2026 first half doubled comes to KRW 243.150 billion (USD 171.75 million). Two Korean brokerages sit slightly above that: Yuanta at KRW 259.7 billion, which is 1.0681 times the doubled half, and Hana Securities at KRW 255.2 billion, which is 1.0496 times. Both expect a second half larger than the first. I am not saying they are wrong. I am saying that the identical procedure, applied at two earlier points in this same company’s history, produced a 4.7 times overshoot and a sign error.
What the 116 Multiple on Daeduck Electronics Stock Divides
At the August 12, 2026 close the trailing earnings multiple is 116.00 times, computed on trailing EPS of KRW 924.16. That EPS carries earnings through 2025. Meanwhile the company has already booked 2.4780 times its full 2025 operating profit in six months of 2026. The 116 divides a period that has ended, which makes it a poor argument for expensive and an equally poor argument for cheap.
The obvious response is to divide by forward earnings instead. Hana at KRW 255.2 billion and Yuanta at KRW 259.7 billion make that possible on paper. To use either, though, I would have to forget the section directly above, in which forward arithmetic on this company failed twice by wide margins. I would rather keep the section and skip the calculation.
Two earlier pieces on this industry took different routes. On ISU Petasys I stayed on watch over capital-allocation judgment, and on LG Innotek I stayed on watch because the FC-BGA business was unproven and the customer base was concentrated. Neither applies here. Daeduck’s FC-BGA line is producing profit now, and I found nothing in its capital decisions to object to. What stops me is the calendar, and only the calendar.
Values I left out
- Price to book of 6.15 and book value per share of KRW 17,419. Multiplying that book value by the share count gives KRW 860.800 billion, while consolidated equity in the first-quarter filing is KRW 918.650 billion. The gap is KRW 57.850 billion, or 6.30 percent. I could not establish which equity base the vendor used, so the whole book-value family stayed out of the argument.
- The vendor’s EBITDA field of KRW 51.298 billion. It equals first-quarter operating profit to the won, which means depreciation was never added. Excluded.
- Three-year revenue growth of −6.81 percent annually. Start in 2022 and it is a decline; start in 2023 and it is growth. A statistic that flips on the starting point is not evidence.
- Payout ratio of 54.1 percent against a raw field of 69.2 percent. The two disagree, so I used neither. My own version, KRW 500 per share on 49,417,286 shares against 2025 consolidated net profit, gives 51.90 percent.
- Twenty-day co-movement divergence of −18.58 percentage points. Flagged as company-specific by the tool, unconnected to anything in this argument.
Four Korean Houses and Their Numbers for Daeduck Electronics Stock
I read none of the four reports in full. Everything below came through Korean press coverage of them, and I am flagging that before the table instead of burying it underneath.
| House and analyst | Date | Number that house published | Estimates cited |
|---|---|---|---|
| Hana Securities, Kim Min-kyung | June 15, 2026 (Mon) | KRW 250,000 (USD 176.59) | 2026 revenue KRW 1,547.7bn and operating profit KRW 255.2bn; 2027 KRW 1,791.2bn and KRW 339.9bn |
| Daol Investment, Kim Yeon-mi | July 15, 2026 (Wed) | KRW 230,000 (USD 162.46) | 2026 Q2 revenue KRW 385.5bn, operating profit KRW 66.8bn at a 17.3% margin |
| Yuanta Securities | July 8, 2026 (Wed) | KRW 200,000 (USD 141.27) | 2026 revenue KRW 1,534.0bn and operating profit KRW 259.7bn at 16.9%; Q2 at KRW 63.5bn |
| Eugene Investment | April 30, 2026 (Thu) | KRW 190,000 (USD 134.21) | Raised after the first quarter turned to a KRW 51.3bn operating profit |
Highest over lowest is 1.3158 times, my calculation. That is a narrow spread by the standards of the Korean names I have written up this year, and it says the four agree on direction even where they differ on degree. The lowest of the four still sits 1.7724 times above the August 12 close.
Two houses came in under the print
Second-quarter operating profit landed at KRW 70.276 billion. Daol had modeled KRW 66.8 billion and Yuanta KRW 63.5 billion, so the print beat them by 1.0520 and 1.1067 times respectively, both my calculation. Daol published sixteen days before the release and Yuanta twenty-three days before.
There are two ways to read that. One is that the recovery is running ahead of professional expectations, which is bullish. The other is that this company’s quarterly profit is hard to forecast even for people who follow it continuously, which is the reading that matches my argument. I lean to the second. I am not claiming the first is false.
Ibiden Publishes a Year and This Company Does Not
Ibiden Co., Ltd. (Tokyo: 4062) is among the leaders in semiconductor package substrates worldwide, and it reported the same three months. On August 4, 2026 (Tue) it posted net sales of JPY 123.2 billion, up 26.4 percent year on year, operating profit of JPY 26.9 billion, up 52.4 percent, and net income of JPY 17.9 billion, up 40.8 percent. Yen figures are quoted in the currency of the original disclosure and are not converted here.
Same quarter, same end demand. Daeduck’s operating profit rose 37.6613 times year on year by my calculation, from KRW 1.866 billion to KRW 70.276 billion. Ibiden’s rose 1.524 times. The growth rates differ by a factor of roughly seventy, and that gap is not a statement about which company executed better. It is a statement about the base each one was measured from. Ibiden had a functioning prior-year comparison. Daeduck’s prior-year second quarter was close to zero.
Then comes the part that decided the peer choice. On that same day Ibiden raised its own full-year forecast, lifting ordinary profit guidance from JPY 90 billion to JPY 127 billion, a rise of 41.11 percent, and net income guidance from JPY 58 billion to JPY 84 billion, a rise of 44.83 percent. A company stated what its year would be, then revised the statement. Daeduck Electronics publishes no such number. If I want an annual figure for it, I have to pick one of the four brokerage estimates in the table above, and every one of those was produced outside the company.
That is why Ibiden is the comparison here. The criterion is not scale or margin or product mix. It is whether the company itself supplies the number my valuation needs, and one of these two does.
The limits are worth stating plainly. Ibiden is much larger, reports on a different fiscal calendar and under different accounting standards, and runs a ceramics business alongside electronics. I built no side-by-side margin or multiple table, because such a table would compare two things that are not measured the same way. The single fact I took from Ibiden is the existence of a company-issued annual figure.
My Position on Daeduck Electronics Stock
The rule I am applying is this. When I cannot name a company’s annual profit, I wait until I can. That is a statement about my procedure and not a judgment on the business. The first half of 2026 was strong, revenue and profit moved together, the balance sheet carried the whole cycle without strain, and both segments grew. None of that is in dispute.
My difficulty is that valuation needs an earnings figure to divide by, and this company has not supplied one that holds still. Eighteen quarters ran from KRW −6.202 billion to KRW 77.532 billion. Annual profit moved 20.6522 times in four years. Two separate attempts to annualize a quarter, tested against what actually happened, missed by 4.7 times in one direction and by a sign in the other. What I have today is two excellent quarters. I do not build an average out of two observations.
The condition that would end this position
If the third and fourth quarters of 2026 each come in at or above the first-half average of KRW 60.788 billion (USD 42.94 million, my calculation), I will have four consecutive quarters at a comparable level, and at that point this company has a normal year and I discard the argument in this article. If either quarter drops below roughly KRW 20 billion, the two good prints were the peak, and what I revise then is not the argument but how often I reopen the file.
Either way, what I am waiting for is a count and not an improvement. The business does not need to get better. The same level needs to repeat.
Before November, one document is due. Korea’s semi-annual filing deadline for this company falls on Friday, August 14, 2026, and the half-year numbers above are still the company’s preliminary release. That filing is where the audited figures land, and where I expect to see a depreciation line I can finally read. If the Dealsite reporting from 2025 holds and depreciation stays heavy through 2027, then today’s profit is arriving with that weight already on it.
Fourteen Things That Work Against Me
- My four-quarter threshold is arbitrary. I cannot defend three as too few or six as excessive. The test in this article came out of how I usually work, and the data had no say in it. This is the objection I like least.
- My tool failed, and the company did not. Demanding a normal year from a capital-intensive cyclical may be an unreasonable thing to ask in the first place.
- Today’s profit already carries the depreciation. If that burden really does run through 2027, earnings after it clears are larger than what I am looking at.
- The dividend never tracked the earnings. KRW 400, 300, 400 and 500 across 2022 through 2025. The company may have had a clearer view of its own normal than I do.
- The 2023 and 2024 trough may not belong in the sample. A memory downturn overlapped with the startup costs of new FC-BGA capacity. If that combination was a one-off, including those years distorts everything I computed.
- An absent normal cuts upward too. My framing leans defensive, and the identical logic says the upside is equally unbounded.
- The whole industry is moving the same way. Ibiden lifted its year by 41.11 percent. This is not one company’s isolated good patch.
- Hana models 2027 above 2026. Its KRW 339.9 billion estimate is 1.3319 times its 2026 number, which is not a peak assumption.
- The balance sheet absorbed the swing. Debt to equity of 30.10 percent and interest cover of 7.73 times, and equity never shrank through the trough.
- The print beat the estimates. Two houses modeled below the result. Hard to forecast cuts both ways, and it cut upward this time.
- All four houses are constructive. Even the lowest number published sits 1.7724 times above the current price.
- Both segments grew. Package substrates at KRW 343.5 billion, up 65 percent year on year, and MLB at KRW 57.5 billion, up 53 percent. This is not one product carrying the quarter.
- Revenue grew alongside profit. The KRW 400.975 billion second quarter is the largest of the eighteen in my table.
- The improvement ran five consecutive times. Across six quarters from 2025 Q1: −6.202, 1.866, 24.448, 28.949, 51.298, 70.276. It arrived in order, over more than a year.
Korean memory makers, Samsung Electronics after its record quarter
Basis and Sources
If someone asks me what Ibiden earns in a year, I can answer, because Ibiden answered first and then revised the answer upward on August 4, 2026. If someone asks me what Daeduck Electronics earns in a year, I have four numbers from four brokerages, a set of quarters that refuse to sit still, and nothing at all from the company. The question I can answer turns out to be about the business in Japan. That was never the one I set out to write about.
Prices and multiples reflect the August 12, 2026 (Wed) close as checked at the time of writing. Korean won is the reference currency throughout, and USD conversions are approximate, at roughly KRW 1,415.7 per dollar on that same date as reported by Korean financial press. Yen figures for Ibiden are quoted as published and left unconverted. Financial history comes from consolidated statements in Korea’s DART filing system, with quarterly flow items unwound from cumulative disclosure into discrete quarters. Any figure I describe as “my calculation” was produced by dividing or subtracting two published numbers and does not appear in a filing.
Press sources: second-quarter results from Korean trade publication The Elec and Digital Today; the Hana and Daol reports via Newspim; the Yuanta estimates via Hantoday; the FC-BGA capacity history and utilization figure via Dealsite, dated May 2025; shareholder structure via WiseReport; Ibiden results and guidance via Ibiden investor relations and Japanese market commentary on the August 4 release. All four brokerage views reached me through secondary Korean coverage; I read none of the underlying reports.
Things I could not confirm: the first-half depreciation figure, because the semi-annual filing is not out; the 2026 level of FC-BGA utilization, since the number I quoted is from May 2025; the four brokerage reports in their original form; second-quarter profit by segment, as the company disclosed segment revenue only; and the cause of the 6.30 percent gap between the vendor’s book value per share and consolidated equity in the filing.