LX Hausys Earnings: Six Months of Profit at 7.7 Times Last Year
- Won. Operating profit of KRW 100.8 billion in the six months to June 2026, against KRW 13.06 billion for the whole of 2025.
- Percent. Revenue over the same six months grew 9.6 percent. That is the entire top-line movement behind the profit figure above.
- Times. 7.72. That is the first number divided by the second, and it is the only number in this entry I made myself.
Six filed months beat twelve filed months. LX Hausys stock belongs to a Korean maker of interior and construction materials that reported KRW 100.8 billion of operating profit for the first half of 2026, while the whole of 2025 left it with KRW 13.06 billion. I divided one by the other and got 7.72. Then I spent the rest of my reading trying to work out whether that ratio describes a recovery or a comparison against a floor.
I do not own this name and I have no order working. It sits well outside the top hundred of the Korean market by value, which is where my default is to watch and not to take a position, and nothing I found this weekend moved me off that default. What follows is the arithmetic I ran and the places where I could not close it.

Contents
The four pieces of 2025 that LX Hausys stock is priced against
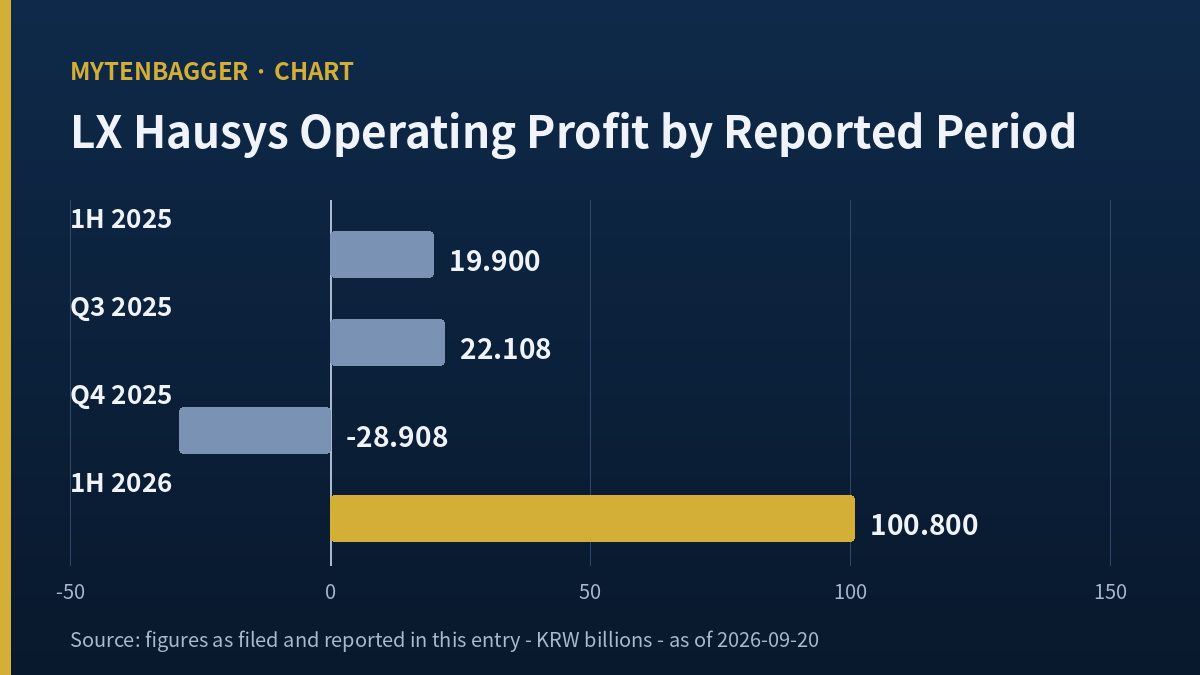
Before the ratio meant anything I had to see how 2025 got to KRW 13.06 billion. The year comes apart into pieces, each one reported by the Korean press from the company’s own filings. The first half produced KRW 19.9 billion. The third quarter added KRW 22.108 billion. The fourth quarter then took away KRW 28.908 billion as an operating loss. Adding those three gives KRW 13.1 billion, which lands KRW 0.04 billion from the KRW 13.06 billion the annual figure shows, and I treat that gap as a rounding difference and not as a missing item.
So the full-year number is not a small profit earned evenly. It is a positive nine months with a loss bolted onto the end. The fourth quarter of 2024, by contrast, had produced KRW 4.91 billion of operating profit on its own. The swing in that single quarter is most of the story of the year.
The year before that is the other half of the frame. For 2024 the company filed KRW 97.465 billion of operating profit. Set against revenue of KRW 3,178.689 billion in 2025, the KRW 13.06 billion the company actually kept works out to an operating margin of 0.41 percent. The same arithmetic on the first half of 2026 gives 5.75 percent. Both of those percentages are mine.
The two segments behind LX Hausys stock, and which one moved
The second quarter of 2026 is where the movement is visible with segment detail attached. The company filed revenue of KRW 939.692 billion, operating profit of KRW 54.903 billion, and net profit of KRW 47.092 billion, against a net loss of KRW 0.081 billion in the same quarter a year earlier. Korean coverage of the release splits that quarter two ways.
| Second quarter 2026 | Revenue | Operating profit | Share of profit |
|---|---|---|---|
| Interior and construction materials | KRW 655.7bn | KRW 36.7bn | 66.85% |
| Automotive materials and industrial film | KRW 284.0bn | KRW 18.2bn | 33.15% |
| Two segments added | KRW 939.7bn | KRW 54.9bn | 100% |
Segment figures as reported by Korean press from the company release of July 30, 2026. The two profit shares are my own division; the two segment profits add to the filed quarterly figure exactly.
The larger segment carries 69.78 percent of the revenue and 66.85 percent of the profit, so the two shares sit close together. What separates the two halves of the business is not their size in this quarter but how far each traveled to get there. Korean coverage reports the interior and construction segment lifting revenue 19.9 percent year on year while its operating profit rose 4,487.5 percent. Working backwards from those two growth rates, the same segment made roughly KRW 0.8 billion a year earlier on roughly KRW 546.9 billion of revenue. Both of those are my back-calculations from published percentages, and both carry whatever rounding the percentages carry.
If I take those back-calculated figures at face value, the segment added roughly KRW 108.8 billion of revenue and roughly KRW 35.9 billion of operating profit, which means about 33 percent of the incremental revenue arrived as profit. That is what a business looks like when its costs hold still and its volume does not. I find that sentence more useful than any margin level, because it tells me what the next won of revenue is worth instead of what the average won was worth.
The revenue line moved less than any of this suggests. Full-year 2025 revenue of KRW 3,178.689 billion was 11.0 percent below 2024, and the fourth quarter of that year came in at KRW 765.156 billion, down 14.1 percent on the same quarter a year earlier and 5.8 percent on the quarter before it. Then the first half of 2026 arrived at KRW 1,754.4 billion, up 9.6 percent, with the second quarter running 15.3 percent ahead of the first. So the top line fell through 2025 and turned in 2026, and it turned by single digits while the profit line turned by multiples. Whatever is happening here is happening below the revenue line.
The distance between operating profit and net profit deserves its own paragraph. The filed second quarter shows KRW 54.903 billion of operating profit and KRW 47.092 billion of net profit, so roughly a seventh of the operating line did not reach the bottom. Across the first half the same two lines read KRW 100.8 billion and KRW 77.534 billion, a wider gap, measured against a first-half net loss of KRW 2.523 billion a year earlier. I did not open the finance cost note, so I cannot tell how much of that distance is interest on borrowings and how much is tax. What I can say is that it is not trivial at this level of profit, and that it is wider across the half than it is in the single quarter.
One caution on the numerals. The first half of 2025 produced KRW 19.9 billion of operating profit, and the interior segment grew revenue 19.9 percent in the second quarter of 2026. Those two are unrelated and I nearly conflated them in my own notes.
One line inside the quarter was not operating, and LX Hausys stock has to know it
The company’s own explanation of the quarter lists several causes together: a recovering remodeling market, wider direct-to-consumer sales, export growth in industrial film, higher automotive fabric volumes on North American sport utility production, cost reduction, and a one-off gain from a customs duty refund at its United States subsidiary.
That last item is the one I keep circling. A customs refund lands in the same operating profit line as a sale of flooring, but it does not repeat and it does not tell me anything about demand. I could not find the amount of the refund anywhere I looked, which means I cannot subtract it, which means the KRW 54.903 billion figure I have been dividing by is the correct filed number and also an unknown amount larger than the underlying quarter. Both of those statements are true at once and I have not found a way to narrow them.
Segment economics in adjacent Korean industrial names have behaved in ways I have written up before. I looked at what capacity expansion did to a Korean materials maker’s export line in the entry on Kolon Industries doubling para-aramid capacity, and at how a building-products payout consumed almost a whole year of profit in the Hanil Cement entry. Neither of those had a one-off sitting inside the operating line the way this quarter does.
A flooring peer I will not put in a table next to LX Hausys stock
For a global reference I picked Mohawk Industries (NYSE: MHK). My criterion was narrow and new for me: I wanted a listed company that consists only of the larger of my subject’s two segments. Mohawk sells flooring, tile and surfaces and carries no automotive materials arm at all, so it is close to what this Korean company would look like if you deleted a third of it.
The method I am using is deliberately thin. I am printing one ratio from Mohawk and no money at all. For its 2025 financial year, Mohawk’s operating margin works out at 6.62 percent, which I calculated from the two figures on its own income statement without converting either into won. My subject’s comparable figures are 0.41 percent for 2025 and 5.75 percent for the first half of 2026, each calculated inside its own filings. I am not subtracting these percentages from one another and I am not dividing them.
There is a specific reason for that restraint. While checking this company I found that the same aggregator screen I would have pulled Mohawk’s numbers from reports a different operating profit for my subject than the Korean filing does. Once I know a screen’s operating profit line can diverge from the filed line for one company, I will not lay that screen’s operating profit for another company alongside a filed Korean figure and call the pair a comparison.
The closest parallel in my own notes is a Korean maker of construction chemicals where a segment disclosure carried most of the information in the whole filing. I wrote that one up in the KCC entry on half its revenue coming from silicones, and the lesson there was the same: the consolidated line tells you less than the split does.
What the Mohawk ratio does tell me is an order of magnitude. A mature flooring business in a mature market runs mid single digit operating margins. My subject ran 0.41 percent for a full year and 5.75 percent for a half year. The half-year figure is inside the range a healthy peer occupies; the full-year figure is nowhere near it. Those two facts together are why one ratio of 7.72 is interesting and also why it is not by itself evidence of anything durable.
The 2026 estimates I am borrowing from two sources
Coverage exists, which is not always the case at this size. On September 18, 2026, Hyundai Motor Securities analyst Shin Dong-hyun published a 2026 estimate of KRW 3,374.0 billion of revenue and KRW 135.0 billion of operating profit, citing a recovery in housing transaction volumes, wider direct-to-consumer sales, and steady overseas revenue from the non-construction segment. Earlier in the year a Korean market write-up collected a range of brokerage estimates for 2026 of KRW 3,257.0 billion to KRW 3,283.9 billion of revenue and KRW 106.0 billion to KRW 110.0 billion of operating profit. The same write-up carried the cautious read as well, pointing at chemical feedstock prices and freight costs weighing on the second half.
Both estimate sets sit above the KRW 13.06 billion the company actually filed for 2025, which is unsurprising given that the first half of 2026 alone has already cleared them by a wide margin on the profit line. What I take from the pair is the spread between them, and not the level of either: two published views of the same year differ by roughly a quarter on operating profit, which is a reasonable measure of how uncertain this line is at this point in the cycle. I am not adopting either figure as my own view.
A note on what I am not printing here. There are published price objectives on this name from two Korean houses, one raised and one cut, eight months apart. I read both and I am not reproducing either figure in this entry, because a price objective from someone else is not a number I use and putting it in a journal invites me to treat it as if it were.
Three paths I can see from here
I put rough weights on these because writing them down makes me argue with myself later. They are my own judgment of likelihood and nothing more.
The path I think most likely, about 45 percent. The second half holds a mid single digit operating margin without repeating the second quarter, the full year lands somewhere between the two published estimate sets, and the ratio of 7.72 becomes a footnote to a year that was simply normal after a year that was not. In that case the interesting number stops being the multiple and starts being whether a margin near 5 percent is the ceiling of this business or a waypoint.
Where I could be wrong, about 33 percent. The customs refund and the other one-time items inside the second quarter are large enough that the underlying half-year margin is closer to 4 percent than to 5.75, and the third quarter prints below the KRW 22.108 billion the same quarter produced in 2025. That outcome would leave the first half standing as a filed fact. It would also turn my division of two filed numbers into a description of accounting timing and of nothing else.
The remaining cases, about 22 percent. On the better side, roughly 13 percent, housing transaction volumes keep climbing, the interior segment holds an incremental margin near a third, and the full year clears the higher of the two published estimate ranges. On the worse side, roughly 9 percent, feedstock and freight costs move against the company in the second half exactly as the cautious read warned, and a fourth quarter turns negative for a second consecutive year, which would make the pattern seasonal and put the whole comparison I built this entry on back in the drawer.
Values I left out of this LX Hausys stock entry
Per-share earnings and the multiple built on them
Four screens gave me four different per-share earnings figures for the same company and three different price multiples. The company has a preferred share class, so the share count underneath a per-share calculation can legitimately differ between sources. I could not establish which share count each screen used, so I used none of them.
The aggregator’s operating profit line
The screen I used for the older annual data reports 2025 operating profit an order of magnitude below the filed Korean figure, and 2024 below it as well, while matching revenue to the won. I used that screen only for lines I could not source elsewhere, and never for profit.
Cost of revenue and gross profit
Both lines are available for five years, and the ratio between them and revenue is stable enough to be worth a paragraph. I left them out because the operating profit line below them is the one in dispute, and a cost ratio whose bottom line I distrust is a ratio I cannot interpret.
The fifty-two week range
Two screens agree on it. I did not use it because I could not establish how many trading days either end of that range represents.
Dividend history
Payments were made in each of the last five years and the analyst note above refers to the possibility of a resumption, which implies an interruption I did not independently confirm. I left the dividend out of this entry entirely, because describing a schedule I had not verified would have been worse than leaving a gap.
Twenty-two places where my reading of LX Hausys stock can fail
- A tariff refund is sitting inside the number I divided by, and I could not size it. I spent an hour treating the quarterly operating profit as a clean demand signal before I read the company’s own list of causes and found the refund on it. The check I am keeping: before calling a jump in operating profit a recovery, read the company’s own list of what went into it, and only then start dividing.
- Six months against twelve months is not a like-for-like window. The ratio of 7.72 would fall if I annualized, and I chose not to annualize.
- Half-year results are seasonal in this industry and I did not establish the seasonality.
- The fourth quarter of 2025 was a loss. If fourth quarters are structurally weak here, the first half of any year flatters the full year.
- The 2025 base is close to zero, so almost any recovery produces a large multiple.
- Adding the three 2025 pieces left KRW 0.04 billion over, which I put down to rounding without checking.
- Segment figures came from press coverage of a company release; the audited statements were not my source.
- The two back-calculated year-earlier segment figures inherit the rounding of the percentages I derived them from.
- The incremental margin of about 33 percent rests entirely on those back-calculations.
- A one-quarter incremental margin is not a run rate.
- Cost reduction was listed among the causes and I could not tell permanent from temporary.
- Higher automotive fabric volumes depend on one vehicle category in one region.
- Remodeling demand in Korea depends on housing transaction volumes, which are policy sensitive.
- The quarterly figures are described in the filing as provisional under Korean accounting standards and may change on audit.
- I used two different reporting frames in one entry, quarterly and annual, and mixing them can hide a trend.
- The peer’s operating margin comes from the same aggregator whose operating profit line diverged from the filed figure for my subject, and I have no way to test it on a US filer.
- Mohawk operates in different end markets with a different cost base, so even the order-of-magnitude comparison is loose.
- The two published 2026 estimate sets differ in date as well as in level.
- Revenue growth of 9.6 percent in the first half is modest, and a profit multiple built on modest revenue growth is fragile.
- I did not open the segment note in the interim report, so I do not know how corporate costs are allocated between the two segments.
- Watching costs me less than owning would when I am wrong, and that colors the tone of this entry.
- I picked the half-year against full-year comparison because it produced a striking ratio, and that is a selection I made.
What breaks this reading, and the hypothesis I dropped last
Five conditions would end the reading above.
- If the third-quarter report shows an operating profit below the KRW 22.108 billion the same quarter produced in 2025, then the first half was the recovery and not the start of one.
- If the interim segment note shows the customs refund large enough to account for most of the second-quarter gain, the incremental margin I calculated collapses.
- If fourth-quarter operating profit turns negative again, the pattern is seasonal and not directional and the full-year comparison I built on loses its meaning.
- If the automotive materials segment gives back its profit share while the interior segment holds, the business is narrower than the two-column table above suggests.
- If the audited figures move the provisional quarterly numbers materially, every ratio in this entry moves with them.
The hypothesis I dropped last was the one I liked most. I had built a first draft around five years of operating profit swinging by more than seventy times while revenue stayed inside a narrow band, and I had the table written. I threw it out after finding that the annual operating profit figures I had taken from an aggregator did not match the Korean filings for either of the two years I could check. What survived that deletion is a single division of one filed number by another filed number, which is less exciting and which I can defend. I am watching, and the third-quarter report is where I will look first.
Share price references use the September 18, 2026 close of about $24.22, which puts the ordinary shares at roughly $217.17 million, converted at 1,383.3 won per dollar on the same date and rounded. Won figures are as filed or as reported from company releases; percentages and ratios described as mine are rounded to two decimal places. Sources: the July 30, 2026 provisional results filing, Herald Business on the second quarter, Herald Business on the 2025 full year, Mohawk Industries income statement, Korea Economic Times on the January 2026 estimate cut, Money Today on the September 18 won close, Asia Economy on the same session.