Satrec Initiative Stock: A 4.5x Price Swing on Rising Revenue
On February 4, 2026, Satrec Initiative stock closed at KRW 214,000. Ten months earlier and two months later the same shares changed hands at less than a quarter of that. I have been watching this company from outside, holding none of it and placing no order, and what pulled me in was the size of that swing set against how little the underlying business did to earn it.
1. The company was priced at 11.327 times its annual revenue on one day and 2.509 times on another, and both days fall inside the same 250 trading sessions. I take the market value on each day and divide it by fiscal 2025 revenue of KRW 206.92 billion. The two highest and lowest closes in that window give those two figures by my calculation.
2. The revenue underneath went one way. KRW 91.36 billion, then 125.43, then 171.28, then 206.92, across fiscal 2022 through fiscal 2025. Four consecutive years of increase, with no reversal to explain a price cut of that depth.
3. As of the September 4, 2026 close of KRW 70,700 the multiple is 3.742 times. That is nearer the bottom of the range than the top, and it is the lowest revenue multiple among the four listed Earth observation businesses I put side by side further down.
4. It is also the only one of those four that earned a profit in its last reported year. The other three lost money. That combination is what keeps me reading instead of walking away, and it is also why I am not treating the low multiple as a bargain on its own.
Contents
Satrec Initiative Stock, the KOSDAQ Listing, and the Close I Used
A market that American accounts rarely touch directly
Satrec Initiative trades on KOSDAQ under the code 099320. KOSDAQ is the smaller of South Korea’s two main equity boards, run by the same exchange operator as KOSPI but populated by younger technology, biotechnology and defense contractors. When American coverage of Korean equities appears, it is almost always about KOSPI names such as Samsung Electronics or Hyundai Motor. KOSDAQ companies of this size rarely surface at all, which is part of why I keep a file on them.
The company builds satellites. Its SpaceEye line covers small and medium Earth observation platforms, and it also sells payloads, ground control software and image processing. It does not build launch vehicles, which is a distinction I keep having to make when people hear the word space.
The close I am working from, and why
I am writing in the small hours of Saturday, September 5, 2026, so the last completed session is Friday, September 4, 2026. The close that day was KRW 70,700, up from KRW 67,400 the session before, a move of 4.90 percent by my calculation. Every price in this piece refers to that Friday close unless I say otherwise.
Multiplying by 10,951,909 shares outstanding gives a market value of KRW 774.30 billion, roughly USD 573 million. The vendor screen I use prints 7,743 in units of one hundred million won, which matches to the last digit. A Korean broker screen carries a marginally different share count, small enough to leave market value untouched but large enough to move per-share figures in the first decimal place. I have kept per-share measures out of my argument here for that reason.
Satrec Initiative Stock Priced at 3.742 Times Revenue Today
The number I divide by, stated plainly
Every multiple in this piece divides market value by fiscal 2025 revenue of KRW 206.92 billion, taken from the audited annual filing. I chose the completed fiscal year over a trailing four-quarter window for one reason: I want the same figure sitting under every date I compare, so that any difference between the figures comes from the price and from nowhere else. A trailing window would shift underneath me as I walk backwards through the calendar, and then I would be measuring two things at once.
The screen reproduces the same figure
My working came out at 3.742 times. The vendor screen prints a price-to-sales ratio of 3.74 for the same company, which tells me the screen is dividing by the same revenue line I am. That agreement matters more than it sounds. When my own arithmetic and a commercial screen land on the same value, I know I have not quietly picked a different revenue definition, and the historical figures I build on that same revenue line inherit the check.
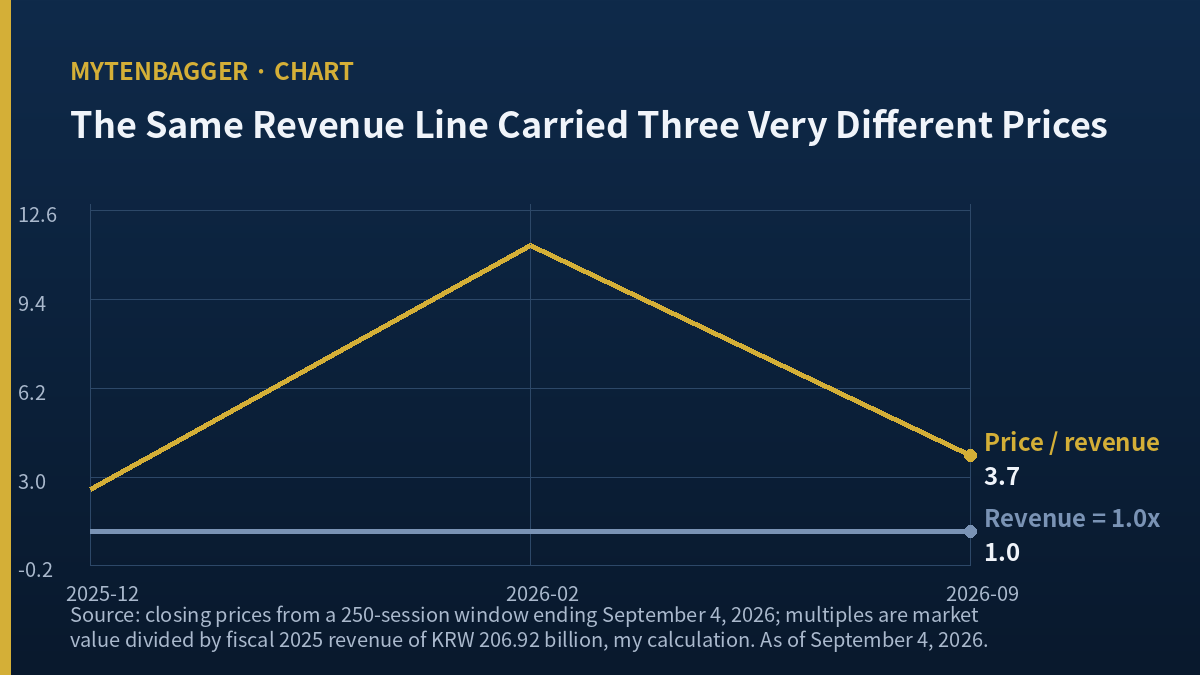
The Same Revenue Line Carried Three Very Different Prices
February 4, 2026, at 11.327 times
The highest closing price in the 250 sessions ending September 4, 2026 was KRW 214,000, set on February 4, 2026. At that close the company was worth KRW 2,343.71 billion, which is 11.327 times the same fiscal 2025 revenue, by my calculation.
December 2, 2025, at 2.509 times
The lowest close in the same window was KRW 47,400 on December 2, 2025, giving a market value of KRW 519.12 billion and a multiple of 2.509 times. The two dates sit about two months apart on the calendar, one before the other, and between them the market changed its mind about this company by a factor of 4.515.
What sat still while that happened
Fiscal 2025 closed on December 31, 2025, right between those two dates. So the annual revenue figure that both multiples divide by was being finalised across exactly the period when the price quadrupled. Whatever the market was reacting to in January and early February of 2026, it was not a revenue number, because that number was still being closed. The audited annual report carrying it was filed on April 6, 2026, two months after the peak.
I want to be careful here. I am not claiming the buyers were wrong or irrational. Forward expectations, order announcements and sector sentiment all move prices legitimately, and I have not identified what moved this one. What I can show is the arithmetic: the lower value held still and the market value above it moved 4.515 times.
Satrec Initiative Stock Sits on Revenue That Only Went One Way
Four fiscal years, four increases
| Fiscal year | Revenue (KRW bn) | Change | Operating margin |
|---|---|---|---|
| 2022 | 91.36 | -8.46% | |
| 2023 | 125.43 | +37.30% | -3.47% |
| 2024 | 171.28 | +36.55% | -1.79% |
| 2025 | 206.92 | +20.81% | +4.92% |
Revenue rose 126.49 percent over the three years, a compound annual rate of 31.33 percent by my calculation. All four figures come from audited annual filings, and the percentage changes are mine.
The growth rate itself is slowing
Two years of roughly 37 percent were followed by one year of 20.81 percent. That is still growth, and it is well above what most industrial companies of this size manage, but the deceleration is real and I am not going to paper over it. It is one of the few things in this company’s published record that moves in the direction the price moved.
Operating margin crossed zero once in four years
The operating line went from minus 8.46 percent to minus 3.47, then minus 1.79, then plus 4.92 percent in fiscal 2025. In absolute terms fiscal 2025 operating profit was KRW 10.18 billion, and net profit was KRW 14.09 billion. That first positive year arrived after the December 2025 low and before the February 2026 high, which is the one piece of fundamental news that plausibly sits inside the run-up. Preliminary results for a Korean company usually reach the market before the full annual filing, so the timing works. I have not been able to date that preliminary release, so I am flagging the sequence as consistent and stopping short of proven.
The half year since then has been mixed
For the six months to June 30, 2026 the company reported revenue of KRW 88.33 billion and an operating loss of KRW 0.64 billion. Taking the first quarter out leaves a second quarter with KRW 51.14 billion of revenue and KRW 1.37 billion of operating profit, so the quarter itself was positive and the half was not. One quarter is a thin basis for a direction, and I am waiting for the third quarter report instead of extending the line.
Satrec Initiative Stock Against Three Listed Earth Observation Peers
The rule I used to pick them
I included listed companies whose revenue comes from Earth observation satellites they build or operate, and nothing else. That rule kept out the large diversified primes, whose satellite work is a fraction of a much bigger business and whose multiples would say nothing about this company. It left me with three American-listed names against one Korean one.
The table
| Company | Market value | Revenue | Value / revenue | Last reported bottom line |
|---|---|---|---|---|
| Satrec Initiative (KOSDAQ: 099320) | KRW 774.30bn (about USD 573M) | KRW 206.92bn (about USD 153M) | 3.742 | Positive, KRW 14.09bn |
| BlackSky Technology (NYSE: BKSY) | USD 838.96M | USD 108.92M | 7.70 | Negative, USD 66.71M |
| Planet Labs (NYSE: PL) | USD 6,480M | USD 378.28M | 17.13 | Negative, USD 359.87M |
| Satellogic (NASDAQ: SATL) | USD 711.82M | USD 31.91M | 22.31 | Negative, USD 103.90M |
The final column reports a sign, and it is the column I find hardest to look past. Three companies in a young industry are being priced at 7.70, 17.13 and 22.31 times revenue while losing money. The fourth is priced at 3.742 times and made money last year.
The five places this table is loose
Five of them. First, the American revenue figures are trailing twelve months and the Korean one is a completed fiscal year, so the windows differ. Second, the three American companies are primarily operators selling imagery and analytics, while this company primarily manufactures and sells hardware, and manufacturers earn lower multiples almost everywhere. Third, the market values were read on September 4, 2026 except Satellogic, whose page carried the September 3 close. Fourth, converting won to dollars at a single rate adds error I have not tried to remove. Fifth, four companies is a small sample and three of them share one listing venue and one investor base.
Given all five, I would not use this table to conclude that Satrec Initiative stock is cheap. What I do take from it is narrower and I think it survives the objections: the profitable member of this group carries the lowest revenue multiple in it, and that ordering is unusual enough to be worth writing down.
Satrec Initiative Stock and the Problem of Reaching It
No depositary receipt that I could find
I looked for an American depositary receipt for this company and did not find one. If it exists I missed it, and I would rather say that than state a clean absence. Without one, an American holder wanting these specific shares needs a broker offering direct Korean market access, which several do, and needs to accept won settlement.
The route I could not verify, which is the honest limit here
The usual indirect answer is a broad Korea fund. I could not confirm whether this particular company sits inside any of the widely held Korea products, and the reason I could not is structural, and it is not laziness: it is a KOSDAQ company with a market value near USD 573 million, and the best known Korea funds weight toward large KOSPI constituents. It may be present in a small position, it may be absent, and I did not find a holdings file I trusted enough to quote. So the caveat I am leaving is not about liquidity or law. It is that I cannot tell you whether you already own a sliver of this company through something else, and neither the exchange nor the vendor screens I use will tell me.
On the direct route, depth is workable but thin. Average volume over the last twenty sessions was 41,491 shares, which at the September 4 close is about KRW 2.93 billion or roughly USD 2.2 million of turnover a day by my calculation.
Numbers I Left Out of This Piece
The cash line, which I found and deliberately set aside
Across the five reporting periods my data covers, from fiscal 2022 to the first half of 2026, the sign of operating profit and the sign of operating cash flow are opposite in every one. Fiscal 2025 is the loudest instance: operating profit of positive KRW 10.18 billion against operating cash flow of negative KRW 74.02 billion. It is a genuine finding and it would carry an article.
I am not using it. I have built an argument about profit and cash diverging twice in the past four days, on other companies, and a third run at it inside a week stops being an observation about any of them and becomes a template of mine. The finding keeps. I will use it when enough time has passed that it means something again.
The equity jump between 2022 and 2023
Total equity rose from KRW 121.17 billion to KRW 218.26 billion, an increase of KRW 97.09 billion, while that year’s net profit of KRW 41.47 billion covers less than half of it. A capital increase was announced in July 2023, but the original filing returned a 403 error and I could not read the terms. Knowing the size of the gap without knowing its terms is not enough to build on.
Volume in January and February 2026
Turnover on January 2, 2026 reached 1,249,447 shares, about thirty times the recent twenty session average. February 12, 2026 saw 1,061,510. The highest close of the window came in the middle of that stretch. I could not tie either day to a disclosure or a news item, so this piece calls that period the time the price was highest and stops there.
The twelve month return the screen shows
The screen reports 39.17 percent over twelve months. Its one, three and six month figures each land exactly on a real session close in my own daily series, which is a good sign for the rest of the screen. The twelve month figure does not: it implies a starting price of KRW 50,800, while the close twelve months before September 4, 2026 was KRW 53,100, which would give 33.15 percent. I do not know which window the screen used, so I left the figure out of the argument.
Ten Things That Would Break This Reading
I have grouped these by what it would take to settle them, because that turns out to matter more than how serious each one sounds.
A filing would settle these four.
- The third quarter report, legally due November 15, 2026 and therefore landing Monday November 16, 2026, could show revenue and operating profit that make the current multiple look low instead of fair.
- The company signed a contract in July 2026 running to the end of 2033 whose value was withheld from disclosure. Korean press reported only that it exceeds ten percent of the prior year’s revenue. If that number appears in a filing and is large, the forward picture changes and the revenue year I have used becomes the wrong one.
- Half year operating profit was negative by KRW 0.64 billion, but the second quarter alone was positive by KRW 1.37 billion. A second positive quarter would make fiscal 2025 look like a floor instead of a spike.
- The 2023 equity increase I could not read may have terms that dilute, or may not. Either answer moves my per-share thinking, which is currently absent.
A move in the market would settle these three.
- A multiple can be low because a business is disliked for good reasons that have not reached the income statement yet. Three point seven times revenue is not evidence of anything on its own.
- The three American peers could rerate downward, which would erase the ordering I found interesting without this company changing at all.
- Korean sell-side coverage of this name has thinned to a single house on the screen I read. Thin coverage cuts both ways, and a new initiation at either end would move the price before it moved the business.
Nothing I can name would settle these three.
- The high and low line on my screen carries a label that does not match its own contents. It is described as a 250 session range built from adjusted closing prices, and I took that at face value for longer than I should have. When I pulled 270 days of daily bars myself, the stated high of KRW 224,000 turned out to be an intraday print from February 3, 2026 and never a close, and the stated low of KRW 45,650 was an intraday print from November 26, 2025. The derived percentages built on top of them are arithmetically correct to the first decimal, so nothing downstream is wrong. What is wrong is the name. I now recompute the closing high and low myself for any company where that range carries part of an argument, and in this piece it carries most of one.
- My peer rule excluded the diversified primes on the grounds that their satellite work is too small a share of the whole. That is a judgment call, and a different rule would produce a different table.
- I cannot see this company’s order backlog as of today. The most recent total I found was reported in 2024, and a manufacturer’s backlog is the single number I would most want before forming a view.

Where I Stand on Satrec Initiative Stock and What Would Prove Me Wrong
The stance
Watching, with no position. A market value near USD 573 million sits below the size at which I take positions, so the first filter stops me before valuation is even reached. What holds my attention past that filter is the ordering in the peer table together with how the price history ran: a business whose published record moved in one direction while its price moved 4.515 times in both.
My reading is that the swing was mostly a repricing of expectations and hardly at all a repricing of results. If that reading is right, then the multiple today is a statement about how much the market currently expects, and I would want the order book before I formed a view on whether that expectation is too low. I do not have the order book. That is the honest position.
Condition one
If the third quarter report landing Monday, November 16, 2026 shows nine month revenue above KRW 160 billion, I am wrong about which year belongs under these multiples. That would put the company on course to pass fiscal 2025 revenue with a quarter still to run, and the multiple I have used throughout would be measuring a year the business had already left behind. Nine month revenue in 2025 was KRW 134.96 billion, so the threshold is 18.6 percent above it by my calculation. The company has cleared an 18 percent nine month increase before, in 2024, so this can fire without anything extraordinary happening, and it has not fired in the most recent year, so it is not automatic either.
Condition two
If the annual report filed in March 2027 shows fiscal 2026 operating profit above KRW 15 billion, I am wrong to treat fiscal 2025 as a first crossing instead of a trend. That is 1.47 times the KRW 10.18 billion of fiscal 2025, and with the first half at negative KRW 0.64 billion it requires more than KRW 15.6 billion in the second half alone. I checked that threshold against every second half in my data: negative 7.57, negative 3.58, positive 1.99 and positive 6.41 billion won for 2022 through 2025. The best second half this company has posted is 6.41 billion, so the threshold is 2.44 times that. Repeating a good year does not get there, and no law of the business prevents it.
A third outcome I have never written down before
Both conditions expire with the March 2027 annual report. Until now I have recorded expiry two ways: the condition fired, or it did not. There is a third case I have been letting fall through, and it is the one that flatters me most. The condition fires, I see it fire, and I do nothing. I do not revisit the piece, I do not move the stance, or I simply never go back to look.
That outcome is identical in effect to having set no condition at all, and it leaves no trace, because a page that is never revised looks the same as a page that was right. So I am making room for it in advance. At expiry I will record which of three things happened: it did not fire, it fired and I changed my position, or it fired and I did not move. The third line has to exist before I need it, or it will not get written.
For a case where the forward number itself was the whole question, I keep a piece on a company whose published estimates required the second half to nearly double. And for a low multiple that turned out to be arithmetic and never an opportunity, two cheap multiples that resolved into one return figure is the closest thing I have written to a warning against this piece.
Prices and multiples reflect the September 4, 2026 close as checked at the time of writing. Korean won is the reference currency here; dollar conversions are approximate, at roughly KRW 1,350 per dollar on that date. Financial figures come from audited Korean regulatory filings, the most recent being the half year report accepted August 13, 2026. Figures credited to Korean press and to a Korean broker screen are marked where they appear, and I translated or read them out of Korean language material myself; none of them is an English original.
Sources: Edaily, July 24, 2026, on the undisclosed contract value · WiseReport company screen, September 3, 2026 · NBN Media on the 2024 KRW 172.7 billion award · Planet Labs key figures · BlackSky Technology key figures · Satellogic key figures · Money Today on the September 4, 2026 won close