
HD Construction Equipment Stock and the July 29 Arithmetic
On July 29, 2026, HD Construction Equipment stock closed at KRW 118,300, down 3.66% from KRW 122,800 the session before. That same morning the company reported second-quarter operating profit of KRW 248.9 billion (USD 184.3 million) and the wire copy carried a growth rate of 522.3%. The company’s own presentation carried a different growth rate for the identical profit figure: 91.9%. Neither one is wrong. I spent an hour with a calculator on the gap between them, and the gap turned out to contain a whole company.
What I was given
1. Second-quarter 2026 operating profit KRW 248.88 billion and revenue KRW 2,434.17 billion, from the half-year filing (receipt 20260814004300).
2. Legal-entity growth: operating profit +522.3%, revenue +151.5% (Korean press table, July 29, 2026).
3. Combined-basis growth: operating profit +91.9%, revenue +18.2% (company statement, same day).
What I solved for
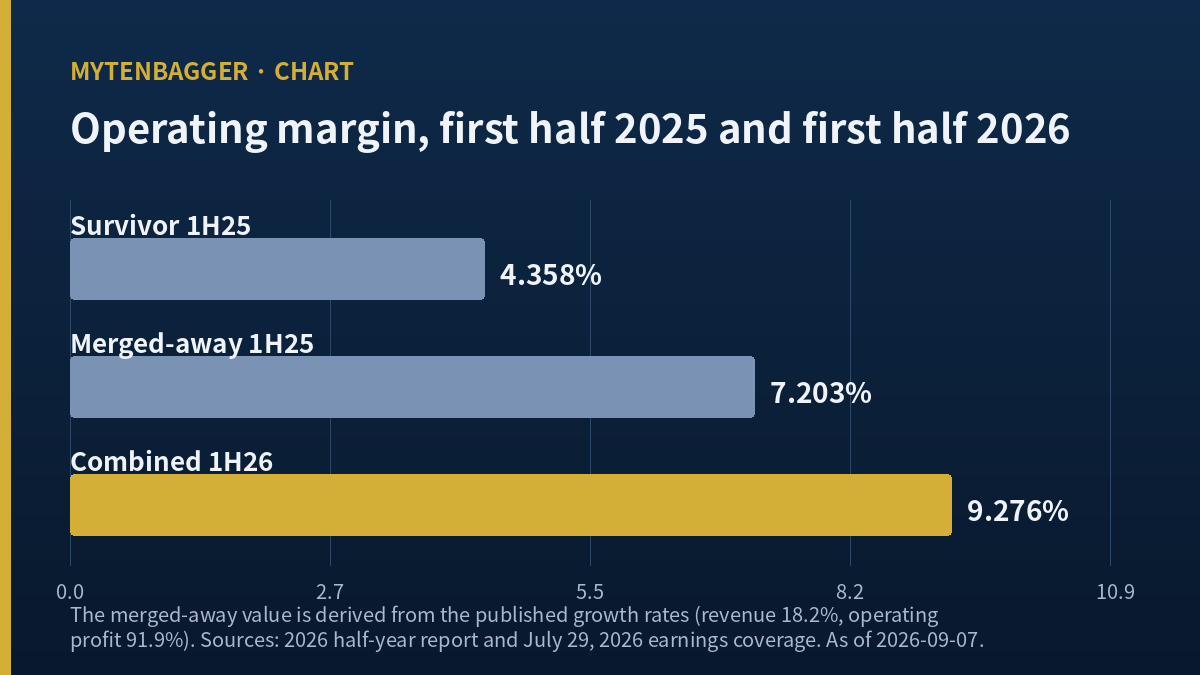
First-half 2025 for HD Hyundai Infracore, the company merged out of existence: revenue KRW 2,072.5 billion (USD 1.535 billion), operating profit KRW 149.3 billion (USD 110.5 million), operating margin 7.203%. The legal survivor posted 4.358% over the same half. A ratio of 1.653.
How I checked it
The two rebuilt companies add to KRW 3,947.1 billion of first-half 2025 revenue. Korean press reporting a credit rating agency commentary on July 6, 2025 put the simple combined annual revenue at KRW 7.5 trillion. The order of magnitude holds.
I do not own this. There is no order sitting on it. What follows is a method note for reading the first year after a merger, written down once so that I do not have to re-derive it every quarter.
Contents
What HD Construction Equipment stock was told on July 29
Start with the filed numbers. Second-quarter 2026 standalone revenue was KRW 2,434.17 billion (USD 1.803 billion), operating profit KRW 248.88 billion (USD 184.3 million), and net profit KRW 180.70 billion (USD 133.8 million). The quarterly operating margin was 10.22%. For the first half the cumulative figures were revenue KRW 4,739.04 billion (USD 3.509 billion), operating profit KRW 439.58 billion (USD 325.5 million) and net profit KRW 354.57 billion (USD 262.6 million), for a margin of 9.28%.
None of that is in dispute. The growth rates are where it gets interesting. The Korean business daily Ajunews ran a results table on July 29, 2026 that set the year-ago quarter at revenue KRW 967.7 billion, operating profit KRW 40.0 billion and net profit KRW 0.6 billion, producing 151.5%, 522.3% and 30,016.7%. Those year-ago figures match what I pulled from the regulatory filing to the won: revenue KRW 967.71 billion, operating profit KRW 40.04 billion, net profit KRW 0.62 billion.
The company’s own commentary, quoted the same day, used a combined basis and reported 18.2% revenue growth with 91.9% operating profit growth. Divide 522.3 by 91.9 and you get 5.68. The net profit line is worse: using the filed KRW 0.62 billion as my base I recompute 28,997.4% where the press printed 30,016.7%, and the difference of over a thousand percentage points comes entirely from rounding the base to KRW 0.6 billion. When a base is that small, rounding is not a detail.
Numbers built that way tell you a direction and refuse to tell you a size. That is where I stopped and started over.
The counterargument to owning HD Construction Equipment stock
I want the case against on the page before the reconstruction, because the reconstruction is the flattering part and I do not want it read first.
The company’s own target sits under its own first half
Management guided to 2026 revenue of KRW 8.7 trillion to 9.0 trillion with an operating margin of 5% to 7%, which brackets operating profit at KRW 435 billion to 630 billion. First-half operating profit alone was KRW 439.58 billion, or 101.1% of the low end of the full-year range. Revenue progress was 54.5% of the low end. Read plainly, the company is budgeting for a weaker second half than the one it just delivered.
Named brokers are far apart, and the screen is further
KB Securities analyst Dong-ik Jung raised his valuation on the shares to KRW 245,000 on April 27, 2026. Shinhan Securities analyst Ji-han Lee carried KRW 190,000 on July 10, 2026, cutting 17.4% from a prior KRW 230,000. The Hankyung consensus screen dated September 4, 2026 shows KRW 141,667. I am not averaging those. I cannot establish which of them reflects the most recent revisions, and a mean of three numbers whose vintages I cannot date is a made-up number.
North America is the shrinking leg
The company sees North American demand down 2.5% at 116,000 units and has shelved a planned price increase. In the second quarter, North America grew 7.0% while the Middle East and Africa grew 51.4%, Latin America 29.9% and Europe 26.2%. The weakest region is also the one where tariffs sit.
My reconstruction rests on an assumption I could not verify
I could not find a document stating that the combined basis is a simple sum of the two income statements. If intercompany sales were eliminated, or accounting policies were harmonized retroactively, the piece I subtract is smaller than I calculate. That pushes my answer toward optimism, so my 7.203% should be read as a ceiling.
The margin gap may be product mix, and probably is
Second-quarter engine revenue was KRW 386.1 billion at a 15.3% operating margin against 9.9% in construction equipment. The engine business came from the Infracore side. So the 7.203% I reconstruct is better described as owning a higher-margin product line than as running the business better. I think that reading is the more likely one, and it takes most of the drama out of my own finding.
The market sold the print
Shares fell 3.66% on July 29, 2026 and a further 3.47% on July 30, 2026, a two-session decline of 7.00%. That was the reaction to the day the 522.3% headline ran.
Two growth rates looking at two different pasts
The two figures differ for a simple reason. The numerator is identical and the comparison base is not.
HD Hyundai Construction Equipment and HD Hyundai Infracore had their merger approved at shareholder meetings on September 16, 2025, with 99.91% and 99.24% in favor according to Korean industry press. The merger took effect in January 2026, new shares were scheduled to list on January 26, 2026, and the exchange ratio was 0.1621707 HD Hyundai Construction Equipment common shares for each HD Hyundai Infracore common share. The surviving entity was HD Hyundai Construction Equipment, renamed HD Construction Equipment.
The accounting record that legally continues belongs to the survivor. So the second quarter of 2025 that the half-year filing compares against is a quarter earned by a company with KRW 967.7 billion of revenue and no Infracore in it. Set the KRW 2,434.17 billion of the 2026 quarter beside that and you get 151.5%. The figure is arithmetically correct, and it does not mean the business grew one and a half times over. It means two companies became one.
The combined basis assumes the two were already one throughout 2025. On that assumption second-quarter revenue growth is 18.2% and operating profit growth is 91.9%. KB Securities used the same convention in its first-quarter note, writing revenue of KRW 2,304.9 billion at 22.1% growth and operating profit of KRW 190.7 billion at 88.3% growth. The legal-entity growth rates I compute for that same quarter from the filing are 154.2% and 357.9%. So 22.1% and 154.2% describe the same three months.
Both conventions earn their place. The legal basis answers what the shares I could have held actually earned. The combined basis answers whether the industrial asset improved. The third question is the one that interested me: the difference between the two bases is exactly the company that vanished.
Solving the pair for a company that no longer files
HD Hyundai Infracore does not publish results any more. But a published combined growth rate carries the vanished company’s 2025 figures inside its base, so the base can be recovered by division.
Two divisions and two subtractions
Divide second-quarter 2026 revenue of KRW 2,434.17 billion by 1.182 and the combined 2025 base is KRW 2,059.37 billion. Subtract the KRW 967.71 billion the survivor actually filed and KRW 1,091.66 billion remains. Do the same on profit: KRW 248.88 billion divided by 1.919 gives KRW 129.70 billion, less the filed KRW 40.04 billion leaves KRW 89.65 billion.
The first quarter follows the same steps. Revenue of KRW 2,304.87 billion divided by 1.221 gives KRW 1,887.69 billion, less KRW 906.84 billion leaves KRW 980.85 billion. Operating profit of KRW 190.70 billion divided by 1.883 gives KRW 101.27 billion, less KRW 41.65 billion leaves KRW 59.62 billion.
| First half 2025 | Revenue (KRW bn) | Operating profit (KRW bn) | Operating margin |
|---|---|---|---|
| Surviving entity, as filed | 1,874.55 | 81.69 | 4.358% |
| Merged-away entity, my reconstruction | 2,072.51 | 149.27 | 7.203% |
| Sum, the combined-basis comparison | 3,947.05 | 230.97 | 5.852% |
| For reference, first half 2026 as filed | 4,739.04 | 439.58 | 9.276% |
What the company that disappeared actually earned
The survivor earned 4.358% and the company folded into it earned 7.203%. On revenue the vanished side was also the bigger one, KRW 2,072.51 billion against KRW 1,874.55 billion. I had walked into this expecting the reverse. The entity that kept the listing code and gave its name to the combined company was, on the first-half 2025 record, the less profitable and slightly smaller half.
That reverses one of my working assumptions. I had been ready to read the 9.28% first-half 2026 margin as operating leverage from a bigger revenue base spreading fixed costs. But the weighted starting point was already 5.852% before anything merged. Of the 3.42 percentage points between 5.852% and 9.276%, this arithmetic cannot tell me how much is integration and how much is a cyclical upswing in global machinery demand. What it does settle is that the correct starting line reads 5.852% where I had been using 4.358%, and a good deal of the improvement story disappears once the line moves.
Checking the HD Construction Equipment stock arithmetic against a number I did not use
An answer built out of rounded inputs has to survive two tests before I will print it.
Shaking the rounding
I treated the published 18.2% as anything between 18.15% and 18.25%, and 91.9% as anything between 91.85% and 91.95%, then computed all four corners. The second-quarter margin for the merged-away entity moved between 8.209% and 8.216%. Even if the company meant 92.0% where it printed 91.9%, the answer is 8.206%. The first decimal place does not move, and the half-year figure of 7.203% stays inside 7.2% for the same reason.
Reaching for an outside number
A calculation that only closes against itself has proved nothing, so I went looking for a figure that played no part in it. Korean press reporting the NICE Credit Rating commentary on July 6, 2025 put the simple combined revenue of the merged company at KRW 7.5 trillion. My reconstructed first-half 2025 pair sums to KRW 3,947.05 billion, which annualizes near KRW 7.9 trillion if the second half resembled the first. The rating agency figure is a prior-year-end number and mine is a first-half number, so the two are six months apart. Order of magnitude and direction are all this check can honestly claim.
A second check ran cleaner. A Korean industry outlet reported the survivor’s third-quarter 2025 results as revenue of KRW 954.7 billion and operating profit of KRW 55.8 billion. The standalone quarter I derive by subtracting cumulative filings is KRW 954.71 billion and KRW 55.81 billion. My method for extracting single quarters from cumulative Korean filings agrees with outside reporting to the tenth of a billion won.
Global peers, and a column I had to build myself
Two listed comparisons matter here. Caterpillar sells the same categories of machine into the same North American market whose demand this company expects to shrink, and Komatsu is the Asian manufacturer whose product overlap is closest. I deliberately built a table of ratios only, with no currency column, because converting three currencies into one at a single rate would import an exchange-rate assumption into a comparison that does not need one.
The column I added this time is book value per point of return on equity, which is simply price-to-book divided by return on equity. It asks how much book multiple the market is paying for each percentage point of profitability, and it separates a cheap-looking book multiple from a genuinely cheap one.
| Company | Operating margin | Return on equity | Price to book | P/B per ROE point |
|---|---|---|---|---|
| HD Construction Equipment, first half 2026, my calculation | 9.28% | 14.47% | 1.35 | 0.093 |
| HD Construction Equipment, vendor screen on FY2025 | 4.53% | 5.70% | 1.35 | 0.237 |
| Caterpillar, September 6, 2026 screen | 18.65% | 56.97% | 19.29 | 0.339 |
| Komatsu, September 2, 2026 screen | 13.63% | 11.62% | 1.78 | 0.153 |
The price-to-book figure is the same vendor number in both of my own rows, because I recomputed profitability and left the book multiple alone. I verified both peer screens by reconstruction. Caterpillar at USD 813.94 times 459.67 million shares gives USD 374.14 billion against a printed USD 374.15 billion, a drift of 0.002%, and USD 813.94 over trailing earnings per share of USD 23.21 returns the printed 35.08 price-to-earnings. Komatsu at JPY 7,400.00 times 891.51 million shares gives JPY 6.597 trillion against a printed JPY 6.60 trillion, and JPY 7,400.00 over JPY 422.04 returns the printed 17.53. The two screens carry different update stamps, September 6 and September 2, 2026, and I printed both in the table because a four-day spread on a fast-moving price is worth showing.
The last column reads against my instinct. On the vendor screen this Korean name looks like the cheap one at 1.35 times book while Caterpillar trades at 19.29 times. Per point of return on equity, Caterpillar is the expensive one at 0.339 and Komatsu is the cheap one at 0.153, with the Korean name landing between them on screen figures and below both on my own recomputed profitability. A low book multiple attached to a low return is not a discount. It is a price.
What I could not use from the HD Construction Equipment stock screen
My data screen carries plenty of figures for this company, and I left most of them out. Why each one was dropped belongs in the article, because a reader cannot audit a decision kept in a private working file.
The price-to-earnings ratio reads 24.94. Dividing the KRW 6,709.1 billion market value by 24.94 implies earnings of KRW 269.01 billion. That is not the FY2025 consolidated net profit of KRW 87.03 billion, nor the FY2025 profit attributable to owners of KRW 99.38 billion, nor the sum of the four most recent quarters at KRW 415.33 billion. I could not identify the earnings figure sitting under that ratio, so I did not build any argument on it.
Book value per share reads KRW 104,012. Multiplied by the share count that implies equity of KRW 4,984.48 billion, which is neither the June 30, 2026 equity attributable to owners of KRW 4,896.64 billion nor the consolidated total of KRW 5,033.65 billion. I therefore quote price-to-book only as a range between 1.33 and 1.37.
The screen’s 250-day high of KRW 217,500 and low of KRW 85,000 are both intraday prints. Counting daily closes myself, the highest close was KRW 198,100 on April 27, 2026 and the lowest was KRW 85,200 on September 1, 2025. The drawdown from the high is 29.33% on closes where the screen shows 35.6%, and 6.27 percentage points hang on that one definitional choice. Dividend payout reads 9.8% on one field and 61.9% on the raw field, and I could reproduce neither, so both are absent above.
The revenue, operating profit and net profit fields on the screen, at KRW 3,776.5 billion, KRW 170.9 billion and KRW 87.0 billion, are exactly the FY2025 annual figures, which is to say they belong to the pre-merger company. The market value of KRW 6,709.1 billion is computed on the post-merger count of 47,922,143 shares, and KRW 140,000 times that count returns KRW 6,709.1 billion with zero difference. The top and bottom of those screen ratios are looking at different dates, which is why I recomputed what I needed instead of quoting them.
One field did reproduce. The screen’s 5.7% return on equity matches FY2025 profit attributable to owners of KRW 99.38 billion over the KRW 1,731.52 billion average of 2024 and 2025 owners’ equity, which returns 5.74%. Take first-half 2026 owner profit of KRW 354.37 billion, double it, and divide by June-end owners’ equity, and the same company returns 14.47%. Both numbers are called return on equity.
Where HD Construction Equipment stock leaves me
Not owned, no order, watching. The KRW 6,709.1 billion market value (USD 4.968 billion) is not the reason. The reason is that everything I built above stands on three assumptions, and I know something different about each of them.
Assumption one. The combined basis is a plain sum of two income statements. If it breaks, my reconstructed figure gets smaller, because eliminating intercompany revenue subtracts from a sum. So 7.203% is a ceiling and never a midpoint. The comparative note in the third-quarter report due after November 16, 2026 can settle this.
Assumption two. The published growth rates round within one hundredth of a point. If it breaks, nothing moves. I computed all four corners and the answer never left 8.2% for the quarter. This assumption is already closed.
Assumption three. The two companies used the same accounting policies before merging. If it breaks, I do not know which way the answer moves. There is one assumption here whose failure direction I cannot even sign, and that is the honest limit of this piece. I did not verify it, and that sentence belongs above the number, ahead of it on the page.
So the next observation point is the third-quarter report due after November 16, 2026, and the thing to read there is not the margin but the comparative-basis note. If it confirms a plain sum, the second row of my table stops being an estimate. If it does not, I retire the calculation. In the first year after a merger, telling a number that got better apart from a number that got bigger comes before deciding anything about the shares.
Two earlier entries sit at the same kind of stop. In my Doosan Bobcat entry a quarterly profit jump broke into currency, dollars and a tariff refund, and the dollar-basis result went the other way once the refund came out. In my Hyein entry a company cleared all seven of my screens while its price-to-earnings and price-to-book ratios stood on two different share counts. Both times the figures were accurate and the question was what they were measuring.
Access note for readers outside Korea. This is a KOSPI listing, the senior board of the Korea Exchange, as distinct from KOSDAQ, the junior board where smaller and earlier-stage Korean companies list. I have not confirmed whether an American depositary receipt exists for it.
Price basis is the September 4, 2026 close of KRW 140,000, converted at 1,350.4 KRW per USD, the September 4, 2026 (2026-09-04) Seoul close. Financial data comes from the Korean regulatory filings receipt 20260814004300 and receipt 20260602000456, and screen indicators are dated September 4, 2026.
Sources: Ajunews second-quarter results table / ZDNet Korea on the first double-digit margin / Newspim summary of the Shinhan Securities note / KB Securities note summary / Herald Business on the ratings outlook / Industry News on the merger vote / Bloter on the merger terms / Hankyung consensus screen / Caterpillar statistics / Komatsu statistics