BH Co Stock: Operating Profit Now Barely Covers Interest
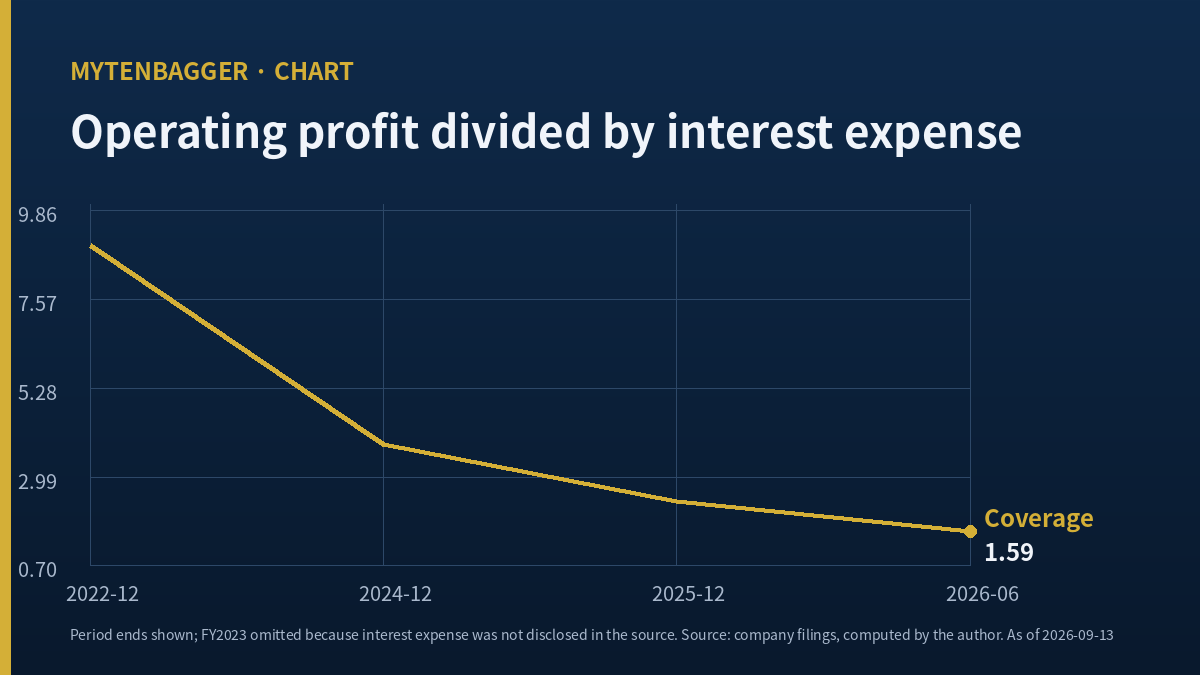
I own no BH Co stock and I have no order working. What pulled me back to this Korean flexible-circuit maker (KOSPI: 090460) was a single division I ran four times on four sets of filings, each time getting a smaller answer. Operating profit divided by interest expense: 8.97 for full-year 2022, 3.84 for 2024, 2.37 for 2025, and 1.59 for the six months ended June 30, 2026. Each of those quotients is mine, computed from figures the company reported to Korea’s regulatory filing system.
That last number is what I want to sit with. For every 100 won of operating profit the company booked in the first half of this year, roughly 63 won went to interest. I am not calling that distress. I am saying it is a different company from the one that earned nearly nine times its interest bill four years ago, and the share price does not obviously know which of the two it is pricing.
Contents
BH Co stock in four rows
| What I checked | What I found |
|---|---|
| Operating profit against interest expense, four periods | 8.97 (FY2022), 3.84 (FY2024), 2.37 (FY2025), 1.59 (H1 2026). All four divisions are mine. |
| Free cash flow, first half of 2026 | KRW 9,977 million, from KRW 64,919 million of operating cash flow less KRW 54,942 million of capital spending. |
| Operating margin over the trailing four quarters | 4.41 percent, from KRW 1,856,295 million of revenue and KRW 81,852 million of operating profit that I summed myself. |
| My position | None. Watching. The stock closed at KRW 21,400 on Monday, September 7, 2026, for a market value of about KRW 721.4 billion, or roughly USD 538 million at that day’s rate. |
Why I keep recalculating one ratio on BH Co stock
Korean disclosure gives me operating profit and interest expense as separate reported lines in the same filing, which means the ratio is a division I can do without trusting anyone’s summary. I did it four times because I wanted to know whether the direction was a wobble or a slope.
It is a slope. Here is the arithmetic laid out so it can be redone.
| Period | Operating profit (KRW mn) | Interest expense (KRW mn) | Quotient (my calculation) |
|---|---|---|---|
| FY2022 | 131,267 | 14,634 | 8.97 |
| FY2023 | 84,792 | not disclosed in my source | could not compute |
| FY2024 | 87,053 | 22,678 | 3.84 |
| FY2025 | 53,978 | 22,756 | 2.37 |
| H1 2026 | 18,547 | 11,699 | 1.59 |
Source: the company’s annual and semi-annual regulatory filings in Korea, most recently the half-year report accepted on August 14, 2026 (receipt number 20260814000697). Amounts are Korean won on a consolidated basis. The 2023 line has an interest figure missing from my source, so I left the cell empty and did no estimate.
Two things are worth separating. The interest bill itself is not what moved most. It went from KRW 14,634 million in 2022 to KRW 22,678 million in 2024 and KRW 22,756 million in 2025, and the first half of 2026 carried KRW 11,699 million, which annualizes close to the same place. What collapsed was the numerator. Operating profit fell from KRW 131,267 million to KRW 53,978 million across those same years, and the first six months of this year produced KRW 18,547 million.
So the ratio deteriorated mostly because the company stopped earning as much, and the debt sat there being what it always was. That distinction matters to me because a fix on the debt side is something management can execute. A fix on the profit side depends on customers.
Where the cash went in the first half
Operating cash flow for the six months came to KRW 64,919 million. Capital spending took KRW 54,942 million of it, leaving KRW 9,977 million of free cash flow. That is a thin remainder on a KRW 721.4 billion market value.
The two quarters inside that half look nothing alike. The first quarter produced negative free cash flow of KRW 15,895 million, with KRW 18,499 million of operating cash flow against KRW 34,394 million of capital spending. The second quarter reversed it: KRW 46,420 million in, KRW 20,548 million out, leaving KRW 25,872 million by my subtraction. A company spending at that clip while its operating profit halves is either building for something specific or is committed to spending it cannot easily throttle, and I cannot tell which from the cash flow statement alone.
Total liabilities stood at KRW 606,880 million on June 30, 2026, against total assets of KRW 1,457,781 million, which leaves KRW 850,901 million of equity and a reported debt-to-equity figure of 71.32 percent. That is not an alarming balance sheet in isolation. Read next to a 1.59 quotient, it is a balance sheet whose cost is currently eating most of what the operations produce.
The comparison that runs against me
Before going further I have to print the comparison that damages this piece most, because I found it while checking my own table and it points the other way.
The 1.59 covers January through June 2026. The same division for January through June 2025 produces no number at all, because operating profit for that half was negative: the company reported an operating loss of KRW 9,327 million against KRW 14,935 million of interest expense. Measured first half against first half, coverage moved from undefined and negative to a positive 1.59.
The seasonality underneath that is real and it repeats. In 2025 the first six months produced an operating loss of KRW 9,327 million and the last six months produced KRW 63,305 million of operating profit, by my subtraction from the annual figure. In 2024 the same split was KRW 39,761 million and KRW 47,292 million. Volume from the largest customer lands in the back half of the year, so a coverage ratio built on the front half is built on the company’s two weakest quarters by design.
My slope is therefore an annual slope with a half-year point stapled to the end of it, and those two things are not measured the same way. I left the half-year row in the table in bold anyway, because it is the most recent thing I know. A reader who wants to argue that 1.59 is a seasonal artifact has the arithmetic above, and I think that reader has a case.
BH Co stock against three flexible-circuit peers
I wanted to put the coverage ratio in a peer table and could not. None of the three overseas companies below publishes an interest expense line on the source I used for them, and the Korean company does so only in its home filings. So the table became a margin table, and the column that carries my argument is missing from it. That absence is the honest result, and I am printing it. Substituting a column that merely looks comparable would have been the easier move and the dishonest one.
| Company | Revenue (trailing twelve months) | Operating income | Operating margin (calculated by me) | Source and period |
|---|---|---|---|---|
| BH Co (KOSPI: 090460) | KRW 1,856,295 mn | KRW 81,852 mn | 4.41% | Four quarterly Korean filings, summed by me, through June 30, 2026 |
| Zhen Ding Technology (TPE: 4958) | TWD 183,168 mn | TWD 15,379 mn | 8.40% | stockanalysis.com, trailing twelve months to March 31, 2026 |
| Flexium Interconnect (TPE: 6269) | TWD 22,646 mn | TWD (3,460) mn | (15.28%) | stockanalysis.com, same basis |
| Career Technology (TPE: 6153) | TWD 5,349 mn | TWD (1,940) mn | (36.27%) | stockanalysis.com, same basis |
I converted no currencies here and I make no claim about which of these four companies is larger. Three rows are Taiwan dollars and one is Korean won, and the Korean row also runs three months later than the others. The margins are each a single division of the two cells to their left.
What the table does say is that two of the three overseas flexible-circuit specialists are losing money at the operating line, and the Korean company is not. Read that way, a 4.41 percent margin is neither impressive nor the worst outcome available in this business right now. It is a company still profitable in a segment where profitability has become optional.
The two companies I wanted in the table and left out
Compeq Manufacturing (TPE: 2313) would have been a fifth row. My source displayed an operating margin for it but not an operating income line, so putting it in would have meant back-solving the number and printing my own arithmetic in a column where every other row is a reported figure. I would rather have four consistent rows. The source did show trailing revenue of TWD 78,814 million and an operating margin of 10.93 percent for that company, and I am recording both figures here so a reader who wants the fifth row can construct it and see exactly what I chose not to print.
Nippon Mektron, the other large maker of flexible circuits in the Apple supply chain, sits inside a Japanese parent and does not publish standalone results I can reach. Its absence is the more damaging one, because it is the peer that would have told me most. Among Korean suppliers selling into the same customer I have looked at LG Innotek separately, though it sells a different part and is not a read-across for flexible circuits.
What the sell side has put on BH Co stock
Five Korean houses have published on this name in 2026 and they do not agree with each other by a factor of more than two.
Daishin Securities analyst Park Kang-ho put 52,000 won on the stock in a June 16, 2026 note and projected third-quarter revenue of KRW 668.4 billion with operating profit of KRW 61.3 billion, describing it as a record quarter driven by large-area circuit supply for a foldable phone (reported by Korean press). Kiwoom Securities analyst Oh Hyun-jin has held 24,000 won since February 4, 2026 and reaffirmed it on August 4, calling the current level cheap even allowing for what the core business faces (Korean press summary). Meritz Securities analyst Yang Seung-soo cut to 26,000 won on August 5 and modeled third-quarter revenue of KRW 535.6 billion with operating profit of KRW 34.7 billion (Korean press summary). Eugene Investment analyst Lee Joo-hyung raised to 27,000 won from 23,000 won on April 10, with 2026 revenue of KRW 1,983 billion and operating profit of KRW 114 billion. Samsung Securities published a May 6 note by Lee Jong-wook and Kim Kyung-bin carrying no rating and no valuation, which I read in the original.
The gap I care about is not the valuation spread. It is that Daishin’s third-quarter operating profit figure is 1.77 times Meritz’s, for the same quarter of the same company, from notes written seven weeks apart. When two houses that both cover a name are that far apart on a quarter that has already begun, the disagreement is about something structural, and my coverage ratio sits directly on top of whichever of them turns out to be closer.
One more data point on how these estimates have been landing. The second quarter came in 41.11 percent below the KRW 13.4 billion consensus operating profit figure Meritz cited, by my own division; the house wrote 40.9 percent, which is the same miss with different rounding. Daishin’s own second-quarter operating profit estimate had been KRW 15.1 billion, so the actual result was 52.26 percent of what that note projected, even though the same note’s revenue estimate came within a third of a percent.
Numbers I left out of the BH Co stock case
Inventory, which pointed the wrong way for a tidy story
Inventory stood at KRW 198,311 million on June 30, 2026, which works out to roughly 43.6 days against the quarter’s revenue. I looked at it hoping it would corroborate a squeeze and it does not clearly do so; the same measure was 53.5 days three months earlier and 33.2 days at the end of 2025. It moves around too much across quarters for me to lean on, so it stays out.
A three-year revenue growth figure that says almost nothing
The data vendor reports compound annual revenue growth of 2.17 percent from 2022 to 2025. Revenue in this business is set by how many units a handful of customers order, and a three-year average of that is a number with no decision attached to it. I mention it only so nobody thinks I looked away from it.
Reaching BH Co stock from a US brokerage account
There is no American depositary receipt for this company, so a US-based reader who wants exposure has two realistic options and neither is clean. The first is direct Korean market access, which a small number of US brokers support and which brings won settlement, Korean withholding on dividends, and a trading day that runs while most of North America is asleep. I have not confirmed whether either fund holds it at all.
That second route deserves a caution specific to this piece. The whole argument here is about a ratio unique to this company’s income statement. Owning it through an index fund gives a reader the country without the ratio, which is a reasonable thing to want, though it is not what this piece is about.
Thirteen things that would break my reading
- The 1.59 covers six months. Half-year figures in this business skew toward the weaker half, because volume from the largest customer concentrates in the second half. A full-year 2026 number could land well above it.
- I do not know with certainty which account the vendor divides by. See the section below; this is the largest single hole in the piece.
- The FY2023 interest figure is missing from my source, so my slope has a gap in the middle of it and I am connecting 2022 to 2024 across empty space.
- Interest expense that stays flat while operating profit halves is a story about profit, and the profit story may be temporary. Meritz put part of the second-quarter weakness down to a one-time cost from relocating a Vietnamese production line. One-time costs do not repeat.
- Capital spending of KRW 54,942 million in six months is the behavior of a company that expects more volume. It is not the behavior of one bracing for less. Management is betting against my reading with its own cash.
- Kiwoom’s August 4 note explicitly calls the current price cheap even after accounting for the core business risks, and that house has held the same number since February while the stock moved a long way in both directions.
- Daishin’s third-quarter operating profit projection, if it lands anywhere near KRW 61.3 billion, would by itself push the full-year quotient far above 1.59 and make this whole framing look like a half-year artifact.
- The Korean market fell about 22 percent in July 2026. Any price-based observation I make about this stock in that window is contaminated by that.
- My peer table is missing the column that carries my argument, and two of the three peers I could get are loss-making, which makes the comparison group unflattering in a way that quietly helps my subject.
- Three of the four peer rows are stamped three months earlier than the Korean row, and the price page on that source was dated July 16, 2026 when I read it in September.
- A rising interest bill would be a different and more worrying story than the one I found. The bill is roughly flat. I chose to write about a ratio whose movement is mostly in the other term, and a reader could fairly say the ratio was the wrong lens.
- I have not seen segment-level profitability. The circuit business and the automotive electronics business may have very different margins, and a consolidated operating profit line hides that completely.
- Nippon Mektron’s absence from my table is not neutral. It is the closest comparable in the world for this company, and I built a peer set without it.
An admission about the bottom half of my ratio
Here is the thing I should have checked first and checked last. The data vendor whose screen I used to sanity-check my own arithmetic returns a coverage figure of 1.59 for the same period, which matched my calculation to two decimals and made me comfortable. Then I read the vendor’s own field note, which says the account it divides by is pure interest expense where a company reports one, and total finance costs where it does not, and that total finance costs sweep in derivative losses, foreign exchange losses, and receivable discounting charges.
The vendor’s note lists specific Korean companies whose ratios came out artificially low for exactly that reason. It does not say which treatment applies here, and the field that would tell me reads “unknown.”
So the number I built this piece on may be measuring more than interest. If this company’s filing reports total finance costs where a pure interest line would have gone, then some part of the KRW 11,699 million is currency movement and derivative marks, and the true interest coverage is better than 1.59, possibly materially. I could not resolve this. What I can say is that the direction of the slope survives either way, because the same treatment would have applied in 2022 when the quotient was 8.97.
The uncomfortable part is the order in which I did this. I ran the arithmetic, liked the story, wrote most of this piece, and only then opened the field note explaining what I had divided by. When I covered another Korean circuit-board maker in August I had the same field note available and did not read it either. A ratio that holds up after you check it and a ratio you checked before believing it are not the same object, even when the digits match.
What would make me stop watching and start deciding. The third-quarter report is due on or after Monday, November 16, 2026. If nine-month operating profit divided by nine-month interest expense comes in above 3.0, the slope broke and I was reading a trough. If it comes in below 1.5 while capital spending stays near the first-half pace, the company is building through a squeeze and I want to see the next quarter before doing anything at all. Between those two, I have learned nothing and will say so.
Prices and multiples reflect the Monday, September 7, 2026 close as checked at the time of writing. Financial figures come from the company’s consolidated Korean regulatory filings, most recently the half-year report accepted August 14, 2026. Korean won is the reference currency throughout; for readers converting, the Seoul market closed that day at about 1,340.5 won per US dollar, and any conversion from that rate is approximate.