POSCO International Stock: Eight Years of Dividend Raises
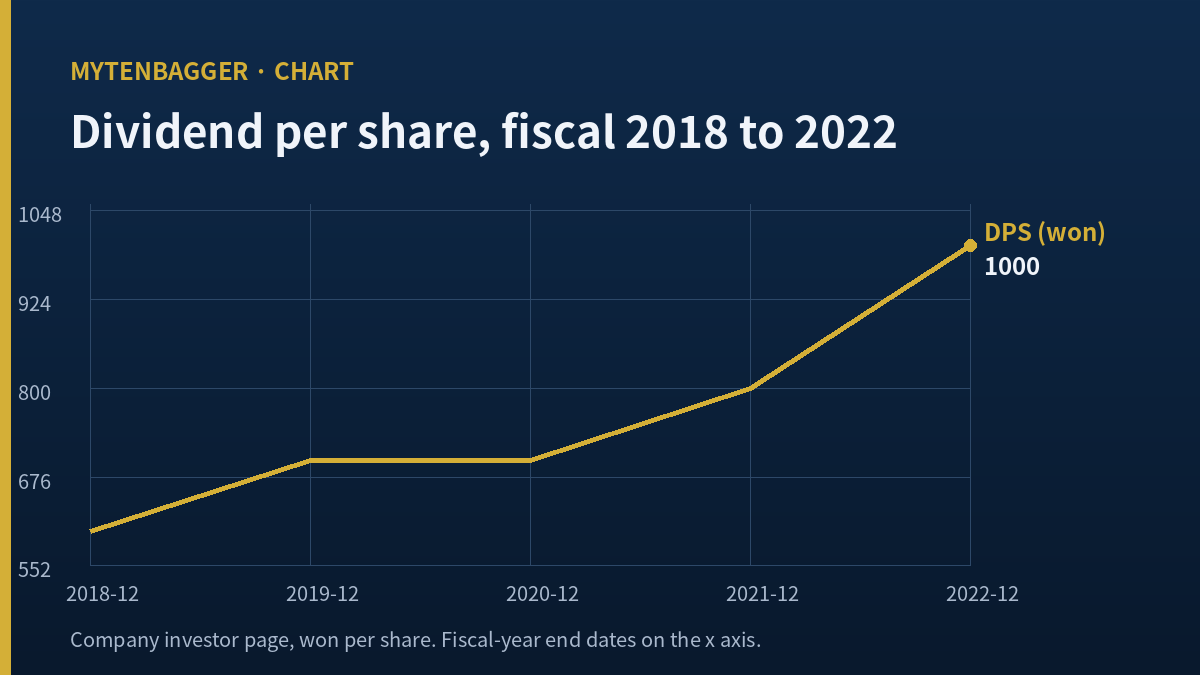
I keep a short list of Korean companies whose dividend has never gone down, and POSCO International stock has sat on that list for a while. Eight straight fiscal years without a reduction, from 600 won per share in 2018 to 1,850 won in 2025. That is a 208.33% increase over the span, which I worked out myself from the company’s own annual table.
What I had not done until this week was put that run of raises next to the cash the business actually generated in the same years. When I did, the two lines stopped agreeing with each other. The dividend went up in a straight line. Operating cash flow went down in two of the four years I can read from the filings, and in one of those years it fell while capital spending hit its highest level of the period.
I do not own this stock and I have no order in it. This is a watch note written against the closing price of 57,300 won on Thursday, 10 September 2026, on the Korea Exchange main board, which Korean investors call the KOSPI as distinct from the smaller-company KOSDAQ board. Everything below is either a filed number or something I divided myself, and I say which is which.
Contents
POSCO International Stock and Eight Years Without a Cut
The company publishes a dividend table on its investor site, and the outline of it is unusually clean for a commodity trading business. Of the seven year-on-year moves inside that span, five are increases and two are holds. None is a cut. I list the first five years here because the later ones are where the money gets large enough to change the argument, and I want the early years visible on their own.
| Fiscal year | Dividend per share | Move |
|---|---|---|
| 2018 | 600 won | starting point |
| 2019 | 700 won | up |
| 2020 | 700 won | held |
| 2021 | 800 won | up |
| 2022 | 1,000 won | up |
Why a clean ladder deserves a second look
A ladder like that is the kind of thing I reward in a screen. It suggests a board that treats the payout as a commitment and not as a leftover. But the business underneath is a trading house. It buys and sells energy cargoes, food commodities and steel, it operates a gas field in Myanmar and a palm plantation in Indonesia, and it makes drive motor cores for electric vehicles. Working capital in a business like that swings hard, and a straight line of dividends sitting on top of a swinging business is worth checking before it is admired.
What the Cash Did While the Dividend Only Went Up
Here are four years of dividends paid against operating cash flow in the same years, in billions of won. The dividend totals come from the company investor page. The cash flow figures come from the annual filings with Korea’s electronic disclosure system. The right-hand column is mine, and it is simply one divided by the other.
| Fiscal year | Dividends paid | Operating cash flow | Share taken |
|---|---|---|---|
| 2022 | 123.4bn won | 1,233.3bn won | 10.00% |
| 2023 | 170.2bn won | 1,076.4bn won | 15.81% |
| 2024 | 264.2bn won | 876.9bn won | 30.13% |
| 2025 | 315.3bn won | 1,941.5bn won | 16.24% |
The dividend column only rises. The cash column falls twice, in 2023 and again in 2024, before more than doubling in 2025. The share taken therefore triples between 2022 and 2024 and then falls back by roughly half. None of those movements comes from a decision about the dividend. They come from what the trading business happened to convert into cash that year.
The year the two lines pulled hardest
2024 is the year worth sitting with. Operating cash flow came in at 876.9bn won, the lowest of the four. Capital expenditure came in at 754.4bn won, the highest of the four. So the year with the least cash coming in was also the year with the most cash going out into assets. And the dividend went up.
I want to be careful about what that does and does not prove. A company investing heavily while cash generation dips is doing something entirely normal, and boards do not reset shareholder payouts because one year of working capital moved the wrong way. What it does show is that the payout and the cash generation are not the same story, and a reader who only looks at the unbroken ladder of raises will not see that they ever came apart.
One more thing about that 2024 pairing deserves stating plainly, because it is the part I keep coming back to. The board did not merely hold the dividend in the year cash generation was weakest. It raised it, and by the largest single step in the eight-year run. A reader could take that as confidence, and it may well have been. A reader could equally take it as a payout number already fixed somewhere upstream of the cash flow statement, and not up for revision because one year came in light. The filings do not let me tell those two apart, and I want to be clear that I am not claiming to.
What I can say is that the two explanations imply different things about the next weak year. If it was confidence, the next dip changes nothing. If it was a fixed number, the next dip also changes nothing, right up until the year it does. That asymmetry is why I keep the cash column in view even though the ladder has never broken.
What happened next
The second quarter of 2026 was, on the operating line, the strongest single quarter this company has filed in the eighteen quarters I counted. Revenue and operating profit both came in ahead of the first quarter, and the half-year net figure was well ahead of the comparable half of 2025. Alongside that, on Friday, 31 July 2026, the board declared an interim cash dividend that by itself amounts to four fifths of what the company paid for the whole of 2025.
POSCO International Stock Against a Tokyo Trading House
The closest listed comparison I can find is not another Korean company. It is a Japanese general trading house, because that is the business model this company most resembles once you stop looking at the parent group. I used Mitsui and Co. (TYO: 8031), whose statistics page I read on a screen last updated 11 August 2026.
Mitsui traded at 4,889.00 yen with a market value shown as 13.83 trillion yen on 2.83 billion shares. I multiplied those and got 13.84 trillion yen, which is the same number to the precision shown. Earnings per share were 327.69 yen, the dividend per share 140.00 yen, and return on equity 11.38%. Its operating margin, 3.47%, sits close to the mid-3% level the Korean company has run on the same measure, so the comparison is not absurd on that axis either.
One thing I did not do, and want on the record: I never divided a yen figure by a won figure. Every ratio below is computed inside a single currency, and only the resulting percentages are set side by side.
| Line | Top of the fraction | Bottom of the fraction | Result |
|---|---|---|---|
| Korean company, payout | 315.3bn won | 614.1bn won | 51.35% |
| Mitsui, payout | 140.00 yen | 327.69 yen | 42.72% |
| Korean company, yield | 1,850 won | 57,300 won | 3.23% |
| Mitsui, yield | 140.00 yen | 4,889.00 yen | 2.86% |
The Korean company hands shareholders a larger slice of its profit and a larger yield. That is the whole of what this table says, and I am wary of reading a verdict into it. The Korean company’s return on equity, which I computed at 9.15% from its 2025 owner-attributable profit and the matching equity balance, is the lower of the two. A higher payout on a lower return on equity can mean a disciplined board, or it can mean a business with fewer places to put the money. The table does not tell me which.
A screen figure I could not reproduce
The same Mitsui page shows a payout ratio of 35.05%. I cannot get there from the dividend and earnings figures printed on that page, which give me 42.72%. The gap is large enough that one of the two inputs must be from a different period, and I could not establish which. I have used my own division and left the screen number out of the table, because a figure I cannot reproduce is a figure I did not verify. Readers who want to check me have both inputs above.
One Won of Equity Changed Hands on a Single Day
On Friday, 7 August 2026 the parent, POSCO Holdings, filed that it would sell 36,434,963 shares of this company off-exchange at 55,400 won each. That is a fifth of the shares in issue moving in one transaction, and the parent still holds half the company afterwards, which tells you how concentrated the register was to begin with. A second block in an affiliate was announced at the same time.
The part I find more interesting than the sale is the hedge attached to it. The parent signed a price return swap over three years struck at that same per-share level. As reported, if the shares sit below that level at maturity the seller makes up the difference. So the shares left, and the price exposure did not. For a minority holder the practical effect is that a large seller has a standing interest in where this stock trades for the next three years, which is not the same thing as a clean exit.
Converted at the Seoul afternoon close of 1,339.2 KRW per USD on Thursday, 10 September 2026 (2026-09-10), the block came to roughly US$1.51 billion. That is the only dollar figure in this note, and I converted it once, at one published rate, on one stated date.

What POSCO International Stock Actually Owns
Before the cash question means anything, it helps to know what generates the cash. This is not a single-product manufacturer whose quarterly output you can model from one plant running at a known rate. It runs three quite different kinds of business under one listing, and each converts revenue into cash on a different clock.
The first is energy. The company holds an offshore gas field off Myanmar that has been producing for years, an Australian gas producer it bought and has since been expanding, and liquefied gas terminal and power generation assets at home. Energy is where the margin lives: it is a small share of the revenue line and a large share of the operating line, which is the usual arrangement for an upstream asset sitting inside a trading company.
The second is trading proper. Steel, grain, chemicals and industrial materials bought and sold on thin spreads at very large volume. This is what makes the revenue line enormous relative to the profit line, and it is also the part that swings working capital hardest. A cargo bought in one quarter and settled in the next moves cash without moving profit at all, which is exactly the mechanism that can produce a year like 2024.
The third is materials and food. Drive motor cores for electric vehicles, produced at scale for automakers, and a palm plantation and refining operation in Indonesia. Both were expanded recently and both consume capital before they return it.
Why that mix matters for the payout question
A company with three engines running on three clocks will not produce a smooth cash line, and nobody should expect it to. That is the honest version of the objection to everything I have written above. The counter-argument, and the reason I still think the exercise was worth doing, is that the dividend line is perfectly smooth anyway. If the underlying cash is lumpy by construction, then a payout that never wobbles is being smoothed by somebody, and it is fair to ask with what.
What the analysts published
Three named Korean houses have put a figure on this company in 2026, though I was able to open the original text of only two of them. Their dates matter more than their average. The most recent I found is a note published on Thursday, 30 July 2026 that kept its buy stance while cutting its figure, and it did so by lowering the price-to-book multiple it applies from 2.4 times to 2 times. Its own text notes that the quarter had come in ahead of the consensus operating number. So the earnings beat and the reduced figure sit in the same document, which is a useful reminder that a valuation call and an earnings call are separate things.
Two earlier notes, both dated Monday, 4 May 2026, carried higher figures, one of them raised that day on the strength of the palm acquisition and the Australian gas expansion. I am not averaging the three. Four months is a long time in a commodity-linked name, and the May notes were written before the quarter that has since become the best on record. What I take from the set is the direction of travel between May and July. A target zone is not what these three give me.
The quarterly release itself was filed on Thursday, 30 July 2026 and is the primary source for the operating figures I have referred to.
POSCO International Stock in a US Brokerage Account
There is no American depositary receipt for this company that I could find, so a US-based reader cannot buy it the way they would buy a Japanese trading house through a sponsored receipt. The practical routes are a brokerage that offers direct Korea Exchange access, or an index fund with Korean exposure.
The index route deserves a caveat specific to this name. Broad Korea funds are built around semiconductors, batteries and the large industrial groups. A commodity trading arm sitting inside one of those groups tends to be a small line in such a fund, and the dividend pattern I have described here is not what drives that fund’s return. If the reason you are interested is the payout, an index holding will not give you the payout. It will give you Korean large-cap beta with a sliver of this company inside it.
I have also not checked whether any specific Korea fund currently holds this name at a meaningful weight, and I am not going to assert that it does. The Korean company I wrote about in the same industry earlier has the same problem, and I said so there too.
Where I Could Be Wrong About POSCO International Stock
| The objection | Why it lands |
|---|---|
| Operating cash flow is the wrong yardstick | Dividends are paid from cash on hand, asset sales and borrowing as well. A single year’s operating cash flow is one input, and I treated it as if it were the input. |
| Working capital explains all of it | In a trading house, inventory and receivables can move a full year of cash flow on their own. I did not read the note that breaks those movements out, so I cannot rule this out. |
| The sell-side cut was about the multiple | A house that trimmed its valuation in late July did so by lowering the book multiple it applies. Its earnings numbers were left where they were. Sentiment can restore that multiple without anything in my argument changing. |
| The peer is not really a peer | Mitsui is several times larger, reports under a different standard and carries a different mix of upstream assets. I chose it on business model and not on size, and that choice is arguable. |
| My causation may be backwards | I have written this as though the cash line is the honest one and the dividend line is the managed one. It is equally possible that the board reads through a single weak cash year deliberately, and that the steadiness is the signal and the wobble is the noise. |
The fourth and fifth of those are the ones that would actually change what I do. If the steadiness is deliberate policy and not arithmetic that happens to land, then the thing I have been calling a gap is a feature, and a reader would be right to weight the ladder over the cash column.
POSCO International Stock and the Order I Watch It In
Two separate paths lead me to the same holding pattern, and they do not break at the same speed. The first is the earnings path: the operating line just posted its best single quarter of the eighteen I counted, and one quarterly filing can undo that. The second is the cash path: the dividend keeps rising while the cash behind it moves in a wide band, and that takes both capital expenditure and working capital moving together before it resolves either way.
Because the first path breaks faster, I watch it first. The third-quarter report is due by Monday, 16 November 2026, and the earnings line will be visible in it immediately. Only if that line holds do I need to spend time on the second path, and at that point the question becomes whether the first three quarters of cash generation, after capital spending, cover what has already been declared for the interim.
If the earnings line breaks, the cash question is moot and I will not open the cash flow statement at all. If the earnings line holds and the cash question resolves badly, that is the more interesting outcome, because it would mean a company earning well and still stretching to fund a payout it has not missed in eight years. That is the version of this story I would want to write next.
For readers following the same corner of the Korean market, I have two related notes on the same group and industry: one on a rival trading house whose dividend disclosure told me something its share count did not, and one on the parent holding company and its lithium unit. The first asks what a dividend total reveals; this one asks what pays for it.