Iljin Electric stock and a product mix that is now flipping
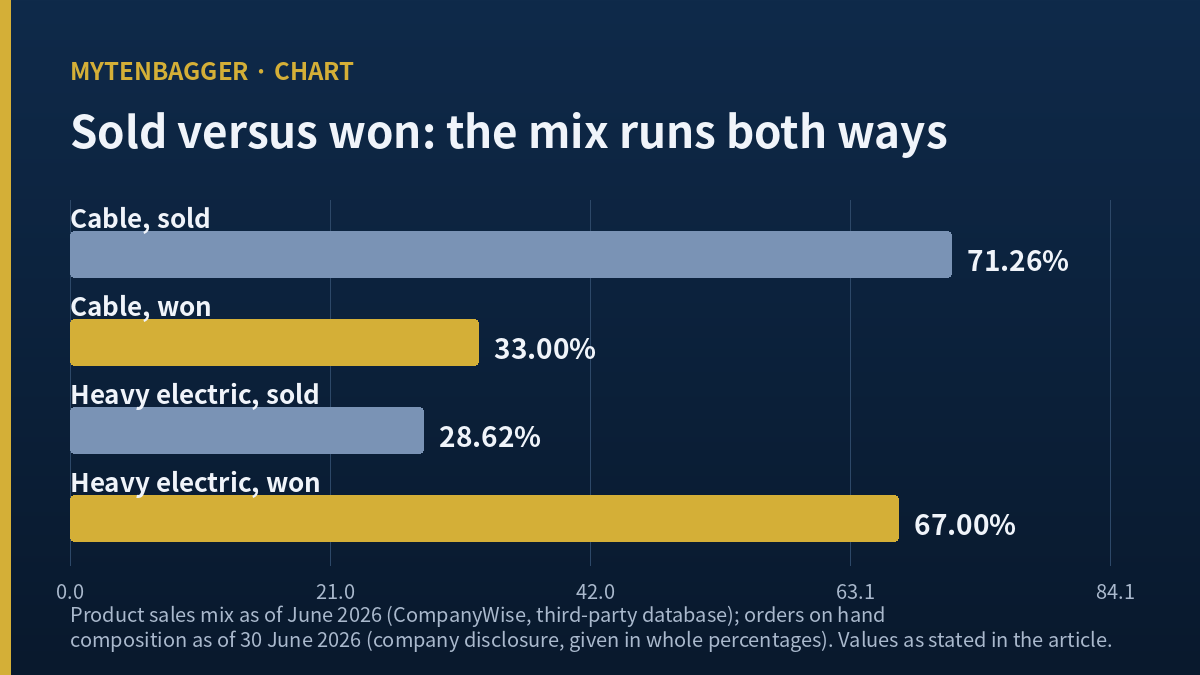
Two proportions describe Iljin Electric stock, and they run in opposite directions. Measured by what the company actually sold through the first half of 2026, the product set is 71.26 percent cable and 28.62 percent heavy electric equipment. Measured by the work it has already won and has not yet delivered, the split is 67 percent heavy electric and 33 percent cable. I spent most of my session on those two lines, because a company whose sales and whose won orders point at different divisions is a company in the middle of becoming something else, and I wanted to see whether the valuation had noticed.
Contents
What I checked in Iljin Electric stock
product sales, cable share    :  71.26 percent
product sales, heavy electric :  28.62 percent
orders on hand, heavy electric:  67 percent
orders on hand, cable         :  33 percent
price to book value           :  5.75 times
equity growth, 2023 to 1H26   :  76.26 percent
debt ratio, 1H26              : 161.09 percent
market value                  :  about USD 2.52 billion
I lined the colons up because the first four rows are the point of this piece and the last four are what the market is paying while those four rows move. Every figure above is sourced in the sections that follow.
Iljin Electric stock sells a product set that is mostly cable
The Korean corporate database CompanyWise lists the product mix as of June 2026 at 71.26 percent cable, 28.62 percent heavy electric equipment, and 0.12 percent other, which sums to exactly one hundred (CompanyWise company profile). For readers outside Korea: this is a KOSPI-listed industrial, the KOSPI being the senior board of the Korea Exchange, roughly comparable in role to the New York Stock Exchange and distinct from a growth board.
Cable and heavy electric equipment are not the same business. Cable is a metals pass-through with a fabrication margin on top, and the price of copper walks through the revenue line in both directions. Heavy electric equipment means transformers and circuit breakers, sold into utility and data center procurement, where lead times are long and the order is won years before the revenue arrives. A company that is 71 percent one and 29 percent the other is, on the sales line, a cable maker with a transformer side.
The margin had already moved
The annual figures from Hankyung’s financial summary show revenue of 1,246.7 billion won in 2023, 1,577.2 billion won in 2024, and 2,044.6 billion won in 2025, with operating profit of 60.8, 79.7, and 151.2 billion won across the same three years (Hankyung financial summary, restated from the million-won units as published). Those pairs give operating margins of 4.87 percent, 5.06 percent, and 7.40 percent by my arithmetic.
The 2026 half is a further step. The company reported second-quarter revenue of 637.4 billion won and operating profit of 72.0 billion won on 11 August 2026, a Tuesday, with the half at 1,143.5 billion won and 122.8 billion won (Hankyung earnings report). That is an 11.30 percent quarterly operating margin and a 10.74 percent half-year margin. Eleven percent is a high return for a business whose largest line is metals pass-through work, though I have not benchmarked Korean cable margins to prove that. Something in the mix is doing the work. The company does not publish profitability by division, so I cannot name the side, and the revenue table does not name it for me either.
The orders already won by Iljin Electric stock point the other way
As of the end of June 2026 the company put unfilled orders at about 1.94 billion US dollars, up roughly ten percent from the first quarter, and gave the composition as 67 percent heavy electric equipment and 33 percent cable. The Korean coverage of that release converted the order figure to about 2.7486 trillion won, applying a rate of its own. I am attributing that won figure to them and keeping it out of my own currency work below.
So the proportions are inverted. Cable is 71.26 percent of what got sold and 33 percent of what has been won. Heavy electric equipment is 28.62 percent of what got sold and 67 percent of what has been won. I have looked at a fair number of Korean industrials and I do not often see the two lines this far apart in the same filing season. What it says, if the orders arrive as booked, is that the revenue mix of 2028 or 2029 will not resemble the revenue mix of the table I opened with.
What I cannot tell from the order line
Three things are missing and I want them on the record before I build anything on this. The schedule is not disclosed, so I do not know how much of the 1.94 billion becomes revenue in 2027 as against 2030. The pricing terms are not disclosed, so I do not know whether a transformer won in 2024 carries the margin of one won in 2026. And the order figure is a company disclosure, which is a fine source for a quantity and a weak one for a quality. I am treating the proportion as solid and the timing as unknown.
Iljin Electric stock at 5.75 times a book value that grew 76 percent
The closing price on Friday 11 September 2026 was 71,000 won. Against book value per share the CompanyWise screen puts the multiple at 5.75 times, working off a book value of 12,347 won per share (CompanyWise summary, screen date 11 September 2026). Hankyung’s own table gives 12,344.90 won for the same year end, and dividing the published equity by the share count lands at 12,344.87 won.
The gap between the two screens is 2.13 won per share. In total it comes to about one hundred million won on a company this size, which is nothing, and that is exactly why I am writing it down instead of choosing. When two versions of a figure differ by a rounding error, picking one silently is a reflex that will eventually be applied to a figure where the gap matters. I used neither. Where I needed a per-share book figure below, I used the one that reproduces from the published equity.
The equity grew fast, and the liabilities grew faster. Valueline’s balance sheet gives total equity of 344.9 billion won at the end of 2022, then 371.1, 500.3, 588.7, and 654.2 billion won through the first half of 2026 (Valueline balance sheet). From the 2023 figure to the 2026 half that is growth of 76.26 percent. Assets less liabilities reconciles to equity in four of the five periods exactly and in the fifth, 2023, to within a tenth of a billion won, which is rounding. Running assets minus liabilities down every column is the first thing I do before I use a balance sheet at all.
| Period | Assets | Liabilities | Equity | Debt ratio |
|---|---|---|---|---|
| 2022 | 839.5 | 494.6 | 344.9 | 143.41% |
| 2023 | 928.9 | 557.7 | 371.1 | 150.28% |
| 2024 | 1,249.0 | 748.7 | 500.3 | 149.65% |
| 2025 | 1,526.0 | 937.3 | 588.7 | 159.23% |
| 1H 2026 | 1,708.0 | 1,053.8 | 654.2 | 161.09% |
Amounts in billions of won. Debt ratios are liabilities over equity, computed by me from the two columns beside them, and the three years for which Hankyung publishes the same ratio agree with mine to the second decimal.
I read this as a working capital story and I want to be careful about how far that reading goes. A business winning multi-year equipment orders carries inventory and receivables ahead of the cash, and the liability side grows with it. The ratio going from 149.65 percent to 161.09 percent while equity itself grew 76.26 percent means liabilities grew faster still. That is normal for an order-led expansion and it is also exactly what a stretched balance sheet looks like from the outside. I cannot separate the two from these columns alone, and I did not try. The same question runs through the margin mix at LS Electric, a larger Korean name in the same end market.
Currency, and the one rate I used
Korean won is the reference currency throughout this piece. Where I show dollars I used 1,341.59 won to the dollar, the 11 September 2026 close (Investing.com historical rate). On that rate the market value of about 3.386 trillion won comes to about 2.52 billion US dollars. Figures and multiples reflect the 11 September close as I checked them while writing, so live quotes can differ, and the dollar figures here are approximate.
Iljin Electric stock beat an estimate that was six weeks old
On 1 July 2026, a Wednesday, NH Investment and Securities analyst Lee Min-jae modelled the second quarter at 549.3 billion won of revenue and 54.5 billion won of operating profit, figures reported by the Korean financial press (Newspim report briefing). The quarter came in at 637.4 and 72.0. Revenue arrived 16.04 percent above the estimate and operating profit 32.11 percent above it.
I did one thing before I used those numbers, and it is the reason I trust them. Both sources imply a second quarter of 2025 without stating it. Dividing the reported 637.4 by the reported growth of 21.9 percent gives 522.9 billion won; dividing the estimated 549.3 by the estimated growth of five percent gives 523.1. On the profit line the two paths give 37.60 and 37.59 billion won. Two independent documents, written six weeks apart by different people, describe the same prior quarter to within a fifth of a percent. That is what tells me I read both correctly.
Two screens gave me two market values, and I nearly used the convenient one
Here is the part of this session I am least pleased with. When I pulled the peer data further down, the summary page gave a market value of 24.32 billion dollars, and the same site’s own share count times its own price comes to 24.53 billion. Under half a percent apart. My hand went to the smaller figure without my deciding anything, because the smaller figure made the size gap between the two companies a rounder number, and a rounder number is easier to write a sentence around.
I caught it only because I had committed in advance to multiplying price by share count on every screen I touch. The discipline was not insight; it was a rule I had written down on a previous occasion for a different reason, and it happened to be pointed at this. Had I not had the rule, I would have taken the convenient figure, no check anywhere in my process would have flagged it, and the piece would have read exactly as well. I have kept both figures in the peer section below and used the one that gives the less flattering comparison.
Beside Hubbell, a US maker of the same equipment
For a global reference I used Hubbell Incorporated (NYSE: HUBB), a US electrical and utility solutions maker, on the same 11 September 2026 date (Hubbell summary). I put the comparison as four questions instead of a table, because three of the four answers only make sense with the reasoning attached.
Four questions, two answers each
What does each one cost against its own book value?
Iljin Electric: 5.75 times, on a per-share book value in the low twelve thousands of won.
Hubbell: 6.22 times, on a book value of 74.04 dollars per share against a 464.39 dollar close. My own division of those two gives 6.27, so the screen is using a slightly different price or a slightly different equity date, and I am flagging that difference instead of smoothing it.
How much bigger is the US company?
Iljin Electric: about 2.52 billion dollars of market value.
Hubbell: 24.32 billion dollars on the screen, 24.53 billion when I multiply its 52.83 million shares by its close. The gap is 9.64 times on the screen figure, which is the smaller of the two ratios, and that is the one I am using.
How much has each fallen from its own 52-week high?
Iljin Electric: 71,000 won against a high of 147,900 and a low of 33,500, so 51.99 percent below the high and 111.94 percent above the low. The high to low ratio over one year is 4.41.
Hubbell: 464.39 dollars against a range of 403.82 to 565.50, so 17.88 percent below its high. One of these two names has had a very different year from the other, and the beta figures agree: 1.22 against 0.89.
What did I deliberately leave out of this comparison?
Operating margin, where Hubbell shows 20.58 percent and the Korean company shows 10.74 percent for its half, because the two are computed under different accounting regimes and different revenue recognition perimeters and a reader would take the gap as twice as meaningful as it is. Return on equity, for the same reason. The earnings multiple, because this piece is deliberately built on book value and I am not going to import a second valuation frame at the end to make a point. And leverage, because Hubbell’s 5.56 billion dollars of debt against 3.92 billion of equity is an interest-bearing measure, while the 161.09 percent above counts every liability including trade payables. Those are not the same ratio and I will not put them in the same sentence as though they were.
Already wrong, and could be wrong
Three of these I already know are weak points. Four I simply cannot resolve.
Already wrong, in the sense that I know the defect:
- The half-year operating profit is 122.8 billion won when I add the two quarters and 122.7 billion won as the company’s own release rounds it. I used my addition, and a reader comparing against the press release will find a tenth of a billion missing.
- I printed Hubbell's 20.58 percent operating margin beside this company's 10.74 percent inside the very paragraph that explains why the two cannot be compared. Both figures now sit in this piece doing nothing except tempting a reader to divide one by the other.
- The order composition of 67 and 33 is a company-supplied percentage with no underlying schedule attached. I have treated a disclosure as a measurement.
Could be wrong, and I cannot tell:
- The 71.26 percent product mix is dated June 2026 on a third-party database. If that database refreshes on a lag, the inversion I built this piece on is smaller than I have drawn it.
- Rising liabilities may be an expansion funding itself or may be a balance sheet under strain, and the five columns I have cannot separate those.
- A sell-side model that missed a quarter by 32.11 percent may simply be an old model, or the analyst may have been right about the run of the business and wrong about a one-off. I have no way to split that.
- The heaviest one: if the two proportions are both published, both current, and both visible to anyone with the same two screens I used, then the inversion is not a finding. It is a fact the market has already had for weeks, and what I would be selling as insight is really just legwork.
What I left out, and where I stand
I hold none of this and I have no order working. The size is part of it, at about 2.52 billion dollars of market value, and the rest is the timing problem: a mix that is changing is a mix I cannot value until at least two more quarters show me the rate of change. Foreign ownership sits at 10.39 percent on one screen and 10.60 percent on another, and I did not use either; the figure adds nothing to a question about product mix. I also left out the 2026 half-year cash flow entirely, which is a real omission for a company with a debt ratio at 161.09 percent.
One more piece of arithmetic before I put this down, because it decides how much the inversion is worth. The orders already won come to about 2.7486 trillion won on the rate the Korean outlet applied, against half-year revenue of 1,143.5 billion won. Doubling the half gives an annual rate of 2,287.0 billion won, so the work already won amounts to roughly 1.20 years of revenue at the current pace. That is a thin cushion by the standards of an equipment maker, and it means the mix inversion has to be fed by continuing intake, because there is no large stock of work already sitting there. The ten percent quarterly growth in orders on hand is therefore not a detail. It is the mechanism.
What I am keeping are the two percentages, 71.26 and 67, and the date they were measured. When I open this company again those are the first two lines I will pull, and if they have converged then the piece you are reading has expired on its own terms.
Related reading: Hyosung Heavy Industries after its rally give-back