SK Gas Stock: Six Months of Finance Costs Beat a Full Year
I have thrown the coverage ratio out of my last two write-ups. Once the arithmetic would not reproduce at all. Once it reproduced and still failed to agree with the rest of the income statement. When I opened the same field on SK Gas stock it showed 0.35, and I started the calculation expecting to throw it out a third time.
I could not. The problem was that the number came back too cleanly. Operating profit for the first six months of 2026 was 183.747 billion won (about USD 136.52 million), finance costs over the same six months were 527.823 billion won (USD 392.17 million), and the division gives 0.348122. The screen prints 0.35. That agrees to the second decimal place.
Then I checked the size against the balance sheet. Total liabilities at the end of June 2026 stood at 6,325.882 billion won (USD 4.70 billion). Paying 527.823 billion won of interest across six months on that base works out to 8.34 percent per half year, which annualizes to 16.69 percent. A company carrying a 147.95 percent debt-to-equity ratio does not borrow at that price. So instead of dropping the field a third time, I made the field the subject of this piece.
One figure, four divisions
| Figure used | What I divided it by | Result |
|---|---|---|
| 527.823bn won | Six-month operating profit, 183.747bn won | 0.3481 (screen shows 0.35) |
| 527.823bn won | Total liabilities, 6,325.882bn won | 8.34% per half year |
| 527.823bn won | Six-month revenue, 4,948.251bn won | 10.67% |
| 527.823bn won | Full-year 2025 finance costs, 435.408bn won | 1.2122 times |
The left column repeats the same figure four times. Only the first result appears on any screen I can find. I hold no position and have no order working.
Contents
SK Gas stock and a ratio that reproduces exactly
Start with what works. The half-year report filed on August 13, 2026 puts consolidated operating profit at 183.747 billion won and finance costs at 527.823 billion won. Divide and you get 0.348122. The vendor screen prints 0.35. There is no gap to explain.
Normally that settles the question and I use the number. Here it did the opposite. Once I traced each side back to the filing, the label on the bottom half stopped matching its contents.
Where the bottom half of the ratio comes from
Korean filing taxonomy carries two separate accounts here. One is pure interest expense, tagged where a company reports it separately. The other is aggregate finance costs, which stands in where the first is absent and which sweeps in derivative valuation losses and foreign exchange losses alongside interest. Which of the two fed this screen is printed nowhere. The size answers it. For a company buying liquefied petroleum gas in dollars on the water and selling it in won on shore, those two swept-in items are among the largest moving parts in the whole statement.
This matters for anyone screening Korean equities on ratios. The field name says interest. The account underneath says finance costs. Nothing on the screen tells you which one you are looking at.
Half a year of finance costs ran past a full year
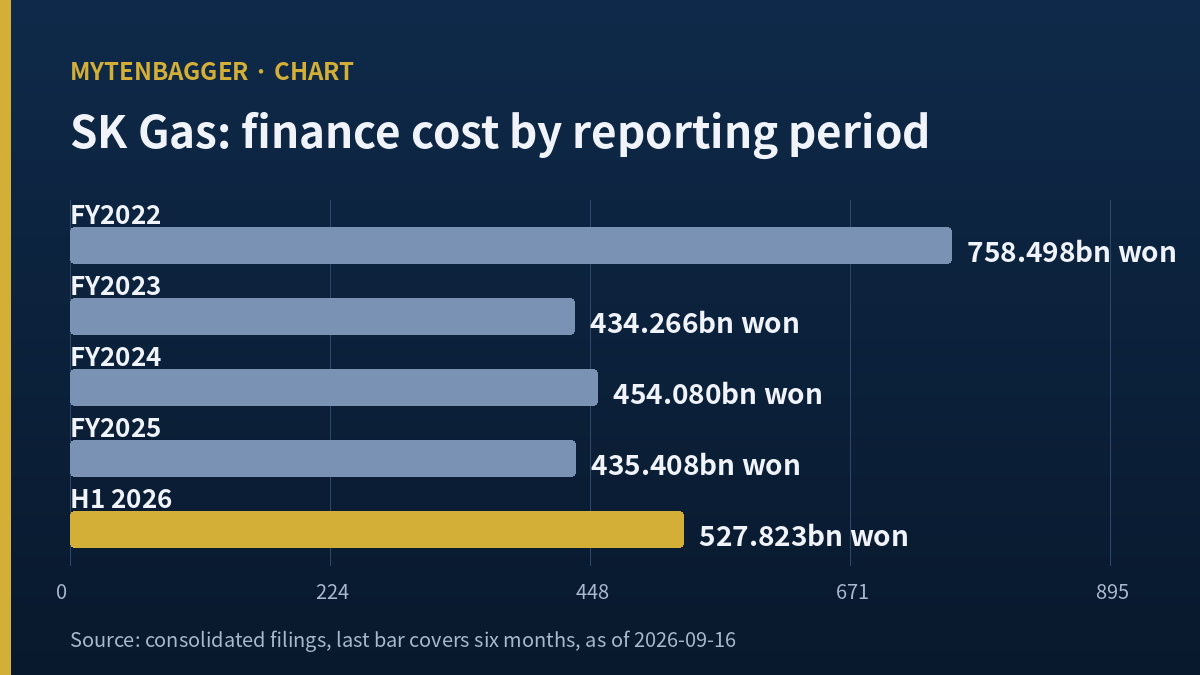
Here is the size problem stated plainly. Finance costs for the first six months of 2026 came to 527.823 billion won. Finance costs for all twelve months of 2025 came to 435.408 billion won. Six months exceeded twelve by 92.415 billion won, or 1.2122 times.
Interest expense does not behave that way. Total liabilities went from 4,887.336 billion won at the end of 2025 to 6,325.882 billion won at the end of June 2026, a rise of 29.43 percent. Annualizing the six-month charge gives 1,055.646 billion won against the 435.408 billion won actually booked for all of 2025, which would be 2.42 times. A 29 percent move in the debt base cannot carry a 142 percent move in the interest bill sitting on top of it. Something else is inside that account.
SK Gas stock reported net income above operating profit
The counterweight sits four lines below. Operating profit for the six months was 183.747 billion won. Net income for the same six months was 234.321 billion won (USD 174.10 million). Net income came in 50.574 billion won higher.
If 527.823 billion won of real cost had passed through the statement below the operating line, that ordering could not happen. For net income to finish above operating profit after such a charge, finance income of at least the same magnitude has to sit opposite it. That is the signature of a hedged commodity book reported gross on both sides.
My working conclusion is that I read financial income and financial cost at this company only on a net basis. Pulling one gross line out and building a ratio on it measures a presentation choice, and I do not want a presentation choice deciding whether a stock stays on my list.
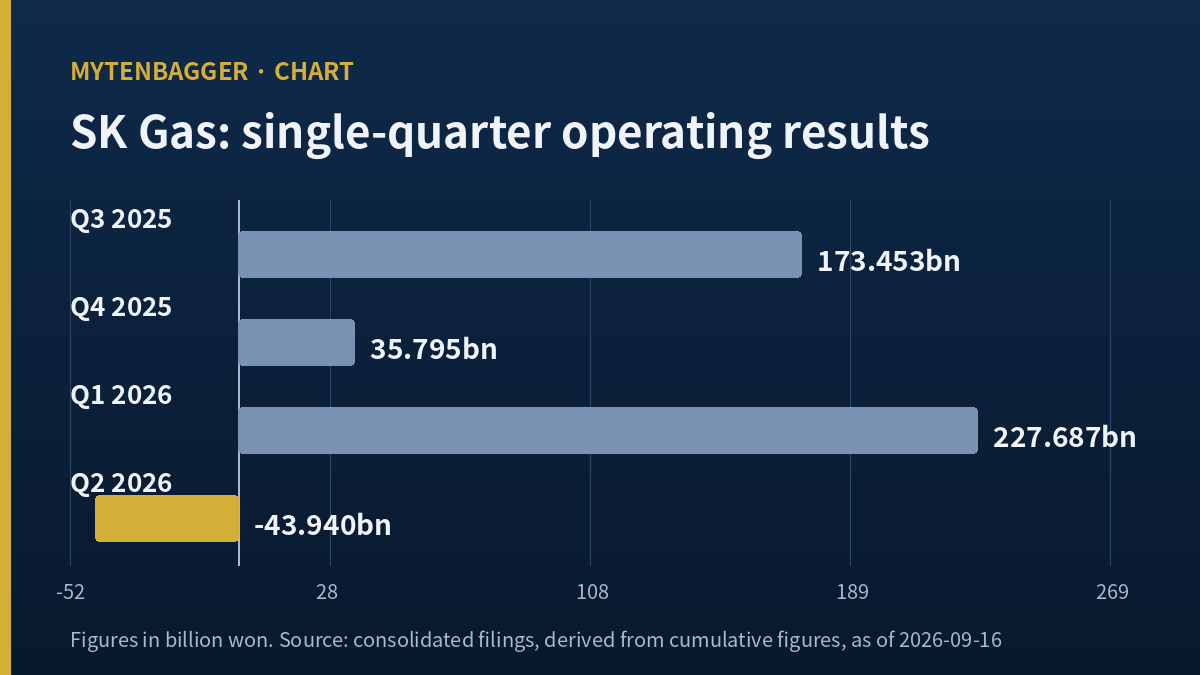
The ordering repeats one level down. In the March 2026 quarter alone, operating profit was 227.687 billion won and net income was 267.353 billion won, a further 39.666 billion won on top. In the June quarter both went red together, at minus 43.940 billion and minus 33.032 billion won. So the pattern is not a single accident in one cumulative column; it shows up in each of the two quarters that make up the half, in the same direction as the half itself.
There is also a growth reading here that the coverage field cannot see. Revenue for the first half of 2026 was 4,948.251 billion won against 3,707.379 billion won a year earlier, a rise of 33.47 percent. Operating profit over the same comparison went from 233.583 billion won to 183.747 billion won, a fall of 21.34 percent. A third more volume moving through the business and a fifth less profit out of it is a margin story, and margin stories at a fuel importer are usually about the spread between the import price and the domestic sale price. That is the question I would take into the next filing if the finance cost line were not standing in front of it.
| Period | Operating profit | Finance costs | Ratio | Net income |
|---|---|---|---|---|
| FY2022 | 390.470bn | 758.498bn | 0.51 | 257.077bn |
| FY2023 | 303.595bn | 434.266bn | 0.70 | 316.290bn |
| FY2024 | 287.176bn | 454.080bn | 0.63 | 177.768bn |
| FY2025 | 442.831bn | 435.408bn | 1.02 | 233.818bn |
| H1 2026 | 183.747bn | 527.823bn | 0.35 | 234.321bn |
Consolidated figures from Korean regulatory filings, in Korean won. The last row covers six months and the four above it cover twelve, so the rows are not comparable in size to one another. Each ratio holds only within its own row.
Four of the five periods sit below 1.00, and FY2025 at 1.02 is the only one that clears it. Every one of the five produced positive net income, the weakest being 177.768 billion won in FY2024. A company genuinely unable to cover interest out of operating profit in four separate periods does not close all five of them in the black. The table is describing something other than solvency.
The day SK Gas stock fell 11.41 percent
None of the above means the June quarter went well. It did not.
On July 31, 2026 the company published preliminary results for the second quarter showing revenue of 2,313.0 billion won and an operating loss of 43.9 billion won (USD 32.65 million). Taking the first quarter out of the half-year filing gives revenue of 2,312.994 billion won and an operating loss of 43.940 billion won, which matches the company release down to the million. Two independent routes to the same figure.
Korean press reporting the FnGuide consensus put the quarter at an expected operating profit of 148.9 billion won and net income of 116.7 billion won, as Aju Business Daily wrote. Measured against the reported loss, the operating line came in 192.84 billion won under. The close on Monday, August 3, 2026 was 198,000 won against 223,500 won on Friday, July 31, a decline of 11.41 percent. The same article, quoting an intraday print at 9:54 a.m., gave 10.29 percent. Both figures are correct and they measure different moments.
I also recounted the 250-session range, because the vendor field labeled it as a closing-price series and I have now found that label wrong at six companies in a row. On closing prices the high across 250 sessions is 290,000 won (May 15, 2026) and the low is 198,000 won (August 3, 2026). The screen shows 302,000 won, which is the intraday high on that same May date. The screen low of 196,100 won appears nowhere in 260 rows of daily data, at either the close or the intraday low. So I use my own count: 15.00 percent below the closing high, 24.49 percent above the closing low. Worth noting on its own is that a single earnings release set the twelve-month floor for this stock. No cycle was involved.
A US propane distributor prints the same line differently
To see whether the ratio travels, I put it next to UGI Corporation (NYSE: UGI), a US propane distributor and gas utility group selling a similar molecule into a similar mix of retail and utility demand. UGI closed at USD 37.99 on September 11, 2026, the same calendar date as the Korean close used here, giving a market value of USD 8.15 billion on 214.49 million shares. Trailing revenue is USD 7.296 billion, net income USD 671 million, price to earnings 12.57 and price to book 1.56, per stockanalysis.com. I checked three of those against each other: 37.99 divided by earnings per share of 3.02 gives 12.579, 37.99 over book value per share of 24.30 gives 1.5634, and the 1.50 annual dividend on 37.99 gives 3.95 percent.
I am comparing exactly one item and leaving the rest alone. UGI reports an operating margin of 16.16 percent and a pretax margin of 10.46 percent. On trailing revenue that gap is USD 415.87 million, and operating income of roughly USD 1,179.03 million over that gap is 2.84 times. Those are my figures, derived from the two margins. SK Gas produces 0.35 from a line with the same name.
A gap of roughly eight times between two companies selling the same fuel should not be read as a gap in credit quality. It is the difference between a statement that nets its financial items and one that presents them gross. I have left revenue, growth, market value, dividend history and beta out of this paragraph entirely, because none of them would test the thing I am actually testing.
What 1.22 trillion won in June did not touch
In the same quarter that produced the operating loss, 1,224.245 billion won (USD 909.61 million) arrived at this company. It came from selling 49 percent of Ulsan GPS, 3,381,180 shares, to a private equity vehicle. Dealsite, a Korean financial outlet, put the consideration at 1,224,244,940,000 won and noted it equals about 38.93 percent of the prior year-end equity base. Dividing the same two figures myself gives 38.9323 percent, so the published ratio and mine agree.
The company kept 51 percent. Because control did not change hands, the transaction is recorded in equity and never passes through profit or loss. Revenue does not see it. Operating profit does not see it. Net income does not see it. An operating loss of 43.9 billion won and an inflow of 1,224.2 billion won belong to the same three months and sit in different statements. Ulsan GPS is a combined-cycle plant able to burn both liquefied natural gas and liquefied petroleum gas, in commercial operation since late 2024, and Dealsite reported 2025 revenue of 769.1 billion won and net income of 101.2 billion won for it. Grossing the 49 percent consideration to the whole implies 2,498.5 billion won for 100 percent, which is my own derivation and not a published valuation.
And a company arriving on November 4
On August 26, 2026 the board approved a merger agreement absorbing subsidiary SK Advanced. Bloter reported the exchange ratio as one to zero with no new shares issued and a merger date of November 4, 2026. For my arithmetic that is the whole story: the share count of 9,269,371 stays where it is, so price, market value and every per-share figure keep the same base. When a Korean merger is announced the first thing I check is the share count, and this time it did not move.
The business content is harder. SK Advanced runs a propane dehydrogenation unit turning propane into propylene, and Bloter counted operating losses of 129.0 billion, 82.5 billion, 116.1 billion and 140.0 billion won across 2022 through 2025, totaling 467.6 billion won, before a 40.4 billion won operating profit in the first half of 2026. The same report estimated the combined debt-to-equity ratio at 131.2 percent. Sisa Journal e wrote that this subsidiary’s equity fell from 396.9 billion won at the end of 2023 to 185.1 billion won at the end of 2025 while its debt ratio climbed from about 145 percent to 407 percent. Sell just under half of a power plant in June, take in a petrochemical unit in November. I do not link the two transactions in one sentence, because I could not find any company statement connecting the proceeds to the merger.
Where I stand on SK Gas stock, and four arguments against me
SK Gas trades on the KOSPI, the senior board of the Korea Exchange, where the large industrial and utility names list; the KOSDAQ is the separate junior board for smaller and technology-weighted issuers. I have not verified whether either fund currently holds this name, and I am not going to assert that it does.
The close on Friday, September 11, 2026 was 246,500 won, which is USD 183.15 at 1,345.9 won per USD, the Seoul market afternoon close for 2026-09-11. On 9,269,371 shares that is 2,284.9 billion won, or about USD 1.70 billion. The 2025 dividend of 9,000 won per share was the seventh consecutive annual increase and costs 83.424 billion won, which is 35.46 percent of the 235.249 billion won attributable to owners that year. I hold none of it and have no order working. My reason is not that the business is bad; it is that the instrument I use to measure this business has not settled in my hands.
Four arguments cut against that position. First, gross presentation of financial items is a known convention and specialists in this sector never look at that field to begin with. I accept it. My answer is that the field is printed without its definition, and it stopped me twice in the space of a week. Second, the second-quarter loss may be a trading-cycle event with recovery in the second half; Yuanta’s September 10, 2026 note carries exactly that view. If it holds, my caution is late. I would want to see the size of the recovery: DS Investment’s May estimate of 678.9 billion won of 2026 operating profit needs 495.153 billion won in the second half against 183.747 billion in the first, which is 2.69 times. That multiple is my own calculation and no house has published a quarterly split of it. Third, if the 1,224.2 billion won is used to retire borrowings, finance costs fall and my concern shrinks; the company has said only that the money goes to growth investment, balance sheet strength and shareholder returns, without a split, as Asia Today reported. Fourth, a 147.95 percent debt ratio is unremarkable in this sector and one estimate puts it at 131.2 percent after the merger. That last one does not contradict me, since I am arguing about the measurement and not about the risk, but a lower debt ratio makes my 8.34 percent derivation look stranger still.
On the forward view I found three named houses. Yuanta Securities analyst Son Hyun-jung published a buy at 340,000 won on September 10, 2026, arguing that infrastructure and power generation have widened the earnings base and that the heavy investment phase is behind the company, as Edaily reported. DS Investment Securities analyst Ahn Ju-won carried 380,000 won on May 21, 2026 with 2026 estimates of 10,154.7 billion won of revenue, 678.9 billion won of operating profit and 546.2 billion won of net income, per Newsquest; that work predates the July 31 release and I flag it as a May reading. Hanwha Investment and Securities marked 320,000 won on February 10, 2026. The Hankyung consensus screen carried an average of 330,909 won and an estimated 31,621 won of earnings per share as of September 11, 2026, which is 34.24 percent above the close.
The November filing puts my own rule on the bench, and SK Gas stock second
The third-quarter report is due by Monday, November 16, 2026. What I plan to open it for is not the earnings line. I want to see whether the finance cost note separates interest expense from derivative valuation losses.
If it separates them, nothing in this article changes and I gain one settled rule: the coverage field is unusable for this sector and I stop reopening the question. If it does not separate them, the thing that changes is not my arithmetic but my procedure. Three pieces in a row will have flagged the same field without ever pinning down why, and at that point discarding the field stops being good enough and I have to rebuild the number from filings every time instead.
One more date goes on the same list. Korean press reports an investor day planned for October at which management intends to detail shareholder returns and growth spending. The moment a number is attached to that, the destination of the 1,224.2 billion won is fixed, and the third argument above becomes larger than my own. Two dates, two files to open.
Related reading on this site
For another Korean energy name where the screen and my arithmetic gave different answers, see KEPCO Engineering Stock: The Multiple Moves the Wrong Way, where a building sale sat inside a trailing multiple. Where reported profit and cash pointed opposite ways across seventeen quarters, I wrote it up in KEPCO KPS Stock Made Money Every Quarter Its Cash Did Not. For a Korean group that sold its most profitable division and rebuilt what consolidates, see SK Networks Stock Sold the Line That Earned a Third, and for a refiner pouring capital into the one unit posting losses, South Korean Refiner S-Oil Put 9.26 Trillion Into a Losing Unit.
Sources and basis for the figures
Price, market value, share count, 250-session range, the coverage field and dividend data come from a Kiwoom-sourced indicator screen, with the price basis the close of Friday, September 11, 2026. Revenue, operating profit, net income, equity, liabilities, finance costs and single-period figures come from consolidated Korean regulatory filings, specifically the half-year report received August 13, 2026 and the 2025 annual report received March 20, 2026. The 250-session high and low, the drawdown and recovery percentages, the 8.34 percent half-year rate, the 2,498.5 billion won implied value and the 2.69 times second-half requirement are my own calculations. Consensus average and estimated earnings per share are from the Hankyung consensus screen as of September 11, 2026. Every dollar figure in this article rests on a single rate, 1,345.9 won per USD, the Seoul market afternoon close for 2026-09-11 as reported by Money Today. Korean-language sources are paraphrased into English here and are not quoted verbatim from the original wording.