Hyundai Greenfood Stock: Its First Year Lasted Ten Months
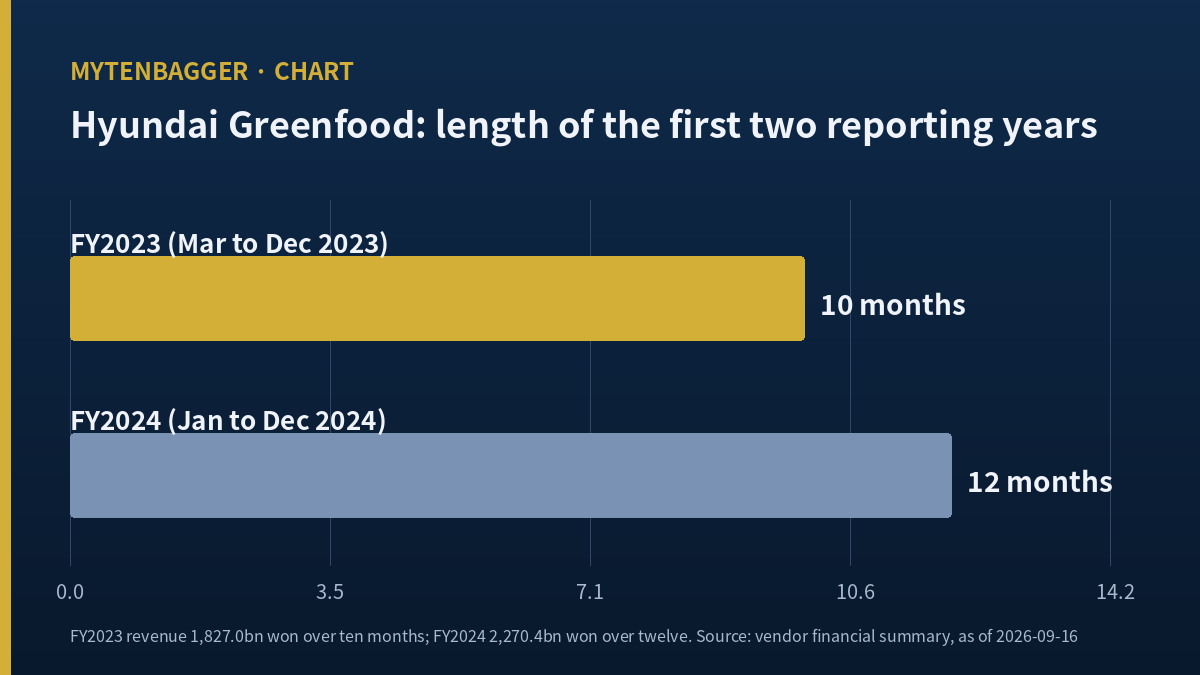
The first revenue column on this company’s financial summary covers ten months. Every column after it covers twelve. Hyundai Greenfood stock closed at 18,840 won on Friday, September 11, 2026, and the growth figure most often quoted about this business divides one of those columns by the other. I did that division myself before I noticed the lengths were different, and the number I got was wrong by more than twenty percentage points.

Hyundai Greenfood { close 18,840 won, Friday September 11, 2026 }

{ FY2023 revenue }        1,827.0 billion won, covering ten months
{ FY2024 revenue }        2,270.4 billion won, covering twelve months
{ headline growth }       24.27 percent
{ company restatement }   2,207.5 billion won for the same FY2023
{ growth on that base }   2.85 percent
{ the gap }               21.42 percentage points
Contents
Hyundai Greenfood stock sits on a first year that ran ten months
A word on the market first. This company trades on the KOSPI, the main board of the Korea Exchange in Seoul, under the code 453340. The KOSPI is Korea’s senior listing venue, roughly comparable in role to the New York Stock Exchange, and it runs alongside a junior board called the KOSDAQ where smaller and earlier stage companies list.
The business itself is contract catering and food distribution. It runs staff cafeterias for corporate and institutional clients, supplies those kitchens with ingredients, and operates restaurants and a care food line. As of the March 2026 disclosure, revenue splits into food service at 45.56 percent, ingredients at 25.97 percent, distribution at 15.53 percent, and other at 12.94 percent.
The two columns are not the same length
The company in its present form was incorporated on March 2, 2023 and listed on April 10 of that year. It was created by a demerger from what is now Hyundai GF Holdings, the group’s holding company. So its first reported fiscal year begins in March and ends in December. Ten months.
Korean press noted this at the time. Shinailbo, reporting the FY2024 results in February 2025, wrote plainly that the 2023 figures cover ten months and cannot be compared directly with a full year. That sentence is in the Korean coverage. It is not in the vendor screen I read the numbers from.
What the company published to close the gap
The same Korean report gives a restated base. On a standalone basis, adding back the January and February that the new entity did not exist for, FY2023 revenue becomes 2,207.5 billion won and operating profit becomes 88.6 billion won. Those are the company’s own adjusted figures, carried by the Korean press, and they are not the numbers on the financial summary screen.
I want to be careful about what that restatement is. It is a standalone figure, and the twelve-month columns I am comparing it against are consolidated. Mixing the two bases is itself a compromise, and I make it here because no consolidated restatement exists that I could find. That limitation stays with every growth number in the next section.
| Fiscal year | Revenue | Operating profit | Net profit | Operating margin |
| 2023 (ten months) | 1,827.0 | 64.8 | 39.3 | 3.55% |
| 2024 | 2,270.4 | 96.7 | 74.0 | 4.26% |
| 2025 | 2,329.6 | 106.8 | 87.2 | 4.58% |
Amounts in billions of Korean won, from the Hankyung financial summary. I checked each margin against its own row and all three hold: 64.8 over 1,827.0 gives 3.549 percent, 96.7 over 2,270.4 gives 4.258 percent, and 106.8 over 2,329.6 gives 4.584 percent. Operating margin is a ratio within a single period, so the ten-month problem does not touch it. Growth rates are a different matter.
Three growth numbers for one pair of years
Take FY2023 to FY2024 and ask how fast revenue grew. The answer depends entirely on what you put underneath.
- Headline, as printed. 2,270.4 over 1,827.0 gives 24.27 percent. This divides twelve months of revenue by ten months of revenue.
- On the company’s restated base. 2,270.4 over 2,207.5 gives 2.85 percent (my calculation).
- On a simple annualization. Scaling ten months to twelve gives 2,192.4 billion won, and 2,270.4 over that gives 3.56 percent (my calculation).
The distance between the first and the second is 21.42 percentage points. Operating profit behaves the same way and worse. The printed comparison is 96.7 over 64.8, or 49.09 percent. On the restated base it is 96.7 over 88.6, or 9.12 percent. On a simple annualization it is 96.7 over 77.8, or 24.25 percent. Three numbers, one pair of years, and I have seen all three quoted somewhere.
Earnings per share carries the same distortion. The screen shows 1,160 won for FY2023 and 2,190 won for FY2024, which reads as 88.79 percent growth. Scale the first to a full year and it becomes 1,392 won, and the growth becomes 57.33 percent. I am not claiming the adjusted version is the true one. I am claiming that a reader who takes the printed one at face value is reading a number with two months missing from underneath it.
Which of the three do I use
I use the second, the company’s own restatement, and I say so every time I quote it. The third is arithmetically clean but assumes the missing January and February look like the average of the other ten, which in a catering business with an academic and corporate calendar is a poor assumption. The first I do not use at all, and the reason this piece exists is that it is the one printed in the largest type.
Hyundai Greenfood stock already has half of 2026 on the board
Both quarters of the current year are reported, and both are full-length, so this part needs no adjusting.
First quarter, reported May 6, 2026: consolidated revenue of 621.5 billion won, up 8.9 percent, and operating profit of 46.4 billion won, up 43.9 percent. That is an operating margin of 7.47 percent by my calculation, and Korean coverage described it as the highest quarterly margin the company has posted.
Second quarter, reported August 4, 2026 by Asia Today and other Korean outlets: revenue of 595.0 billion won, up 7.8 percent, operating profit of 38.1 billion won, up 23.4 percent, and net profit of 30.6 billion won, up 30.7 percent. Margin of 6.40 percent by my calculation, below the first quarter.
Put the two together and the half year gives 1,216.5 billion won of revenue and 84.5 billion won of operating profit. Against the full year 2025, revenue is 52.22 percent of the way there and operating profit is 79.12 percent of the way there (both my calculation). Half the revenue has produced nearly four fifths of last year’s profit. That is the single most interesting number I found about the current year, and it says nothing about whether the second half repeats it.
The first quarter by segment
The sell-side note I read breaks the first quarter into contract catering at 269.0 billion won, up 8.1 percent, food ingredient distribution at 161.4 billion won, up 13.3 percent, and restaurants at 62.3 billion won. Those three sum to 492.7 billion won, which leaves 128.8 billion won of the consolidated 621.5 unaccounted for in that breakdown. I did not find what fills the difference, so I use the segment directions and leave the segment amounts out of any argument. The overseas catering operation, reported separately, contributed 15.8 billion won in the second quarter and 30.0 billion won across the half year.
One more split is worth pulling apart. The first quarter was reported on two bases: standalone revenue of 606.0 billion won with 43.0 billion won of operating profit, up 55.8 percent, and consolidated revenue of 621.5 billion won with 46.4 billion won. The difference between the two is 15.5 billion won of revenue carrying 3.4 billion won of operating profit, which works out to a 21.94 percent margin (my calculation) against the 7.47 percent the consolidated whole earned. Whatever sits outside the parent entity is converting revenue into profit at roughly three times the rate of the core, on a base small enough that it moves the consolidated margin by very little. I could not identify the composition of that gap from public disclosure, so I note the ratio and build nothing on it.
A company that reports revenue by segment without a matching profit line is a pattern I have written about before. I went through the same problem at a Korean noodle maker that publishes seven revenue lines and one profit line.
Hyundai Greenfood stock is followed by exactly two houses
The consensus panel on the Korean vendor screen, as of the September 11, 2026 close, shows two contributing houses, a rating score of 4.00 out of five, a consensus valuation of 26,000 won, a forward earnings estimate of 3,360 won per share, and a forward multiple of 5.61 times. I checked the last one: 18,840 divided by 3,360 gives 5.607.
I could identify one of the two. IBK Investment and Securities, analyst Nam Sung-hyun, published a first quarter review dated May 7, 2026, kept a buy rating, and left the valuation unchanged at 25,000 won. The note carries full-year 2026 estimates of 2,470.0 billion won in revenue, 136.0 billion won in operating profit, 110.0 billion won in net profit, and 3,374 won per share.
The units in that table were printed in a way I had to solve backwards. Multiplying the 3,374 won per share estimate by the share count printed on the same screen gives 109.6 billion won, which matches the 110.0 net profit line only if the table is in billions. So billions it is. I derived that unit; the table did not state it.
With one of two houses identified, the other falls out by subtraction. If the consensus is a simple average, the unidentified house carries a valuation of 27,000 won and a per-share estimate of 3,346 won. Two assumptions sit under that: that the average is unweighted, and that the figures I read for the first house are accurate. Both are stated at the top of my counter-case below, because the whole derivation collapses if either fails.
One more ratio worth holding. The forward per-share estimate of 3,360 won is 1.266 times the trailing figure of 2,654 won. That is the growth the two houses together are asking the second half and next year to deliver, and it is a good deal more modest than the half-year profit run rate would imply.
Set that estimate against the half year already reported and the arithmetic gets pointed. The identified house looks for 136.0 billion won of operating profit across the full year. The first two quarters have delivered 84.5 billion won. That leaves 51.5 billion won for the second half, which is 60.95 percent of what the first half produced (my calculation).
Put it another way. If the company simply repeats its second quarter twice, adding 76.2 billion won, the year lands at 160.7 billion won and overshoots the estimate by 24.7 billion won. I do not read that as the house being wrong. Catering revenue is seasonal, the fourth quarter carries holiday closures at client sites, and an estimate published in May had only one quarter of the year in hand. But it does mean the published number is asking for a visible slowdown, and the third quarter report is where that request either holds or breaks.
The consensus per-share figure lines up with the same scale. Multiplying 3,360 won by the shares outstanding gives 109.1 billion won of net profit, close to the 110.0 the identified house carries, which tells me the two panels are not far apart on the bottom line even though I cannot see the second one directly.
Two covering houses is thin. I have looked at the opposite extreme of the same problem, a Korean food company where nobody had updated an estimate in three months, and the lesson there applies here: a consensus built from a very small panel moves in steps; it does not slope.
One American operator, indexed to this one
For a US-listed comparison I took Aramark (NYSE: ARMK), which runs food service for corporations, schools, hospitals, and stadiums. It is the closest listed analogue in the American market to what this Korean company does, and it closed on the same Friday, September 11, 2026, at 58.55 dollars, up 3.15 percent on the day, according to StockAnalysis. Market value 15.44 billion dollars on 263.63 million shares, trailing earnings of 1.43 dollars per share for a multiple of 40.95, trailing revenue of 19.85 billion dollars, and trailing net profit of 382.91 million dollars.
Indexed to one
Instead of a side-by-side table, I set the Korean company at 1.00 on every line and asked what the American one measures against it. Converting at 1,341.59 won per dollar, the Friday rate.
                        Hyundai Greenfood      Aramark
  revenue                     1.00              11.43
  net profit                  1.00               5.89
  net margin                  1.00               0.52
  market value                1.00              33.86
  trailing multiple           1.00               5.73
Read down the column and the last line does not follow from the ones above it. The American operator sells 11.43 times as much, earns 5.89 times as much, and converts revenue into profit at roughly half the rate, yet the market carries it at 33.86 times the value. In absolute terms the net margins are 1.93 percent against 3.74 percent, both my calculation from the trailing figures above.
I am not presenting that as a mispricing. Growth expectations, market depth, index membership, and the currency all sit between those two columns, and none of them appear in my five lines. What I take from it is narrower: the Korean company’s profitability per unit of revenue is the better of the two, and that fact is doing very little work in how it is valued.
The Korean market tends to price food service companies on a thin margin line that the whole industry shares. I wrote about that pattern at a Korean food distributor whose margin failed the same industry screen.
What I left out of Hyundai Greenfood stock this time
The return on equity column
The financial summary carries a return figure for each of the three years, and I dropped the column entirely from the table above. The reason is that the 2023 entry divides ten months of profit by a full balance sheet, so it understates by construction, and correcting it would require me to state an adjusted profit figure I have not independently checked. The cost of dropping it is real: a reader cannot see from my table how much of the margin improvement reached shareholders.
I also left out the balance sheet entirely, along with book value per share and the price to book ratio. Those belong to a separate argument about this company that I made elsewhere and did not want to compress into a paragraph here.
Two more. The share count history, which includes four cancellations since 2025, does not appear because none of my per-share figures in this piece span a period where it moved enough to matter. And the fifty-two week range for the American comparison is on the screen I cited but plays no part in my reasoning, so I left it there.
Hyundai Greenfood stock: four things that cut against me
- The derivation of the second house rests on two assumptions. An unweighted consensus average, and accurate figures for the house I did identify. If the vendor weights contributors, or if the note I read was superseded, then the 27,000 won and the 3,346 won are both fiction.
- My restated base mixes two accounting bases. The 2,207.5 billion won restatement is standalone and everything I compare it against is consolidated. The 2.85 percent I quote most often is therefore an approximation, and a careful reader should treat the 3.56 percent annualization as the honest bracket on the other side.
- Trailing earnings per share has two published versions. The Hankyung summary shows 2,654 won for 2025 and the vendor screen shows 2,635 won. The difference is small, but my 1.266 ratio uses the first, and the forward multiple of 5.61 on the same screen uses the second.
- None of this is new information. The ten-month fact was published by the Korean press in February 2025 and by the company before that. What I did was divide, and then divide again with a different number underneath. Anyone with the same two screens reaches the same place.
Prices and multiples reflect the Friday, September 11, 2026 close as checked at the time of writing. Dollar conversions are approximate, at about 1,341.59 won per dollar on that date. Korean won is the reference currency throughout, and the dollar figures for the US comparison are quoted as published in dollars.
Related reading