LS Marine Solution Stock: Revenue Tripled and Margin Fell
The first figure I found about this company, I threw away.
It was a construction-scope estimate for Korea’s planned west-coast HVDC transmission corridor, and a Korean outlet put it at 3.3 trillion won. The same article showed its own method: take the total project budget of 122 trillion won, apply a 54% share, then apply a 50% laying-and-installation share. I did that multiplication. It gives 32.94 trillion won, which is roughly ten times the figure the same article printed. I could not tell which of the two numbers lost a digit, so this company gets taken apart below without either of them.
That is the spirit of what follows. This is a KOSDAQ-listed marine and underground cable installation contractor, majority owned by LS Cable, and it is a company where the printed figures and the figures you get by rebuilding them keep failing to meet. KOSDAQ is Korea’s junior board, the smaller of the two main venues alongside KOSPI, and it closes at 15:30 Korea time. All prices and multiples below are the September 11, 2026 (Friday) close, which was the most recent trading session when I sat down on September 14, 2026 (Monday).
01. Close ............ 32,300 won (September 11, 2026, Friday)
02. Revenue 2023 ..... 70.78 bn won  ->  2025: 244.21 bn won
03. Operating margin . 18.49% (2023)  ->  2.87% (2025)  ->  6.95% (1H26)
04. Trailing multiple  164.36x   Forward: 61.47x   Sector: 23.58x
05. Backlog .......... about 660 bn won (as of August 5, 2026, Wednesday)
06. My position ...... none, no order placed, watching
Contents
LS Marine Solution stock sits on a revenue line and a margin line
Four annual figures, pulled from the company summary page on Alphasquare. I did not find a second source printing the same four years, so these are one vendor’s numbers and I say so here instead of burying it in the caveats. Korean won is the reference currency throughout this piece; dollar figures appear only as a convenience for readers who price things that way.
| Year | Revenue (bn won) | Operating profit (bn won) | Operating margin |
|---|---|---|---|
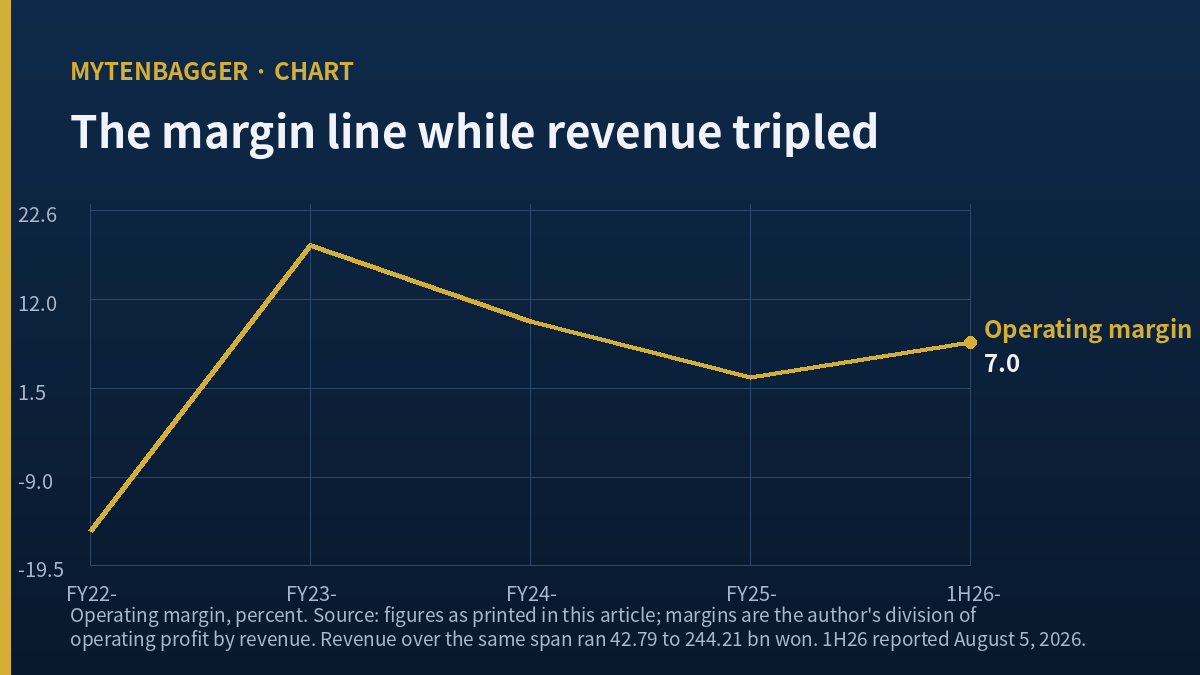
| 2022 | 42.79 | -6.61 | -15.44% |
| 2023 | 70.78 | 13.09 | 18.49% |
| 2024 | 130.28 | 12.39 | 9.51% |
| 2025 | 244.21 | 7.01 | 2.87% |
Every margin figure in that last column is mine, obtained by dividing the middle column by the left one. Read the revenue column alone and this is a company compounding hard. Revenue in 2025 was 245.02% above 2023. Read the operating profit column alone and 2025 came in 46.44% below 2023, on a business more than three times the size. I have owned companies where those two columns pointed the same way and I found it much easier to hold them.
In dollars, at 1,341.59 won per dollar on September 11, 2026 (Friday), the 2025 revenue line is roughly $182.0 million. This is a small company doing large-infrastructure work.

What the operating margin did while revenue climbed
The sequence is 18.49, then 9.51, then 2.87. The first step is close to a halving. The second is steeper than that, taking roughly seventy percent off what was left. Then the first half of 2026 arrives and the number turns back up.
On August 5, 2026 (Wednesday) the company reported first-half revenue of 148.2 billion won, operating profit of 10.3 billion won and net profit of 13.1 billion won, which it described as a record half on all three lines. Korean coverage of the release reported year-on-year growth of about 33%, about 61% and about 217% respectively. Those growth figures are rounded in the reporting I could reach, so I have not used them to back out a prior-year base; I would rather carry three exact half-year numbers than six approximate ones.
Two things fall out of that half. First, the operating margin was 6.95%, better than double the full-year 2025 figure. Second, the half-year operating profit of 10.3 billion won was 1.4695 times the whole of 2025. The margin line has begun climbing back toward where it stood before the revenue surge, and that is the single most important fact in this piece.
Why a builder’s margin can fall while its revenue triples
I want to be careful here because this is reasoning and not reporting. Installation contractors book revenue as projects progress, and the mix of projects in any given year decides the margin. A year loaded with newly won work carries setup cost, vessel time and subcontracting before the profitable phases arrive. A year that harvests mature projects looks the opposite. I have not seen a project-level margin disclosure from this company, so I cannot tell you which of those two descriptions fits 2025. What I can tell you is that both the fall and the partial recovery are consistent with a mix effect and neither requires a story about competitive damage.
LS Marine Solution stock earns a multiple the sector does not
At the September 11, 2026 (Friday) close of 32,300 won, the company screen at Wisereport prints a trailing earnings multiple of 164.36 times on earnings per share of 197 won. The same screen puts the sector average at 23.58 times. That is 6.97 times the sector figure, by my division.
I have looked at expensive Korean industrials before and I usually find the multiple resting on something identifiable. Here it rests on the figure underneath being very small. Earnings per share of 197 won against a 32,300 won share price is what a 2.87% operating margin produces when it reaches the bottom line. Nothing about the multiple is mysterious once the margin table is in front of you, which is why I put the margin table first.
Two vendor screens do not agree on the earnings figure
Alphasquare shows the same closing price with earnings per share of 182.4414 won and a multiple of 164.16 times. Divide that price by that earnings figure and you get 177.04 times, so that screen does not rebuild from its own inputs. The Wisereport pair does: 32,300 divided by 197 is 163.96, close enough to 164.36 that rounding of the earnings figure to a whole won explains the gap. I have used the Wisereport pair throughout and left the other one out of the argument.
LS Marine Solution stock and the estimate that needs a record year
The Wisereport consensus box carries two contributing houses, an average analyst stance score of 4.00, a 2026 earnings estimate of 525 won per share and a forward multiple of 61.47 times. Set the forward figure beside the sector average and the gap is 37.89 multiple points. Set the 2026 estimate beside the trailing 197 won and the estimate is 166.50% higher.
That is the part I keep returning to. The forward multiple only becomes 61.47 times if per-share earnings roughly reach 525 won, and 525 won is above any per-share figure this company has produced in a full year. The strongest operating profit in my table belongs to 2023, and it was earned on a revenue base under a third of the current one. So the estimate is not asking for growth off a trend; it is asking for the margin line to travel back up while the revenue line keeps going.
The first half of 2026 is evidence that the travel has started. It is one half, and half-years in installation work are not evenly weighted.
Why I am not reverse-engineering the unnamed houses
I know the average of the two named valuations I found, and I know the screen consensus, and the two do not match. I could build a third figure out of that mismatch. I have done exactly that in recent pieces and I am deliberately not doing it here, because a number derived from two assumptions I cannot check adds precision without adding knowledge. The honest statement is that I verified two houses and the screen counts two, and I cannot confirm they are the same two.
The backlog, and the contract that left it
The August 5, 2026 (Wednesday) release put the order backlog at about 660 billion won, which is 2.7026 times the 2025 revenue line. In dollars that is roughly $492 million of contracted work against roughly $182.0 million of annual revenue. On backlog alone this is a company with visible work ahead of it.
Against that, on April 27, 2026 (Monday) the company and its parent disclosed the termination of supply and installation contracts for the Anma offshore wind project, a combined 271.1 billion won of which 94.0 billion won belonged to this company. Korean reporting attributed the termination to the project developer’s funding position, and the company said it would revisit cooperation if the project restarts. The lost portion is 38.49% of a full year of 2025 revenue and 14.24% of the backlog figure quoted above, by my division, and roughly $70.1 million.
There is a complication I could not resolve. A September 9, 2026 (Wednesday) Korean trade piece lists Anma among the projects where the group holds preferred-bidder standing. I do not know what happened between April and September, and I have not seen a filing that reconciles the two. I am recording both and drawing no conclusion from either.
What sits behind the backlog
The demand story is offshore wind and long-distance transmission. The company is described in Korean trade press as the only domestic operator able to both produce and install 500kV HVDC submarine cable, and the projects named around it include Sinan Ui, Taean and the west-coast transmission corridor. I linked the demand question in a separate piece on the tower side of offshore wind, where the buyer’s incentive cliff mattered more than the pipeline did: the CS Wind entry covers that. A pipeline is not an order, and an order is not a margin.
LS Marine Solution stock measured against a Norwegian installer
For a comparison I wanted a company that sells the same verb. Cable manufacturers are the obvious peer group and they are the wrong one, because this company does not make the cable; its parent does. It lays the cable. Subsea 7, listed in Oslo, is a marine installation contractor whose business is putting other people’s hardware on the seabed, and that is a closer match to the verb than any cable maker would be.
Three comparisons, expressed only as ratios. The exact inputs are in the note below this section so the reader can check my division.
- Trailing earnings multiple: the Korean company trades at 9.92 times the Norwegian company’s figure.
- Forward earnings multiple: the same comparison narrows to 4.63 times.
- Net margin: the Norwegian company’s last twelve months came in above the Korean company’s 2025 result, and not by a small amount.
The narrowing from 9.92 to 4.63 is the whole forward case in one line. It is also entirely dependent on an estimate, while the 9.92 rests on reported figures.
Note on inputs. Subsea 7 figures are from Stockanalysis as displayed when I checked: 338.00 Norwegian kroner, trailing multiple 16.57 times, forward 13.28 times, trailing earnings 20.40 kroner per share, revenue 74.47 billion kroner, net income 6.07 billion kroner, 296.15 million shares, one-year range 180.10 to 358.20. Two checks close exactly: 338.00 divided by 20.40 gives 16.57, and 296.15 million shares at 338.00 gives the 100.10 billion kroner market value the page prints. Net margin of 8.15% is mine. The quote carried an August 21, 2026 (Friday) timestamp, twenty-one days before the Korean close used everywhere else in this piece, and a ratio built across two different dates is weaker than one built on a single afternoon. I am saying so instead of hiding it. Source: Stockanalysis, Subsea 7.
Where two Korean brokers put their numbers
LS Securities moved its number from 41,000 won to 51,000 won between April 28, 2026 (Tuesday) and May 26, 2026 (Tuesday), a 24.39% step, with the analyst Sung Jong-hwa keeping a buy stance. Kyobo Securities had been at 40,000 won on March 17, 2026 (Tuesday). The screen consensus on September 11, 2026 (Friday) reads 43,000 won. The average of the two named figures is 45,500 won, so the screen is not simply averaging the pair I found.
Two observations, both of which I hold loosely.
The first is chronology. The same LS Securities analyst published an issue brief on the Anma contract termination dated April 28, 2026 (Tuesday), which is the same day as the lower of the two numbers. Twenty-eight days later the number went up by roughly a quarter. I am not claiming that is improper; a terminated contract and a raised valuation can both be right if the pipeline outside that contract improved. I am saying the sequence is unusual enough to note.
The second is affiliation. LS Securities took its present name in June 2024, when the former eBest Investment and Securities was rebranded after joining the LS group, and this company’s majority owner LS Cable belongs to the same group. I have not read either firm’s research independence policy, so I record this as a caution and not as evidence. The Kyobo number is unaffiliated and is the lower of the two.
Where the price sits against all of it
The one-year price range runs from 21,650 won to 51,600 won. The September 11, 2026 (Friday) close of 32,300 won is 37.40% below the top of that range and 49.19% above the bottom, both by my division from the same close printed everywhere in this piece. It is also 24.88% below the screen consensus and 36.67% below the higher of the two named valuations.
Seventeen things that cut into my reading of LS Marine Solution stock
- Every margin percentage here is mine. The vendor screens print revenue and profit; they do not print the ratio I built from them.
- Four annual figures is a short series for a contractor, and 2022 was a loss year, so the base I am measuring from is unusual.
- The first-half 2026 growth rates I quote are rounded in the reporting I could reach, which is why I refused to back out a prior-year base from them.
- A single strong half does not establish that a margin has turned. Installation work is lumpy by quarter.
- The 525 won estimate comes from a consensus box with two contributors. Two is thin.
- I could not open the primary research from either named house; I worked from Korean summary pages.
- The 43,000 won screen consensus and the 45,500 won average of my two named figures do not agree, and I do not know why.
- The chronology point about the April and May valuations is an observation about timing and says nothing about method. I have no visibility into either model.
- The affiliation point is a disclosure and I do not treat it as a finding. Affiliated research can be perfectly good research.
- Backlog is a contracted figure and not yet a booked one, and the Anma termination is direct evidence that contracted work can leave.
- I could not reconcile the April termination with the September preferred-bidder listing.
- The Subsea 7 quote is twenty-one days older than everything else here, which weakens both peer ratios.
- Subsea 7 is a far larger company in a partly different end market. The shared verb does not make the two businesses comparable in economics.
- I discarded the transmission-corridor scope figure because its own stated method contradicts it. Discarding it also removed the largest demand number available, which flatters caution.
- The sector multiple of 23.58 times is a screen aggregate over a construction classification that includes very different businesses.
- Nothing here touches the balance sheet, the funding history or who paid for the growth. That is a real hole and I know it.
- Finally, against myself: none of this is new information. Every figure above was already printed on a public screen or in a public filing summary. What I did was divide, and division is not research.

LS Marine Solution stock is not in my account
I hold none of it. No order has been placed and none is pending as I write on September 14, 2026 (Monday). I am watching.
My reason for staying out is the same reason I find the company interesting. The entire forward case is a claim about one ratio, and that ratio has moved in the wrong direction in two of the last three reported years. I have one half-year of movement in the right direction. One half is a data point; two consecutive halves would be a direction.
So my threshold is this: two consecutive reported periods in which operating margin holds above the 2024 figure of 9.51%. Not a record margin, not the 18.49% of 2023, just a return above the middle of its own range and then a hold. If that happens, the 525 won estimate stops being a leap and becomes an extrapolation, and I will run the arithmetic again with a very different attitude.
I should state the case against my own threshold too. Two periods is roughly a year, and in a contractor with visible backlog a year is long enough for the entire opportunity to be repriced before my condition is met. I accept that cost. I have paid the opposite cost often enough, buying a margin recovery that was one favorable mix of projects and nothing more.
A related piece where a margin carried the whole argument
I built a similar case earlier on a marine services company whose published targets implied a margin it had never disclosed, and the arithmetic there landed closer to the reported figure than I expected: that entry is here. The method is the same one I used above, which is to take the number a company or a consensus is asking you to believe and ask what has to be true underneath it.
LS Marine Solution stock and the document that would settle this
If someone wants to show me I am wrong, here is the order I would open things in.
- The segment margin disclosure in the 2026 half-year report. If the recovery to 6.95% came from a single project’s completion phase, my threshold is measuring noise and the sentence about a margin line turning up goes first.
- A filing that resolves the Anma status. If the work returned under a new contract, the 94.0 billion won I subtracted is back and the paragraph about contracted work leaving becomes much weaker.
- The identities of the two consensus contributors. If they are the two houses I named, the 43,000 won figure and my 45,500 won average must be reconciled, and one of them is stale.
- A current Subsea 7 quote. Twenty-one days of price movement could move the 9.92 and 4.63 ratios enough that the narrowing I described changes size.
The thing that survives all four is the margin table itself, because it comes from four completed fiscal years that were audited and will not be rewritten to suit me. That is the floor this piece stands on, and it is deliberately the least interesting part of it.
Prices and multiples reflect the September 11, 2026 (Friday) Korean close as displayed at the time of writing. This piece may publish on a later date, so the figures can differ from live quotes. Dollar conversions are approximate, at about 1,341.59 won per dollar on that same date, taken from Investing.com; Korean won is the reference currency throughout and every conversion here is a convenience, not a measurement. Anything marked as my division or my calculation is something I produced from public screens and is not a figure any company or institution published.
Company indicators and the consensus box come from the Wisereport company screen; the first-half 2026 results and backlog come from ZDNet Korea’s August 5, 2026 (Wednesday) report; the LS Securities valuation change is from a Newspim report brief. These are Korean-language sources and the wording above is my summary of them, not a translation offered as quotation.