Hyundai Wia Stock Has Not Reached Its Own Book Value
Over the trailing twelve months, Hyundai Wia stock has not met its own book value on a single day. That is not a statement about how cheap I think the shares are. It is an arithmetic fact about the span, and it is the reason I spent an evening on a company I do not own.
Here is the span. The highest price in the trailing year was 112,600 won. The book value per share printed on the vendor screen I use is 135,750 won. Divide the first by the second and you get 0.8295 by my calculation. The best day of the year still landed below the accounting value of one share. As of the September 11, 2026 close, the last Korean trading session before I wrote this, the price was 57,400 won, which is 0.42284 times that same book figure.
I have looked at plenty of Korean industrials below book. What made me stop here is that the shares never came close during a period when the equity on the balance sheet was growing, not shrinking. So this piece is about one ratio and the accounts underneath it. The earnings side of this company is a separate argument and I have written it separately in Korean.
B. Trailing-year high 112,600 won against the same book figure: 0.8295 times.
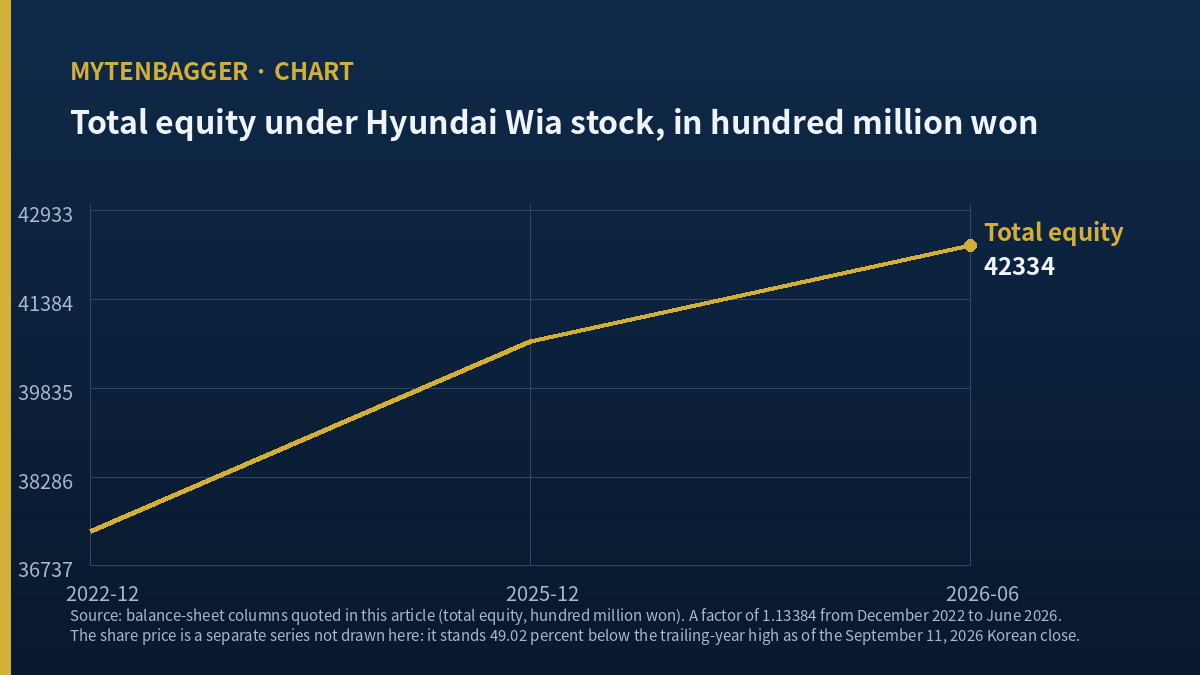
C. Total equity grew from 37,336.5 to 42,333.8 hundred million won between December 2022 and June 2026.
D. The debt-to-equity ratio fell from 102.13 percent to 73.50 percent over the same span.
E. Three different book values per share come out of the same filings, from 132,768.1 to 155,667.1 won.
F. Position: none held, no order placed, watching. Conditions are at the end.
Contents
Hyundai Wia stock has not reached its own book value
Let me put the two divisions next to each other, because the whole piece rests on them.
| Item | Value | Source |
|---|---|---|
| Close, September 11, 2026 | 57,400 won (about 42.79 dollars) | Vendor screen |
| Book value per share | 135,750 won (about 101.19 dollars) | Vendor screen |
| Trailing-year high | 112,600 won (about 83.93 dollars) | Vendor screen |
| Price divided by book | 0.42284 times | By my calculation |
| Trailing-year high divided by book | 0.8295 times | By my calculation |
| Price below the trailing-year high | 49.02 percent | By my calculation |
Prices and ratios reflect the September 11, 2026 Korean close as I checked them at the time of writing. Dollar figures are approximate, converted at roughly 1,341.59 won per dollar on that same date. Korean won is the reference currency throughout.
The 0.8295 figure is the one I keep returning to. A stock can sit below book because the market doubts the assets, and that happens often in Korean heavy industry. What is less common is a full year in which the top of the range never tested that line. If I had bought at the single highest price of the year, I would still have paid less than the accounting value of a share. That tells me the discount is not a recent event triggered by one quarter. It is the standing condition of this listing over the whole span I can see.
I want to be careful about what this does and does not mean. Book value is an accounting output, not a liquidation estimate. A machining and powertrain business carries plant and equipment measured at cost less depreciation, and nobody has offered to buy those assets at that measurement. So the sentence I am willing to defend is narrow: the market has priced these assets below their carried measurement for a year without interruption.
Three book values per share behind Hyundai Wia stock, and none of them agree
Before leaning on 135,750 won I tried to rebuild it from the filings. I could not land on it exactly, and the spread is wide enough that I have to show my work instead of hiding it.
The balance sheet, as published by the Korean data service Valueline, gives these figures in hundred millions of won.
| Period | Total assets | Total liabilities | Total equity | Owners of the parent |
|---|---|---|---|---|
| December 2022 | 75,464.5 | 38,128.0 | 37,336.5 | 33,190.7 |
| December 2025 | 70,251.0 | 29,596.7 | 40,654.2 | 36,106.4 |
| June 2026 | 73,451.3 | 31,117.5 | 42,333.8 | 37,226.4 |
Which equity figure goes under the ratio
Shares outstanding are 27,195,083. Run the division three ways and three answers come out. Owners-of-the-parent equity at June 2026 gives 136,886.5 won. The same line at December 2025 gives 132,768.1 won. Total equity including minority interests at June 2026 gives 155,667.1 won. The screen prints 135,750 won, which sits 0.837 percent below the June owners figure and nowhere near the total-equity figure.
So the screen is building its per-share book from equity attributable to owners of the parent, and it is using a period or a share count I have not pinned down. A second vendor screen disagrees more loudly: it prints a book multiple of 0.56 and an implied per-share book of 101,824.92 won, which matches neither of my three divisions. I set that second screen aside for this piece.
None of this moves the headline. Whichever of the three divisions you prefer, the trailing-year high of 112,600 won stays below it. Against 132,768.1 won the high is 0.8481 times; against 155,667.1 won it is 0.7233 times. The conclusion survives the ambiguity, which is the only reason I am willing to publish a ratio I could not reproduce to the won.
The equity under Hyundai Wia stock thickened while the price halved
Here is the part that made the ratio interesting instead of merely low. Between December 2022 and June 2026 total equity went from 37,336.5 to 42,333.8 hundred million won, a factor of 1.13384 by my calculation. Owners’ equity went from 33,190.7 to 37,226.4, a factor of 1.12159. Liabilities came down over the same span, and the debt-to-equity ratio walked down with them.
| Period | Debt to equity, screen | Rebuilt from the two columns |
|---|---|---|
| December 2022 | 102.13 percent | 102.12 percent |
| December 2023 | 81.21 percent | not recomputed |
| December 2024 | 75.70 percent | not recomputed |
| December 2025 | 72.78 percent | not recomputed |
| June 2026 | 73.50 percent | 73.51 percent |
The two periods I recomputed close to within 0.01 percentage point of the printed figure, which I read as a rounding gap. Assets minus liabilities equals total equity exactly in the December 2022 and June 2026 rows above, and misses by 0.1 in the December 2025 row, which I read as rounding in the published columns.
Set that against the price. The shares are 49.02 percent below their trailing-year high. So over the span I can observe, the accounting value of the company went up by roughly a tenth while the market value of the company went down by roughly half. That divergence is the entire content of this piece. I am not claiming it is a mispricing. I am claiming that the two series moved in opposite directions and that anyone forming a view here has to explain why.
There are honest explanations on the other side. Equity can thicken through retained earnings that the market expects to stop. Carried plant can be worth less than its carrying measurement if the products it makes are being designed out. A parts maker inside a single automotive group carries concentration that a balance sheet does not price. One more event sits on top: the group has been moving this company’s defense operation to an affiliate, and a completed transfer would put a disposal result through equity once and then remove that operation’s contribution afterward. I have not seen a filing that fixes the amount or the timing, so I leave it as a pending change to the very line this piece measures.
A fifty-fifty partner of Hyundai Wia stock, measured the same way
For a comparison I went to Magna International, which trades on the NYSE and in Toronto. I did not pick it because it is the closest business match. I picked it because the two companies jointly own Wia Magna Powertrain, each holding half of it. They are partners in a single legal entity, which means at least one management team at each company has agreed the other is a competent operator of the same kind of assets.
A peer table, and the habit I found in mine
A peer table was the thing I had to rebuild here, and the rebuilding is what I learned from. For years I copied the book multiple each vendor screen printed and set those numbers side by side, as though a ratio with the same name were the same ratio. It is not. Magna’s own statistics page prints a book multiple of 1.45, and 17.54 billion dollars of market value divided by 12.11 billion dollars of total equity gives 1.4484, so that printed ratio is built on total equity. The same page prints book value per share of 43.98 dollars, and 12.11 billion divided by 265.45 million shares gives 45.62 dollars, so the per-share figure is built on a smaller equity base of about 11.674 billion dollars. One page, two equity bases. I had been comparing across that seam without noticing it for a long time. Now I do one division myself and apply it to both sides before I write anything down.
So here is the comparison done twice, which is the honest way to present it.
| Comparison | Hyundai Wia | Magna International | Ratio |
|---|---|---|---|
| Book multiple as printed on each page | 0.42 | 1.45 | 3.4524 times |
| Price divided by printed book per share | 0.42284 | 1.50364 | 3.5560 times |
Two methods, two answers, and the gap between the answers is larger than it looks because the second row is the only one where both sides went through the same division. Magna closed at 66.13 dollars on September 11, 2026 with a trailing-year range of 43.11 to 73.22 dollars. On the consistent method, the American-listed partner carries a book multiple 3.5560 times the Korean one. On the printed method it is 3.4524 times. I am reporting both because a reader who checks my work against the two vendor pages will find the printed numbers, and I would rather explain the seam than paper over it.
What I will not do is convert that 3.5560 into a fair value for the Korean shares. The two companies differ in scale, customer breadth, currency of earnings, and governance. A multiple gap between a diversified global supplier and a single-group Korean subsidiary is expected. The comparison tells me the discount is real relative to a partner that knows the assets, and it stops there.
What Hyundai Wia stock does, and where it is listed
The company was founded in March 1976 and listed in February 2011. It makes powertrain and chassis components, modules, and driveline parts, with a smaller machine-tool and defense line alongside. The great majority of revenue comes from the automotive-parts side according to the company’s own segment disclosure. Its largest shareholder group is Hyundai Motor and four related parties, and it is consolidated into the wider Hyundai Motor Group. It also holds subsidiaries and affiliates including the half-owned powertrain venture noted above, a 40 percent stake in a specialty-steel affiliate, and small stakes in a group resort operator and a transmission maker.
The listing is KOSPI, the senior board of the Korea Exchange in Seoul, which is the larger of the two Korean boards and the one that carries the country’s major industrial names. KOSPI trades from 09:00 to 15:30 Korea time, which for a reader on US Eastern time means the session closes in the small hours before the American open. Every price in this piece is a KOSPI closing price in won.
The company is also pushing into vehicle thermal management, and it showed an integrated thermal module, a cooling module, and a slim climate unit at the start of 2026, with a stated ambition running to 2032. That effort matters to the earnings line more than to the balance sheet, which is why it belongs in the Korean piece and not in this one. The thermal-management landscape around it has already shifted once through ownership, a change I traced in the piece where a Korean tire maker reported group profit below the profit assigned to its own owners. That article took the gap between consolidated and owners’ results as its subject; this one uses that same distinction only as plumbing under a single ratio.
Related reading: wrote about a sister parts company printing record results at 0.85 times book
My stance on Hyundai Wia stock and the conditions that would move it
I hold none of these shares and I have placed no order. The company sits outside the top hundred Korean listings by market value, where my standing rule is to observe instead of taking a position, and nothing here overrides that. Market value at the September 11 close was 15,610 hundred million won, about 1.164 billion dollars, which puts it well down the KOSPI list.
The two readings that would end my watching
The first is a published equity figure that breaks the pattern. If a subsequent balance sheet shows owners’ equity falling below the December 2025 level of 36,106.4 hundred million won, then the divergence I described has ended, and it ended on the accounting side and not on the price side. The interesting thing about this company right now is that both series are moving; if the equity series stops, there is nothing left to look at here that a screener could not tell me in a second.
The second is the defense transfer closing with a disclosed disposal result. That single event will push a one-time figure through equity and then remove an operation from every period afterward, which means the equity series I have been reading gets a discontinuity in the middle of it. I would want two reported periods on the far side of that break before I treated the trend as continuous again. One period after a structural change is a data point and not a direction.
Numbers I checked and left out
Writing down what I did not use is more useful to me later than writing down only what I did.
The second vendor screen, and the float
The second data service I checked prints a book multiple of 0.56 and a market value that does not come back out of its own posted price and the official share count. I excluded its ratio columns entirely instead of averaging them against the screen I did use, and that exclusion is itself a judgment I could be wrong about. Separately, the share register leaves a small block of shares unaccounted for between the sum of the named holders and the stated free float. Treasury holdings would explain it, and I could not confirm the amount in a filing, so no float percentage appears anywhere in my reasoning.
I also left out every earnings-side figure in this company: the half-year results, the operating margin, the consensus estimate, and the analyst valuations. Those carry the other half of the story and they are the subject of the Korean piece. A reader who wants the case about what this company earns will not find it here, and that is a gap in this article and not a gap in the record.
Nineteen items that cut against what I wrote
- Every ratio in this piece is my own division. The only figures I did not compute are the closing prices, the printed book value per share, the printed book multiples, and the balance-sheet columns. If any of those inputs is wrong or stale, every number I derived is wrong with it.
- I could not reproduce the printed book value per share of 135,750 won from the filings. My closest rebuild lands 0.837 percent away, and I do not know which period or share count closes that gap.
- Three defensible divisions produce book values per share from 132,768.1 to 155,667.1 won. I chose to lead with the printed figure, which is a choice.
- The trailing-year high of 112,600 won is a printed range value. I did not verify it against exchange data or identify the date it occurred.
- “Has not reached book value” covers only the trailing twelve months of range data I can see. The shares may well have traded above book before that window, and I did not check.
- Book value is an accounting measurement of carried assets. It is not an estimate of what those assets would fetch, and a machining business with heavy fixed plant is exactly where that distinction bites hardest.
- I did not examine the composition of the asset side at all. Receivables from group affiliates, inventory, and revalued land would each change how much weight the equity figure deserves.
- Equity growth of 1.13384 times over three and a half years is modest. Read as an annual rate it is unremarkable, and I presented it as a cumulative factor, which flatters it.
- I recomputed only two of the five debt-to-equity figures. The other three I took as printed.
- The minority-interest balance grew over the span as well, from 4,547.8 to 5,107.3 hundred million won between December 2025 and June 2026. Part of the equity thickening belongs to shareholders of subsidiaries and not to holders of this listing.
- I used a Korean data vendor for the balance sheet and did not cross-read it against the original filings in the exchange system.
- The defense transfer is unconfirmed as to amount, timing, and completion. Press reporting also described labor opposition as a live variable.
- A completed transfer would break the equity series I built my observation on, and I flagged that instead of adjusting for it, because I cannot size it.
- Magna is a much larger and more diversified company. Comparing book multiples across that difference is defensible only as a rough bearing, and the joint-venture link is a thin basis for peer selection however satisfying I find it.
- Magna’s own page carries two figures built on two different equity bases, which means I trusted its per-share book while distrusting its printed multiple. That is an inconsistent posture even if I explained it.
- I converted won to dollars at one rate on one date. Anyone reading later will find a different rate, and the dollar figures are approximate by construction.
- The business description here rests on the company’s own segment disclosure, which I did not audit, and I deliberately withheld the segment percentages because they belong to the other article.
- The brokerage and fund notes are general market structure, not advice about anyone’s account, and access arrangements change without notice.
- What I did in this piece was divide two published columns by a share count. That is arithmetic and it is not research. The hard questions here are about asset quality and group concentration, and I answered none of them.