Pharmicell Stock: One Forecast, a Third of the Peer Multiple
The share price has fallen 43.96% since the only forward earnings estimate I could find for this company was published. The estimate itself has not moved, because nobody has revisited it. So the forward earnings ratio implied by that pairing has fallen by the same 43.96%, and Pharmicell stock now sits near eleven times a number written in April by one house that declined to rate it.
That is the whole setup. A KOSPI-listed specialty chemicals maker, ticker 005690, closed at USD 8.06 on September 15, 2026, which values the entire company at roughly USD 484 million. The three companies I could find in the same supply chain, each covered by many more analysts than this one, trade above thirty-one times their own forward earnings.
April 17, 2026. Meritz Securities publishes a company brief with 2026 and 2027 earnings estimates. The reference price on the cover is KRW 19,380.
September 8, 2026. A Korean market data page records a consensus average valuation of KRW 24,000 for the name, alongside a price of KRW 10,620.
September 15, 2026. The shares close at USD 8.06. Nothing between the first date and this one has updated the earnings estimate that the forward multiple divides by.
Contents
Pharmicell Stock Rests on One Broker’s Arithmetic
I want to be precise about what exists and what does not. The Meritz Securities company brief, written by analyst Yang Seung-soo and dated April 17, 2026, carries a Not Rated label and no valuation figure. What it does carry is a forecast table: operating profit of KRW 56.2bn and net profit of KRW 57.6bn for 2026, then KRW 78.9bn and KRW 78.7bn for 2027. Earnings per share of KRW 960 and KRW 1,312. At the cover price of KRW 19,380 those work out to 20.1 times and 14.7 times.
I checked that table against itself before using any of it. Multiplying each earnings per share figure by the share count reproduces the net profit line on the same row, to the nearest tenth of a billion won. The 2025 column does the same thing against the audited result. So the estimate rows are internally coherent, which is the minimum I ask of a table before I divide anything by it.
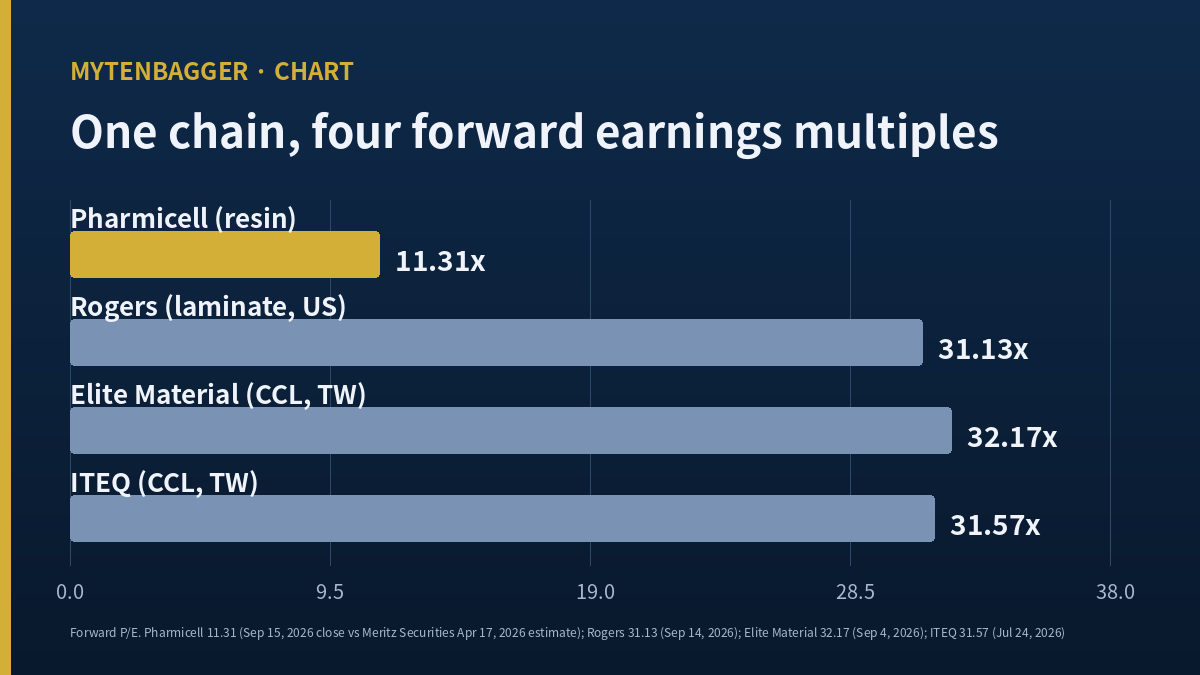
Today’s price against those two figures gives 11.31 times and 8.28 times. Both numbers are mine, produced by dividing the September 15 close by earnings per share that somebody else wrote down five months ago. I am not presenting them as a valuation. I am presenting them as the arithmetic consequence of a price that moved while an estimate stood still.
What the 2025 Earnings Base Actually Contains
Before forward figures mean anything, the trailing base has to be solid. Newspim reported the full-year 2025 results on February 9, 2026: revenue of KRW 114.0bn, operating profit of KRW 34.3bn, net profit of KRW 40.3bn. Growth of 75%, 637% and 536% against the prior year. Working backwards from those growth rates gives a 2024 base of roughly KRW 64.9bn of revenue, KRW 4.7bn of operating profit and KRW 6.3bn of net profit, which is exactly what the Meritz table prints for 2024. Two independent routes to the same three numbers is the kind of agreement I will build on.
Earnings per share of KRW 671 comes out of that KRW 40.3bn. Against the September 15 close that is 16.18 times trailing, and the figure on the company monitor screen I use agrees to two decimals.
The line where net profit overtakes pretax profit
Here is the part that made me slow down. The income statement screen puts 2025 pretax profit at KRW 34.76bn and net profit at KRW 40.28bn. Net is larger than pretax by KRW 5.52bn, which is 13.70% of the net figure. In an ordinary year tax takes a bite out of pretax profit and net comes in smaller. Here it went the other way.
The Meritz table points in the same direction without explaining it: net profit of KRW 40.3bn against operating profit of KRW 34.3bn, with financial income on the same screen far too small to close a gap of that size. So two sources agree that something below the operating line added to 2025 profit. I could not open the audited financial statement footnotes to say what it was, and I am not going to guess at a deferred tax asset just because the shape fits.
Why this matters for the ratio: the KRW 671 earnings per share that produces 16.18 times trailing includes that KRW 5.52bn. Strip it out and the trailing figure the market is dividing by shrinks by more than a tenth. I have seen a Korean chip substrate maker post a loss for reasons that had nothing to do with operations, and I wrote about a printed circuit board company whose annual results swung so hard that no single year worked as a base. The lesson from that piece applies here in reverse: a year that looks unusually good deserves the same suspicion as a year that looks unusually bad.
The 2026 half that has already reported
First-half 2026 results published on August 12, 2026 show revenue of KRW 75.6bn and operating profit of KRW 26.3bn, with the second quarter alone at KRW 38.9bn and KRW 13.2bn. Operating margin of 34.79% for the half and 33.93% for the quarter, against 30.09% for full-year 2025 and 7.24% for 2024.
That margin path is the strongest thing in this piece, and every figure in it is filed, not forecast. It also means the April estimate of KRW 56.2bn of operating profit for the full year is now half spoken for by reported numbers. Whether the remaining half arrives is the open question, and it is the same open question I keep running into with Korean names whose annual estimates lean on a back-loaded second half.
Pharmicell Stock Against Three Links in One Chain
Picking comparables for this company is awkward because it does not sit at the same point in the chain as anything obvious. It sells resin. The resin goes into copper clad laminate. The laminate becomes a board. The board goes into an accelerator rack. So instead of hunting for a look-alike, I took one company from each of three points along that path and asked one question of all three.
Rogers Corporation makes high-frequency laminate materials in the United States, closed at USD 132.00 on September 14, 2026, and carries a forward earnings multiple of 31.13. Elite Material makes copper clad laminate in Taiwan, closed at TWD 5,415.00 on September 4, 2026, and carries a forward earnings multiple of 32.17. ITEQ Corporation makes the same category of laminate in Taiwan, closed at TWD 309.50 on July 24, 2026, and carries a forward earnings multiple of 31.57.
Three companies, three different countries, three different as-of dates, and a spread of 1.04 between the highest and lowest of the three figures. The average of the three is 31.62. Against the 11.31 I computed above, that is 2.80 times. I had expected a wider dispersion when I started pulling these, and the fact that three firms at three points on the same chain land within about one point of each other is itself the finding: the market is pricing the whole path at one rate, and this company is the only address on it trading somewhere else entirely.
The trailing figures for the same three are far apart: 75.77, 84.73 and 75.86. The forward figures converge because each of the three is expected to grow into its price. That convergence is exactly why I used the forward column and not the trailing one, and it is also why the comparison is fragile, which is the next section.
Why That Forward Number Is Weaker Than It Looks
The 2.80 times gap is real arithmetic on top of unequal inputs, and I would rather say so plainly than let the number carry more weight than it earned.
On one side, three forward figures each assembled from many estimates by a data provider. On the other side, one forward figure lifted from a single Not Rated brief written five months ago by one analyst. Those are not the same kind of object. An average of many estimates and a single estimate can both be called forward, and the word hides the difference.
The as-of dates make it worse. One peer price is one day old, the second is eleven days old, the third is almost two months old. I could not find a route that would give me all four on the same date, so I printed the date next to each figure and left the mismatch visible.
I ran into a sharper version of this before. Two houses put a Korean semiconductor equipment maker’s 2026 earnings per share at figures that differed by 2.3 times, which is a useful reminder that a single estimate is not a narrow range, it is a sample of one. Here I do not even have the second estimate that would let me measure the spread. And when I sorted eight chip equipment makers by forward multiple and by return on equity, the company that looked cheapest on the first sort came last on the second. A low forward figure standing alone tells you very little about which of those two positions you are in.
Pharmicell Stock and the Figures Two Houses Wrote Down
Two valuation figures exist for this name and both predate a large part of the price decline.
DS Investment & Securities wrote KRW 26,000 on May 13, 2026. Two quarterly reports have been filed since that date. A Korean market data page records a consensus average of KRW 24,000 as of September 8, 2026, roughly one quarterly report after the DS figure and one week before the close this piece uses.
I report those as facts about what other people published, and I do not adopt either of them. The reason I print them at all is that the gap between them is informative: an average of the covering houses sits below the single named figure I could locate, which tells me at least one other estimate in that average is lower than KRW 26,000, even though I could not find it.
A Korean trade publication summarising the Meritz work on April 20, 2026 carried the 2026 revenue estimate as KRW 163.2bn, up 43.1%, with operating profit up 63.9%. I use that revenue figure from the trade summary instead of from the brief itself, because the revenue row in the copy of the brief I could open does not reconcile with the other rows on the same page and I treat it as damaged.
What the bears are pointing at
The same trade publication describes the argument against the name: a second domestic supplier of the relevant resin has appeared, raising the prospect that the customer dual-sources. Meritz argues the risk is limited because changing the input of a laminate carries qualification and reliability costs. I note that the rebuttal comes from the same house whose estimates I used for the forward figure, which is not a neutral arrangement, and I have no independent channel to test either side.
Korean business daily Edaily reported on June 11, 2026 that the material reaches an artificial intelligence accelerator supply chain through a domestic electronics division. The same report carried a 2026 estimate without stating which house produced it, so I am leaving those figures out entirely.
Twenty-Two Ways This Piece Could Be Wrong
- The 11.31 figure divides a September price by an April estimate. If the estimate is stale for a reason I cannot see, the whole comparison collapses.
- That estimate carries a Not Rated label, which usually means the house is publishing analysis without putting its name behind a buy or sell call.
- I read the brief through a copy hosted on the broker’s own site and could not confirm it is the final version.
- The revenue row of that brief does not reconcile with its own other rows, and I called it damaged without knowing whether the fault is in the document or in how I extracted it.
- The 2024 base I reconstructed from growth rates agrees with the brief, but both could inherit the same upstream error.
- KRW 5.52bn of 2025 profit sits below the pretax line and I do not know what it is.
- If that amount is a one-off, the 16.18 trailing figure is flattering and I said so without being able to quantify the correction.
- The income statement screen I used for pretax profit belongs to a third-party aggregator and is not the audited filing.
- I did not open the 2025 audit report or its tax footnote at all.
- The peer forward figures come from one data provider and I did not check how that provider builds them.
- One peer price is fifty-three days old at the date of this piece.
- Comparing a resin supplier to laminate makers assumes the economics travel along the chain, which they may not.
- Two of the three peers are Taiwanese and report under a different accounting framework.
- None of the three peers has the customer concentration this company has.
- I did not adjust any figure for currency, so each ratio compares won earnings to a won price, or Taiwan dollar earnings to a Taiwan dollar price, side by side.
- The 2.80 ratio divides an average of three by a single figure, which gives the single figure the same standing as the average.
- Half of the 2026 operating profit estimate is already reported, and I treated the reported half as confirming the estimate when it could equally mean the second half must now do less.
- The dual-sourcing rebuttal I quoted comes from the house that produced the estimates.
- I could not read the disclosure for a supply contract filed on August 7, 2026, so a material order may be missing from this picture.
- The plant under construction is described in press coverage and not in any filing I opened.
- I have never spoken to a customer, a competitor or anyone at the company.
- This piece measures the name by one ratio, and I chose that ratio because it was the one where usable inputs existed on both sides. Had the inputs been available for a cash-based measure instead, I would have written a different piece and might have reached a different conclusion. The availability of data, not its importance, set the frame here.
Pharmicell Stock: My Stance and the Line That Breaks It
I do not own this and I have no order working. I am watching it.
The reason is not the level of the forward figure. It is that I have one estimate and no way to know whether it is an outlier. Eleven times forward earnings is either genuinely low or the product of a number nobody has bothered to lower, and from where I sit those two situations look identical.
My threshold is specific. If a second named house publishes a 2026 or 2027 earnings estimate for this company and it lands within 20% of the Meritz figures, then the single estimate stops being a sample of one and I can use the forward comparison as something other than an illustration. If a second estimate arrives more than 40% below, the low reading was an artifact of a stale input and this piece was measuring nothing.
A secondary condition: if the full-year 2026 operating profit lands within 10% of KRW 56.2bn, the April work survives contact with reality and its earnings per share figure becomes usable for a forward comparison in its own right instead of as a borrowed input.
What I Copied Without Recomputing
The list above covers where this piece could be wrong. This section covers something narrower: the places where I took someone else’s arithmetic and did not redo it. There are four.
First, the three forward ratios for the peers. I took each as printed and did not rebuild any of them from a price and an estimate. Second, the 2025 growth rates of 75%, 637% and 536%. I used them in reverse to reconstruct the 2024 base, which means I trusted the percentages to produce the levels. Third, the KRW 163.2bn revenue estimate and the 43.1% and 63.9% growth figures from the trade summary, none of which I checked against the underlying model. Fourth, the KRW 24,000 consensus average, which I neither decomposed into its contributors nor confirmed the count of.
Three of those four sit inside the comparison that this piece is built on. I am writing them down here instead of burying them in the longer list because copied arithmetic reads exactly like checked arithmetic once it is on the page, and six months from now I will not remember which was which.
Prices and ratios reflect closes checked at the time of writing; each date is printed beside the figure it belongs to. The Korean won is the reporting currency for this company, and the dollar figures here convert at approximately 1,347.10 won per dollar, the closing rate recorded for September 14, 2026. Conversions are approximate and no figure in a ratio mixes currencies.