SPG Co Stock: Priced Like Harmonic Drive on Thinner Margins
SPG Co stock closed at about USD 67.33 on Monday, September 14, 2026, and that price is 220.24 times the profit the company reported for 2025. Harmonic Drive Systems in Tokyo, which sells the same class of part into the same humanoid story, carries 187.69 times. I spent the morning assuming the 32-point gap was a Korean premium, and it is not. It is margin.
I hold none of this. There is no order in at KOSDAQ 058610 and there was not one last week either. What follows is one arithmetic chain run three times, on three companies that make the gears inside the moving parts of a robot arm.
| What the screens print | 220.24 in Seoul, 187.69 in Tokyo |
| What I can rebuild them from | Market value over revenue, over net margin |
| Where the Korean side is cheaper | 5.886 times revenue against 8.737 |
| Where it is dearer | 2.673 percent net margin against 4.654 |
| What I did not convert | Every figure in the comparison table is a pure ratio |
| What I am doing about it | Watching, with a named trigger and no position |
Contents
SPG Co stock trades at 220 times last year’s profit
The Korean company here makes small geared motors, and has done since 1991. It is listed on KOSDAQ, Korea’s junior board, which runs alongside the main KOSPI market and holds most of the country’s smaller technology names. The reason anyone outside Korea has started looking at it in 2026 is narrower than the motor business: it makes precision reduction gears, the parts that turn a fast, weak motor into a slow, strong robot joint.
The 2025 numbers, taken from the Korean financial summary I use for annual figures, are a net profit of KRW 9.133 billion, or roughly USD 6.78 million at the rate I use throughout. Divide that profit by the 22,177,360 shares on issue and per-share earnings come to KRW 411.83. Divide the September 14 close by that, and the multiple is 220.24, which is what the Korean company screen prints in its own cell. The screen and my own division agree to the second decimal, so I am not fighting the data here.
A 220 multiple on a components maker is the kind of number that usually ends the conversation. It did not end this one, because the same screen family gives a forward multiple of 125.40 against forward per-share earnings of KRW 723, and because the obvious comparison company in Tokyo is not far below the trailing figure.
The arithmetic that closes on both sides
An earnings multiple is not a single measurement. It is two measurements multiplied. Take market value over annual revenue, then divide by net margin, and the earnings multiple falls out. Written out, the sales multiple tells you what the market pays for a unit of revenue, and the margin tells you how much profit that unit carries.
On the Korean side: market value over 2025 revenue is 5.886, net margin is 2.673 percent, and 5.886 divided by 0.02673 returns 220.2. The screen prints 220.24.
On the Japanese side, using the Harmonic Drive Systems quote page: market value over trailing revenue is 8.737, net margin is 4.654 percent, and 8.737 divided by 0.04654 returns 187.7. That page prints 187.69.
Both sides close to within 0.05 of the printed cell. That is the whole finding, and everything below is what it implies.
SPG Co stock is cheaper on sales and dearer on profit
Once the chain closes, the comparison stops being about whether Korea is expensive. Here is the table, and there is no currency anywhere in it on purpose. Three companies, three reporting standards, two currencies, one set of pure ratios.
| Ratio | SPG Co | Harmonic Drive | Nabtesco |
|---|---|---|---|
| Market value over annual revenue | 5.886 | 8.737 | 1.680 |
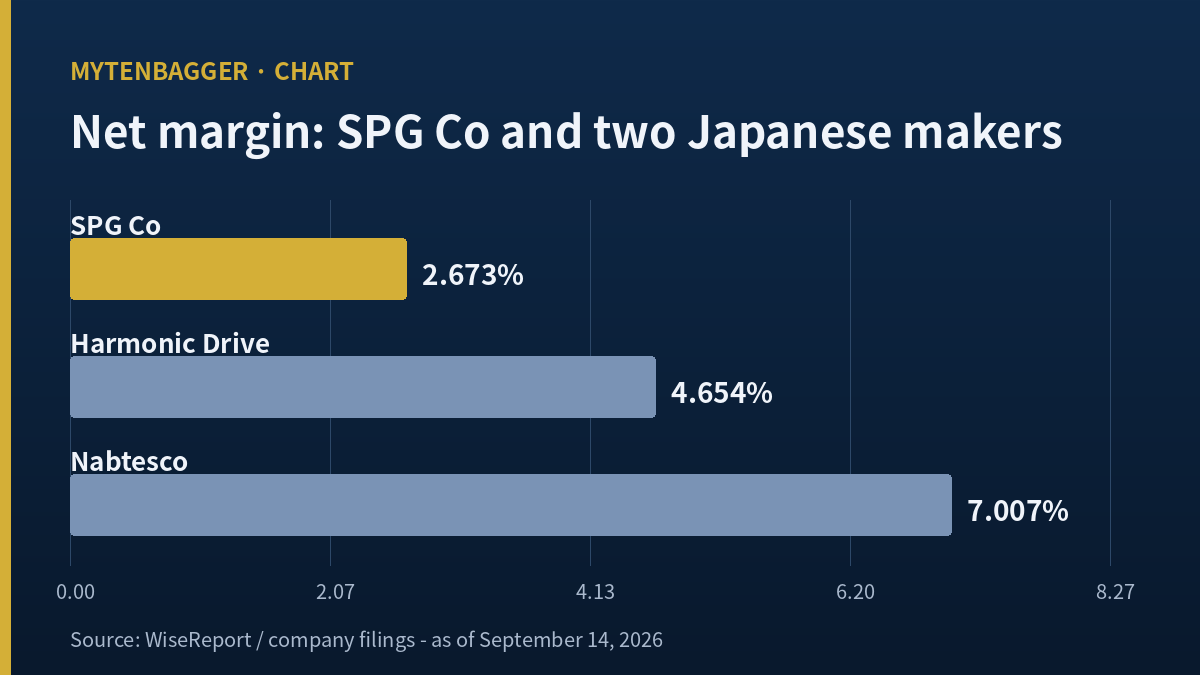
| Net margin | 2.673% | 4.654% | 7.007% |
| The two above, divided | 220.2 | 187.7 | 24.0 |
| Price over 52-week high | 54.74% | 63.72% | 71.90% |
| 52-week high over 52-week low | 6.373 | 3.781 | 1.928 |
Read the first two rows together. A US or Japanese buyer paying for Harmonic Drive revenue pays 48.4 percent more per unit of sales than a buyer of the Korean company pays. But each Korean unit of sales carries 42.6 percent less profit. The second effect is larger than the first, so the cheaper sales multiple arrives at the dearer earnings multiple.
The bottom two rows say something the first three do not. All three companies sit below their own 52-week highs, and the Korean one sits furthest below: 54.74 percent of its high, against 63.72 percent for Harmonic Drive and 71.90 percent for Nabtesco. The last row explains the ordering. The Korean high is 6.373 times its own low inside a single year, against 3.781 and 1.928 for the two Japanese names. A share that can move by a factor of six in twelve months will spend most of its time a long way from its high, so I read the fourth row as a consequence of the fifth and not as a statement about value. Those are the two rows in this table I would refuse to use as an argument for anything, and I put them in only because leaving them out would have made the first three look steadier than they are.
That is a more useful sentence than “Korea is expensive”, because it names something that can change. Margin is a thing a components maker can move by changing what it ships. A price premium is not.
The Japanese maker that owns the same idea
Harmonic Drive Systems closed at JPY 5,830 on Monday, September 14, 2026, for a market value of JPY 548.12 billion on 94.67 million shares. Trailing revenue is JPY 62.74 billion and trailing net profit is JPY 2.92 billion. Its 52-week range runs from JPY 2,420 to JPY 9,150, which is a 3.781 times spread inside one year.
I picked this company for a reason I can state in one line, and it is the twenty-fourth selection rule I have used: it is the only listed company whose entire revenue base is the exact product that is being used to justify the Korean company’s multiple. Nobody has to argue about segment definitions. The comparison is clean because the Japanese company has nothing else in it.
One caution about its own page. The price cell says JPY 5,830 and the per-share earnings cell says JPY 30.85, and those two divide to 188.98, not to the 187.69 the page prints. Running it backwards, 187.69 times 30.85 gives JPY 5,790, which looks like an earlier close. So the printed multiple and the printed price sit one session apart. I used the printed multiple in the table because my own two-step chain reproduces it, and I am flagging the mismatch here instead of quietly absorbing it.
I have measured the buyers of these gears before and came at them from the opposite side. In the Rainbow Robotics note the profit was so small that no earnings multiple could be formed at all, so I worked backwards from price to required revenue. In the Doosan Robotics note the question was whether six months of revenue growth had brought the loss down with it, and it had not. Those two are robot assemblers with no profit to divide. This one is a supplier whose profit divides cleanly and lands at 220. The problem moved from “the multiple cannot be built” to “the multiple can be built and it is enormous”.
A third gear maker the same story never reached
Nabtesco makes the cycloidal reduction gears that go into industrial robot arms, which is the same physics and a different customer. Its quote page shows JPY 4,395, a market value of JPY 520.18 billion on 117.21 million shares, trailing revenue of JPY 309.70 billion and trailing net profit of JPY 21.70 billion. The 52-week range is JPY 3,171 to JPY 6,113, a spread of 1.928.
Its earnings multiple cell prints 28.36. Price over per-share earnings of JPY 184.16 gives 23.87, and my revenue-and-margin chain gives 23.97. Two of my own routes agree with each other and disagree with the cell, so I put 24.0 in the table and said why here. A figure I cannot rebuild from the same page is not a figure I will quietly copy.
What Nabtesco adds is scale. It earns 7.007 percent on revenue that is roughly five times Harmonic Drive’s, and it trades at a quarter of Harmonic Drive’s multiple. The humanoid story has not reached it, because its gears sit in factory arms that were already being sold ten years ago. Whatever is in the Korean company’s price, it is not simply “makes reduction gears”.
What two houses have written next to SPG Co stock
Two Korean brokerages carry a figure on this name, and both figures are dated.
What I read in full and what I only read about
IBK Investment and Securities carries a KRW 100,000 figure dated Monday, July 20, 2026, from analyst Kim Hye-bin, alongside 2026 estimates of KRW 363.0 billion in revenue and KRW 22.3 billion in operating profit. Mirae Asset Securities carries KRW 129,000 from August 2026, which is 29.0 percent above the first. I reached both through Korean press coverage of the notes and did not open either original.
The one original I did open is a Samsung Securities note from analyst Suh Ji-hyun dated Wednesday, March 11, 2026, which carries no figure and no rating. It is the most useful document I found, and the useful part is historical: it prints the company’s 2024 earnings multiple at 39.6. Every argument about whether 220 is defensible has to start from the fact that this was a 40 times company two years ago, and the business did not change in between. The price did.
Where I stand on SPG Co stock, and what would end it
Watching. No position, no order, and I am not building one at this level. My reason is narrow, and it comes out of the table above; I have no useful view on how many humanoid robots get built.
If the whole argument for this price is that reduction gears become a much larger share of what this company sells, then the second row of that table matters more to me than the first. Revenue can triple and the earnings multiple will barely move if margin stays where it is. What I want is evidence that the mix change lifts margin, and the cleanest place that shows up is net margin closing part of the distance to the 4.654 percent the Japanese comparison earns.
The trigger I am waiting for is specific: net margin above 4 percent in any reported year. At 4 percent, holding the sales multiple where it is, the earnings multiple falls to roughly 147 without the share price moving at all. That is a number I could argue about. At 2.673 percent I cannot.
Two secondary conditions would end the reading in the other direction. First, if the sales multiple expands further while margin is flat, then the thing I am measuring has stopped being a business and I should stop using business ratios on it. Second, if Harmonic Drive’s own multiple compresses toward Nabtesco’s while the Korean one holds, my whole comparison loses its anchor, because I chose the Japanese company precisely for being priced on the same story.
On access, because this matters before anything above does. There is no US listing and no depositary receipt for this company.
Numbers I left out of this
The balance sheet side
Everything about equity, asset value and the ratio of price to those, I left to the Korean-language edition of this note. The two editions deliberately hold different ends of the same company, and nothing in this piece divides by equity.
The product mix percentages
The company’s disclosed revenue breakdown has five product lines and none of them is named for reduction gears. That absence is a real finding and it is also the Korean edition’s finding, so the percentages are not repeated here. What survives into this piece is only the consequence: the margin in the table is a whole-company margin, and it includes a lot of motor business that has nothing to do with robots.
One thing I checked that held
Net profit divided by 22,177,360 shares gives KRW 411.83, and the close divided by KRW 411.83 gives 220.24, which is the printed cell to the second decimal. Three numbers from three different places in the same screen family, and they are consistent with each other. Had that failed, every ratio in the table would have had to be rebuilt from filings instead.
Twenty places SPG Co stock could break my reading
- The whole table assumes revenue and profit cover matching periods. The Korean figures are a full fiscal year and the two Japanese figures are trailing twelve months, and those are not the same window.
- Korean reporting follows IFRS and the US screen presents the Japanese companies on its own normalized basis. I made no adjustment between them.
- Every ratio in the table is my own division. The only cells I took ready-made are the two printed multiples I was trying to reproduce.
- One close, on one day, for three companies in two time zones. Tokyo and Seoul do not close at the same moment.
- The Nabtesco price carried a mid-session timestamp on the page I read, so it may not be a closing figure at all.
- Nabtesco’s printed multiple does not reproduce from its own page. I used my own division and said so, but I could be the one who is wrong.
- Harmonic Drive’s printed multiple and printed price sit one session apart on the same page.
- I did not open a single original filing for either Japanese company.
- Revenue for the Japanese pair came from one screen provider. A second source could move the sales multiples.
- Net margin on the Korean side uses a profit figure that two Korean screens agree on, and agreement between two screens that may copy one feed proves nothing.
- Share count is registered shares. I did not confirm how much of it is held in treasury, and per-share figures change if a meaningful block is.
- The forward multiple of 125.40 and forward earnings of KRW 723 come from a vendor consensus whose contributors I cannot see.
- Neither brokerage figure came from an original document. Both arrived through press summaries.
- The Samsung Securities note is six months old and its author published no figure, so I am using it only as a historical reference point.
- The 2024 multiple of 39.6 is that note’s own calculation on its own earnings basis, which I did not verify.
- My 4 percent margin trigger assumes the sales multiple holds. It almost certainly will not hold while margin is moving.
- The implied 147 multiple at 4 percent margin is my arithmetic on my own assumption, not anybody’s forecast.
- Choosing a comparison company for having only one product makes the comparison clean and the sample size one.
- I have never handled one of these gears, visited either factory or spoken to a customer of any of the three companies.
- This note is an argument about how one ratio decomposes. It is not evidence about whether humanoid robots will be built in volume, and the entire price under discussion rests on that second question, which I did not touch.
The SPG Co stock figure I never once doubted
I close these notes with a different question each time. This time: which figure did I use without ever questioning it?
- The share count of 22,177,360. Every per-share figure above stands on it, and the only test I ran was registered capital divided by stated value per share. I never asked how much sits in treasury.
- Harmonic Drive’s trailing revenue of JPY 62.74 billion. I took the label “TTM” at face value and never checked which four quarters it actually covers, which matters because my Korean figure covers a fiscal year ending in December.
- The 2025 net profit on the Korean side. Two screens print it identically, and I let that agreement stand in for verification instead of opening the audited statement.
- The exchange rate of KRW 1,347.10. One date, one provider, applied to both conversions in the piece without a second look.
The second one is the heaviest, and it is heavier than it looks. If those trailing twelve months for the Japanese company end at a different point in the cycle than a Korean fiscal year does, then the margin gap I built the whole piece on is partly a timing artifact and only partly a business difference. That is the first thing I check when I come back to this.
Prices and ratios here reflect the September 14, 2026 closes as I found them at the time of writing, so live quotes will differ. Conversions are approximate, at roughly KRW 1,347.10 per dollar on that date; Korean won is the reference currency for the Korean company and Japanese yen for the two Japanese ones. Figures marked as my own division were calculated from two numbers printed side by side in this piece and are not values any source published in that form.