Two Ways to Split One Quarter at Wonik QnC: Neither Adds Up
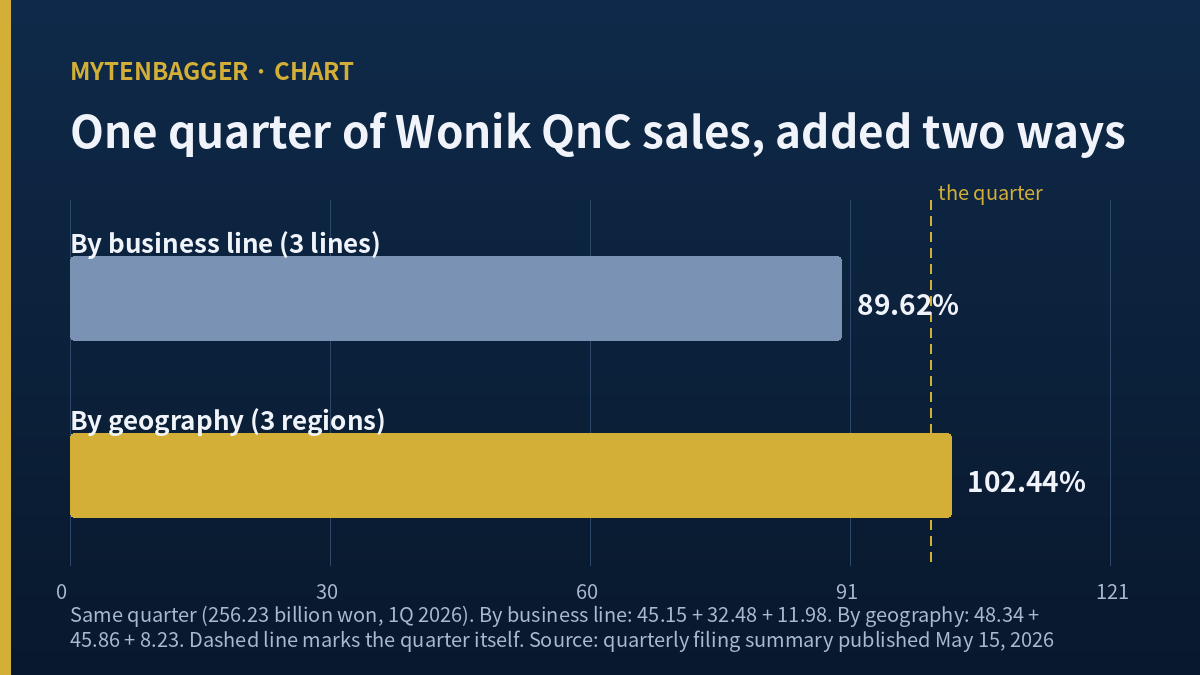
I opened the first quarter filing of Wonik QnC revenue expecting one table and found two. The company, a KOSDAQ listed maker of quartz components and cleaning services for chip fabs, broke the same three months down by business line and again by geography. I added each column myself. The business lines came to 89.62 percent of the quarter. The regions came to 102.44 percent of it. Both tables describe the same 256.23 billion won of sales, which is about 187.92 million US dollars, and the two of them miss the total in opposite directions.
One quarter, two tables
By business line / 45.15 + 32.48 + 11.98 = 89.62 percent / 19.51 million US dollars of the quarter appear in neither line
By geography / 48.34 + 45.86 + 8.23 = 102.44 percent / 4.58 million US dollars more than the quarter contains
My position / none held, no order placed / I am recording how this disclosure is put together and stopping there
Contents
Wonik QnC revenue split three ways covers 89.62 percent of the quarter
Here is the first table as the quarterly filing summary published on May 15, 2026 reports it. Quartz raw materials brought in 115.70 billion won, or 84.86 million US dollars, which the filing puts at 45.2 percent of sales. Korean quartz brought in 83.23 billion won, or 61.04 million US dollars, at 32.5 percent. Cleaning and coating brought in 30.70 billion won, or 22.51 million US dollars, at 12.0 percent.
I checked each percentage against the quarter total and each one holds. Dividing 115.70 by 256.23 gives 45.15 percent. Dividing 83.23 by 256.23 gives 32.48 percent. Dividing 30.70 by 256.23 gives 11.98 percent. The company rounded each of the three up by a few hundredths and every one of them is defensible on its own.
The three of them together are the problem. They sum to 229.63 billion won, which leaves 26.60 billion won, about 19.51 million US dollars, sitting inside the quarter and outside all three named lines. That is 10.38 percent of the period. I do not know what is in it. A fourth line the summary did not carry, a residual category, or an elimination between units are all possible and I confirmed none of them.
There are three forms the missing 26.60 billion won could take and they do not lead to the same place. If it is a fourth line of similar character to the named three, then quartz raw materials at 45.15 percent of the quarter is genuinely the largest single business and my first reading survives intact. If it is a residual bucket of small items, the same holds and the shares simply need to be read as shares of 89.62 and not of 100. If instead it is one substantial line the summary did not carry, then the ranking is open, and a company I have been describing as mainly a quartz maker could be something else in a way I would not detect from this table.
I can put a bound on the third case. For the unnamed portion to outrank quartz raw materials it would have to exceed 115.70 billion won, and it is 26.60 billion won, so that case is closed. For it to outrank cleaning and coating at 30.70 billion won it would have to exceed that figure, and 26.60 is below it, so that case is closed too. What remains open is the middle: 26.60 billion won sits between nothing and the smallest named line, close enough to the bottom of the table that if it were a single business it would be the fourth largest and not far behind the third. That is the version I cannot rule out and it is the version that matters least.
The regional split of Wonik QnC revenue comes to 102.44 percent
The second table in the same filing splits the quarter by where the sales landed. The United States accounts for 123.87 billion won, or 90.85 million US dollars, at 48.4 percent. Korea accounts for 117.50 billion won, or 86.17 million US dollars, at 45.9 percent. Taiwan accounts for 21.10 billion won, or 15.47 million US dollars, at 8.2 percent.
Each of those three percentages also holds against the quarter total. 123.87 over 256.23 is 48.34 percent. 117.50 over 256.23 is 45.86 percent. 21.10 over 256.23 is 8.23 percent. Then the three add to 262.47 billion won, which is 6.24 billion won, about 4.58 million US dollars, more than the quarter itself.
The ordinary explanation is that the regional figures are gross of sales between the group’s own units, so goods counted once in Korea get counted again on reaching a buyer in the United States. The company has carried a large overseas subsidiary since 2021, so intragroup flow is plausible. I could not confirm it. What I can say is narrower and I will keep it narrow: the same quarter, cut two ways, produces one figure that is short by 10.38 percent and one that is long by 2.44 percent.
Three percentages told me less than I assumed
This is the correction I owe on my own reading. When I first saw 45.2 percent next to quartz raw materials, I treated it as a statement about the whole company: almost half of what this business does is one product line, so I could reason about the business by reasoning about that line. I wrote a sentence to that effect before I added the column.
Three named shares that cover 89.62 percent of a period do not describe the period. They describe the part of it the company chose to name. The 10.38 percent I cannot see could be spread evenly across the three, in which case my reading survives, or it could be concentrated in one place, in which case the ranking of the three lines is not settled at all. A share of a named subset is not a share of the whole until the subset is the whole.
The practice I am changing: before I use any percentage from a breakdown, I add the breakdown up. If it does not reach 100, I write down what the gap is before I write down what the shares mean. It took me one column of arithmetic to find this and I did it after I had already formed a view.
What Wonik QnC revenue looked like across the last six quarters
| Quarter | Sales (billion won) | Approx. US dollars | Source |
|---|---|---|---|
| 1Q 2025 | 258.38 (derived by me) | 189.49 million | my arithmetic |
| 2Q 2025 | 232.98 | 170.87 million | Korean press |
| 3Q 2025 | 203.20 | 149.03 million | Korean press |
| 4Q 2025 | 249.06 | 182.66 million | Korean press |
| 1Q 2026 | 256.23 | 187.92 million | filing summary |
| 2Q 2026 | 271.90 | 199.41 million | Korean press |
The full year 2025 came to 943.62 billion won, about 692.05 million US dollars, up 5.8 percent. Subtracting the three quarters I have from that total leaves 258.38 billion won for the first quarter of 2025, and that is the only way I got a number for that period. It is my arithmetic and I have marked it as such in the table.
The second quarter of 2026 came in at 271.90 billion won against 232.98 a year earlier, which is a gain of 16.71 percent. The August 12, 2026 report of that quarter put the increase at 16.7 percent. That one reconciles.
One more thing the annual line says. If 943.62 billion won was a gain of 5.8 percent, then 2024 finished at about 891.89 billion won, roughly 654.10 million US dollars. Across 2025 the four quarters averaged 235.91 billion won and the spread between the largest and the smallest of them was 55.18 billion won, which is 23.4 percent of that average. A business whose quarters move in a band that wide is one where a single period tells you very little on its own, and this record is built on a single period.
One growth rate in my sources will not reconcile
The first quarter of 2026 is a different matter. A May 14, 2026 piece in the Korean press reported that quarter as 256.2 billion won and described it as a gain of 10.7 percent on the year before. If the year before was 258.38 billion won, then 256.23 is a decline of 0.83 percent, and the two statements cannot both be about the same pair of periods.
The quarterly chain closes on the year and the rate does not
I tested my own derived figure before I doubted the published one. Adding 258.38, 232.98, 203.20 and 249.06 gives 943.62 billion won, which is the reported annual total to the last decimal I have. Three of those four came from outside me and the fourth is what makes the sum close, so the test is partly circular. Still, if my 258.38 were badly wrong, the year would not land where the company says it landed.
That leaves three ways the 10.7 percent could be right and I could still be right: the rate is measured on the parent company accounts instead of the consolidated ones, the prior period was restated, or the figure belongs to something other than sales. I checked none of them. So I am not printing 10.7 percent as a fact anywhere in this record, and the growth line for that quarter stays empty.
Where Wonik QnC revenue goes when I look outside Korea
I picked the outside names differently this time. Instead of finding one company that resembles this one overall, I took the three business lines the company named and found one listed company whose main business is each line. The comparison is against the pieces, because the pieces are what this record is about.
| Named line | Share of the quarter | A listed company doing mainly that | Its screen figures |
|---|---|---|---|
| Quartz raw materials | 45.15 percent | Ferrotec Holdings (Tokyo 6890) | 288.93 billion yen of trailing sales, 14.89 billion yen of profit, 37.93 times earnings |
| Korean quartz | 32.48 percent | Entegris (Nasdaq ENTG) | 3.33 billion US dollars of trailing sales, 305.50 million of profit, 64.23 times earnings |
| Cleaning and coating | 11.98 percent | Ultra Clean Holdings (Nasdaq UCTT) | 2.20 billion US dollars of trailing sales, a loss of 23.40 million, no earnings multiple shown |
One limit the three outside names share
All three figures come from a single data provider, none of them are adjusted for accounting differences between Japan, the United States and Korea, and each of the three is a whole company while the thing I am comparing it to is a fraction of one. Two of the three also failed a small internal test I ran on their own screens. Multiplying the Ferrotec share count implied by its market value, 50.40 million shares, by its stated earnings per share of 276.02 yen gives 13.91 billion yen against the 14.89 billion the same screen reports, a miss of about 6.6 percent. Entegris divides to 64.45 times earnings on its own price and earnings figures against the 64.23 the screen prints. Ultra Clean Holdings reproduces cleanly, at 3.072 billion US dollars of market value on 45.28 million shares.
What the houses put on Wonik QnC revenue growth and what happened after
Coverage exists here, which is not always the case for a company this size. In the May 14, 2026 note round up, Shinhan Investment modelled 2026 sales of 1,076.6 billion won, about 789.58 million US dollars, and put 60,000 won a share on the company, which is about 44.00 US dollars. BNK Investment modelled 1,075.0 billion won, about 788.41 million US dollars, and put 50,000 won, about 36.67 US dollars.
Two months earlier the numbers were different. On March 6, 2026 Yuanta Securities wrote 41,000 won, about 30.07 US dollars, into a buy note after the fourth quarter print, and a March 9, 2026 summary listed four houses moving at once: Shinhan and BNK to 45,000 won, about 33.00 US dollars, Yuanta to 41,000 and Kiwoom to 40,000, about 29.34 US dollars.
As of the September 15, 2026 screen, the consensus figure reads 32,500 won, about 23.84 US dollars, with the stock around 19.29 US dollars a share and a market value near 507.05 million US dollars. The published sales estimates for 2026 have not come down that I can see; the valuation the same houses attach to those sales has. I have no way to tell from outside whether that reflects a changed multiple, a changed profit forecast, or a mechanical average over a different set of contributors, and I am not treating the spread as evidence of anything.
One more number from the same May 2026 note round up, because it is the only forward commitment I found with a size attached: the company planned about 25.0 billion won of capital spending in 2026, roughly 18.34 million US dollars, which it expected to add about 45.0 billion won, roughly 33.00 million US dollars, of annual capacity and bring total capacity past 500.0 billion won, roughly 366.70 million US dollars. Part of it was expected to start running in the fourth quarter of 2026. That is a company statement relayed through the press and I did not read the filing behind it.
What would settle this, and what I hold in the meantime
I hold none of this company and I placed no order. That is not a view on the business. It is a view on my own inputs, and the inputs here are two tables that do not close and a growth rate that contradicts a chain I built myself. I am not willing to put a value on a company when the total that every share I would quote is measured against is a figure I have had to rebuild myself.
Two documents would move me, and I am writing down in advance what each one has to show. The half year report for 2026 is the first. If its segment note carries the same three lines and they again cover something near 89.6 percent of sales, then the gap is a standing feature of how this company reports and I can work with it by treating every share as a share of the named subset. If the note carries a fourth line that closes the table, then this record was a story about an abbreviated press summary and not about the company at all, and I will say so.
The annual report for 2026 is the second. If the regional table there still sums past the total, and a note explains it as sales between group units, then the overlap is measurable and the United States share of 48.34 percent can be read as a destination share instead of a gross one. If it sums past the total with no such note, then I have no way to know what fraction of the largest single geography is the group selling to itself, and I will stop using regional shares for this company entirely.
There is a third thing I would want and do not expect: a restatement note covering the first quarter of 2025. That is the only document that would let both the 10.7 percent growth rate and my own 258.38 billion won be correct at the same time. Until one of those three arrives I am keeping this company in the reading pile and out of the account.
Twenty four places this Wonik QnC revenue record can be wrong
- I read no primary filing. Every figure here came through secondary reporting or a data screen.
- The 10.38 percent gap in the business line table has no explanation I verified.
- The 2.44 percent excess in the regional table has no explanation I verified either.
- I assumed the two tables cover the same total. The filing summary presents them that way and I did not confirm it.
- A fourth business line may exist and may simply not have been carried in the summary I read.
- The company rounds each share to one decimal and my recomputation to two decimals may not match its own basis.
- First quarter 2025 sales of 258.38 billion won came out of my own arithmetic and no source reports them.
- The annual total closing on my derived figure is partly circular, since the derived figure was built to close it.
- The 10.7 percent growth rate for the first quarter of 2026 conflicts with my chain and I did not resolve it.
- I did not check whether any prior period was restated.
- I did not separate consolidated from parent company figures anywhere.
- Quarterly sales for 2025 came from three different press reports that may not use the same basis.
- The regional table names three places and the company sells into more than three.
- Intragroup elimination is my guess at what causes the regional overlap and I confirmed none of it.
- Capacity utilization of 83.3 percent and production of 254.63 billion won appear in the filing summary and I used neither.
- The peer figures come from one provider on one day.
- The peer figures are not adjusted for accounting differences across three jurisdictions.
- Two of the three peer screens did not reproduce internally when I tested them.
- Comparing three whole companies against three fractions of one company is not a like comparison and I did it anyway.
- The 2026 sales estimates are from May 2026 and may have been revised since without my seeing it.
- The consensus figure is an average whose contributor list I cannot see.
- Currency conversion uses one rate for figures spanning several years, which understates nothing and overstates nothing in a way I can measure.
- I contacted the company about none of this.
- Choosing to write about how a disclosure is assembled instead of about a business is itself a choice that keeps me from having to value the business.
Figures I left out
Capacity utilization of 83.3 percent, and production of 254.63 billion won against sales of 256.23 billion won in the same quarter, a ratio of 99.37 percent. Both are interesting and both need a definition of what counts as production before they mean anything, so they sit here instead of in the argument. I also left out every profit line for this company, which belongs to a different question than the one this record asks.
What I took on the company’s word
Twenty four entries above say where I could be wrong. The reverse question is shorter and more uncomfortable, so here it is: in this record, where did I simply believe what I was told?
- The quarter total of 256.23 billion won. Every percentage in this piece is measured against it. If that figure is on a different basis from the two tables, both of my sums are meaningless and the whole record collapses.
- That the two tables are two views of one thing. I never saw them presented side by side with a shared total. I inferred it because they appeared in the same summary.
- The three named business lines being the three largest. Nothing I read said so. I assumed it from the order they were listed in.
- That a 10.38 percent gap is worth writing about at all. Segment tables leave residuals as a matter of routine, and a reader who works with filings daily may find this ordinary. I found it striking because I add columns by hand, which says as much about me as about the company.
The fourth one is the one I would attack first if I were reading this instead of writing it.
Prices and per share figures reflect the September 15, 2026 close. US dollar conversions are approximate, at 1,363.51 won per dollar on that date, and the same rate is applied to figures from earlier periods, so those conversions carry a rounding error of their own. Korean press reports are relayed here in translation.
Related records: the piece on Wonik IPS sorted eight companies on two published ratios and asked which one ranked last, working entirely with numbers that were already complete; here the numbers are incomplete before any sorting begins. The piece on ENF Technology took a return apart to see what it was measured against; this one takes a single period apart to see what it is made of.