Has iSENS Stock Passed Its Own Second Quarter From 2022?
The day I reopened iSENS stock I did not start with the price screen. I started with a half-year report from 2022, because four years ago I had written a figure in its margin: a June quarter operating margin of 11.89%. What sent me back to that note was a headline saying the company had just posted its largest quarterly revenue ever. Both statements describe the same company and the same quarter of the year, and they refused to sit together comfortably in my head. iSENS, which styles its own name i-SENS, trades on the KOSDAQ, the smaller and more growth weighted of Korea’s two main boards, under the code 099190.
What this note settles about iSENS stock
June quarter revenue of KRW 88.67bn in 2026 is the largest of the five I stacked, and 43.57% above the KRW 61.76bn of 2022.
Operating profit in those same five slots reads KRW 7.34bn in 2022 and KRW 6.61bn in 2026. It is still 10.01% smaller.
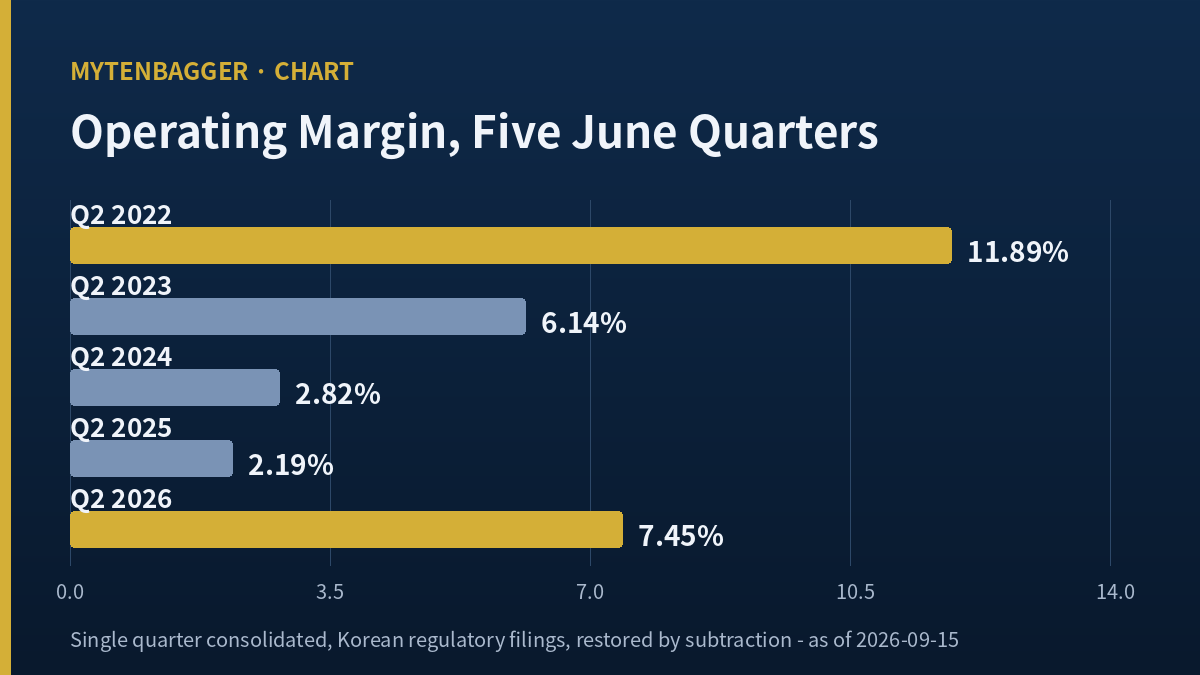
The margin fell from 11.89% to 2.19% and has climbed back to 7.45%. It has turned upward. It has not returned.
What it does not settle
I could not obtain the audited footnotes that would explain the KRW 14.58bn sitting between 2025 operating profit and 2025 net loss.
Roughly KRW 19.2bn of convertible bonds is still outstanding, and the holders decide when and how fast that becomes equity. I have no timetable for it.
Contents
What I stacked next to iSENS stock
A company reports on two clocks. One is the fiscal year and the other is the cumulative quarter. I used a third arrangement. I held the position in the year fixed and moved only the year itself, pulling out nothing but June quarters and setting them one under the other. Seasonality drops out of a view built this way, because every row is a summer and no winter row is left to swing the picture.
Every figure below comes from Korean regulatory filings on a consolidated basis. Korean quarterly filings report flows cumulatively, so each single quarter here is a value I restored by taking one cumulative figure away from the one before it.
| June quarter | Revenue (KRW bn) | Operating profit (KRW bn) | Operating margin |
|---|---|---|---|
| 2022 | 61.76 | 7.34 | 11.89% |
| 2023 | 62.49 | 3.84 | 6.14% |
| 2024 | 69.90 | 1.97 | 2.82% |
| 2025 | 76.79 | 1.68 | 2.19% |
| 2026 | 88.67 | 6.61 | 7.45% |
The revenue column advanced four times without interruption. Across all five rows it never once came in below the year before, which is not a common thing to find in a column of five. The operating profit column behaved nothing like that. It began at KRW 7.34bn, fell three times to KRW 1.68bn, and then jumped in a single step to KRW 6.61bn.
Revenue up 43.57 percent, operating profit down 10.01 percent
Reading only the two ends: revenue went from KRW 61.76bn to KRW 88.67bn, which is 43.57% larger. Operating profit went from KRW 7.34bn to KRW 6.61bn, which is 10.01% smaller. In the same slot of the year, over four years, the company sold KRW 26.91bn more and kept KRW 0.73bn less at the operating line.
Turning upward is not the same as returning
Korean coverage of the quarter attached a growth figure of 274.1% to that operating line. That figure takes KRW 1.68bn from the 2025 June quarter as its base and KRW 6.61bn from 2026 as its top. The base is the lowest of the five slots I stacked, and climbing off a low base produces a large percentage. I do not think that number is wrong. I am only recording that it points somewhere different from the absolute amount. The growth figure points at a strong recovery. The absolute amount points at a level still beneath 2022. Both are true at the same time.
The margin makes the same point with less arithmetic. It went from 11.89% down to 2.19% and back up to 7.45%. The descent covered 9.70 percentage points and the climb has covered 5.26 percentage points. A little over half the ground is back.
Where the annual rows put the bottom for iSENS stock
Run the same company on fiscal years and a different account appears. Full year revenue moved from KRW 264.84bn in 2022 to KRW 265.12bn in 2023, KRW 291.14bn in 2024 and KRW 315.44bn in 2025, a rise of 19.11% across the span. Operating profit over those same four years reads KRW 19.81bn, KRW 10.93bn, KRW 2.66bn and KRW 7.89bn, so the annual view marks 2024 as the low point.
My June quarter table marks 2025 as the low point. The two arrangements nominate different years, and neither is a misprint. The 2024 fiscal year carried a fourth quarter operating loss of KRW 3.95bn that dragged the annual figure down, and in 2025 that same fourth quarter came back positive at KRW 2.06bn and lifted the year. Look only at summers and 2025 sits lower. Fold twelve months together and 2024 sits lower.
Net income runs in a third direction entirely: KRW 15.91bn in 2022, KRW 3.40bn in 2023, a loss of KRW 1.95bn in 2024 and a loss of KRW 6.69bn in 2025. I am deliberately not building this article on that column. I could not document what happened below the operating line, and an argument I cannot document is not an argument I verified.
The preliminary and the filed numbers parted twice
My hand stopped once while I was building the table. The figures the company puts out shortly after a quarter closes, and the figures that appear in the statutory report a couple of weeks later, disagreed in two consecutive quarters.
| Item | Preliminary (KRW bn) | Filed (KRW bn) | Difference |
|---|---|---|---|
| 2026 Q1 revenue | 74.50 | 75.13 | plus 0.63 |
| 2026 Q1 operating profit | 0.80 | 0.94 | plus 0.14 |
| 2026 Q2 revenue | 88.50 | 88.67 | plus 0.17 |
| 2026 Q2 operating profit | 6.30 | 6.61 | plus 0.31 |
The preliminary first quarter figures come from Korean trade press dated 28 April 2026 and the preliminary second quarter figures from Korean trade press dated 27 July 2026. The filed figures come from the quarterly report submitted in May and the half-year report submitted in August. The gaps are small. What matters is where the smaller number went afterwards. A Korean sell-side briefing published on 28 July cited second quarter operating profit of KRW 6.3bn, which is the preliminary value. The filed value is KRW 6.61bn. I made the same mistake first, wrote KRW 6.3bn into my own table, and corrected it only after opening the half-year report.
iSENS stock measured against DexCom and Abbott
Two listed companies sell into the same clinical need from far larger positions. DexCom (NASDAQ: DXCM) closed at USD 83.88 on 9 September 2026 for a market value of USD 31.65bn on 377.36 million shares, with trailing revenue of USD 4.97bn, a trailing operating margin of 22.92% and earnings of USD 2.54 per share for a trailing earnings multiple of 33.07. Abbott (NYSE: ABT) closed the same day at USD 105.23 for USD 182.09bn on 1.73 billion shares, with trailing revenue of USD 46.59bn, a trailing operating margin of 17.68% and earnings of USD 3.09 per share for 34.05 times earnings. Both sets of figures come from the same statistics screen, dated 9 September 2026. I recomputed each market value as price times share count and each earnings multiple as price over earnings per share before using either: Abbott came back at 34.05 exactly, and DexCom came back at 33.02 against the 33.07 printed, a drift of 0.15% that I am leaving visible instead of smoothing.
This is not a league table and I am not ranking anyone. The three companies are not selling the same basket, and the periods do not even line up: the two American figures are trailing twelve months while the iSENS margin I have been discussing is a single quarter. With that stated plainly, the June quarter margin of 7.45% sits well under both American trailing margins, and the Korean company’s entire market value of KRW 504.0bn, which is USD 377.2m at 1,336.1 KRW per USD on 9 September 2026 (2026-09-09), is roughly one eighty-fourth of DexCom’s. Deliberately, I have built no multiples table across the three, because a table like that invites a comparison the underlying businesses do not support.
Access is worth a caveat for readers outside Korea. There is no American depositary receipt for this company. I have not checked whether either fund holds this name.
The 250-day range on the iSENS stock screen is not closes
The price side gave me a second pause. My indicator screen reports a 250 session high of KRW 27,600 and a low of KRW 14,000, and it labels the basis field in a way that means adjusted closing prices over 250 sessions. Take the label at its word and both of those are closes.
I pulled the daily series and counted the 250 sessions myself. On closing prices the high is KRW 27,000, set on Monday 23 February 2026, and the low is KRW 14,690, set on Friday 26 June 2026. The screen’s KRW 27,600 is an intraday high from Thursday 19 February 2026, and its KRW 14,000 is an intraday low from Tuesday 14 July 2026. The label says closing and the values are intraday.
How much the mislabel moves the drawdown
Measured from the Wednesday 9 September 2026 close of KRW 17,200, the screen values give a drawdown from the high of minus 37.68% while my own count on closes gives minus 36.30%, a gap of 1.38 percentage points. The rise off the low separates further: plus 22.86% on the screen values against plus 17.09% on closes, a gap of 5.77 percentage points. This is the third company in which I have met the identical defect, and only the values I counted myself appear in this article.
I also removed the book value per share that screen carries. It prints KRW 11,419, and dividing four candidate equity figures by the 29,302,326 shares outstanding produces KRW 10,758.4 from 2025 year end owners’ equity, KRW 11,545.9 from 2025 year end consolidated equity, KRW 11,602.9 from June 2026 owners’ equity and KRW 12,421.6 from June 2026 consolidated equity. None of the four lands on the printed figure, so no price to book ratio appears here. A blank from a failed check beats a plausible wrong number.
The convertible bond under iSENS stock
Something that can change the share count is still attached to this company. In April 2024 it issued KRW 50.0bn of convertible bonds carrying a 0% coupon and a 0% yield to maturity, with an initial conversion price of KRW 19,279 and a floor conversion price of KRW 16,388 should the market price fall. The conversion window runs from 30 April 2025 to 30 March 2029 and the bonds mature on 30 April 2029. The company said most of the proceeds would build an automated continuous glucose monitoring line at its second Songdo plant.
Korean press in early May 2026 reported that the company had repurchased and cancelled roughly KRW 12.8bn of those bonds early, leaving roughly KRW 19.2bn outstanding. Dividing KRW 12.8bn by the KRW 16,388 floor gives 781,059 shares, which agrees with the 780,000 shares the reports describe. The same arithmetic on the remaining KRW 19.2bn gives 1,171,589 shares, equal to 4.00% of the 29,302,326 shares outstanding. The 9 September close of KRW 17,200 sits 4.95% above that floor, so the conversion right is live. I read this as neither a threat nor a gift. It simply means the share count is not a settled figure when anyone computes anything per share here.
Four places where I could be wrong about iSENS stock
First, the continuous glucose monitoring ramp. The company set a KRW 40.0bn target for that product line in 2026 and the first half delivered KRW 17.8bn, which is 44.5% of it. Reaching the target needs KRW 22.2bn in the second half, and that is 1.25 times what the first half produced. The chief financial officer reaffirmed in a 7 September interview that the target remains achievable. I have no material with which to contradict him and no material yet showing it done. The line produced KRW 17.6bn in 2025, so the target asks for growth of 127.27% in a single year.
Second, everything below the operating line in 2025. Operating profit of KRW 7.89bn and a net loss of KRW 6.69bn leave KRW 14.58bn between them, a difference I worked out from two filed figures myself. One Korean analysis outlet wrote that the gap contains goodwill impairment on an American subsidiary along with losses on financial assets, derivatives and currency forwards. That outlet is an individual analyst publication, so I will not lean on it alone. This paragraph gets rewritten when I hold the audited footnotes.
Third, interest. First half 2026 operating profit of KRW 7.54bn over first half interest expense of KRW 5.66bn gives 1.33, which matches what my screen reports. On an annual basis interest expense has climbed from KRW 7.70bn in 2022 to KRW 8.93bn in 2025. If operating profit sinks again this is the line that tightens first.
Fourth, the spending. Purchases of property and equipment across 2022 through 2025 total KRW 106.96bn against total operating profit of KRW 41.28bn over the same four years, so investment ran 2.59 times what the operating line earned. Free cash flow across those four years totals negative KRW 44.19bn. The company points to the automated Songdo line as the destination of that money, and I have no way to calculate when such a line starts returning as margin. Inventory grew 27.17% from KRW 68.03bn at June 2022 to KRW 86.51bn at June 2026, while inventory days against single quarter revenue read 100.2 and 88.8 at those two dates.
Two more lines are worth writing down before I leave the balance sheet. The debt to equity ratio ran 47.52% at the end of 2022, 64.36% at the end of 2023, 72.27% at the end of 2024, 70.74% at the end of 2025 and 64.61% at June 2026, so the leverage taken on to fund that spending has begun easing without having unwound. Foreign investors held 24.83% of the shares and margin balances stood at 2.42% of them on the vendor screen dated 9 September 2026, which for a company of this size is a fairly heavy foreign presence and a light speculative one.
The product line the whole thesis leans on is also worth decomposing, because the aggregate hides where the growth is coming from. Of the KRW 9.4bn the monitoring line produced in the June quarter on a consolidated basis, Korean coverage puts roughly KRW 3.6bn in Korea and roughly KRW 5.8bn abroad, and the same reporting places the overseas share of that line at 62% with Germany, the United Kingdom, Finland and New Zealand named. The line accounted for 11.1% of company revenue in the March quarter and 10.7% in the June quarter, so it is still one tenth of the business carrying the argument for the other nine. American regulatory trials and European pediatric trials were described as under way, and a successor device was described as targeting trial completion within the year. None of those has a date I can verify, so none of them enters my arithmetic.
Three earlier notes sit near this one. On a Korean company whose reported revenue and the outside number people quote for it are not the same thing, there is the SK Biopharm entry on prescriptions against revenue. On what a valuation rests upon when the headline technology is real but its share of the economics is fixed, there is the Alteogen royalty entry. On consolidated profit that does not all belong to the shareholder buying the ticker, there is the Kolmar Korea entry, and for a case where I did take a position on record earnings there is the Celltrion entry.
I ran the same method on the first quarter
This article owns exactly one method: fix the position in the year and move the year. The most honest test available to it, then, is to apply that method somewhere else and see whether it holds. So I stacked the March quarters too.
From 2022 to 2026 the March quarter revenues read KRW 68.82bn, KRW 60.65bn, KRW 68.40bn, KRW 76.27bn and KRW 75.13bn. Unlike the June column, this one bends downward twice, and the 2026 figure of KRW 75.13bn is 1.49% below the KRW 76.27bn of 2025, the only slot in either stack that came in beneath the year before it. The operating profits read KRW 9.81bn, KRW 4.50bn, KRW 0.81bn, KRW 3.24bn and KRW 0.94bn, so the 2026 March quarter is 9.55% of what the 2022 March quarter earned.
One method, two positions, two different pictures. In the summer slot revenue never bent and the margin has taken back a little over half its lost ground. In the spring slot revenue bent for the first time and operating profit sits near a tenth of its level four years ago. The coexistence of those two pictures is the whole of what I established here, which narrows my verdict to something narrower than improving and narrower than deteriorating: the two slots are not yet telling the same story.
Not owned, no order, watching. At a market value of KRW 504.0bn this sits well outside Korea’s hundred largest listings, so I take no trading position in it. What I will write down instead is the next place to look. My watching holds if the third quarter of 2026 prints a single quarter operating margin clearly above the 1.16% of the third quarter of 2025, and my watching ends if that quarter’s revenue slips below the KRW 78.73bn of the third quarter of 2025 while the margin falls with it. The statutory filing deadline for that report is Monday 16 November 2026. On that day I intend to add an autumn slot to the first table in this article.
Sources and bases. Operating figures are consolidated values from Korean regulatory filings, with single quarter amounts restored by taking one cumulative period away from the next. Price, market value, share count and dividend history are vendor screen values keyed to the Wednesday 9 September 2026 close of KRW 17,200, and the exchange rate of 1,336.1 KRW per USD is the 3:30 pm Seoul onshore close of 2026-09-09 as reported by Korean financial press. The 250 session range was recounted from the daily series instead of taken from the screen. Peer figures come from the DexCom statistics page and the Abbott statistics page, both dated 9 September 2026. Korean press material, translated and paraphrased here instead of quoted in the original language, comes from second quarter preliminary coverage, first quarter preliminary coverage, an interview on the glucose monitoring line, a Korean sell-side briefing summary, reporting on the early bond repurchase and reporting on the original bond issue. Two Korean sell-side houses carry this name with published valuations: a 32,000 won valuation from Daol Investment and Securities analyst Park Jong-hyun dated 28 July 2026 and a 24,000 won valuation from Mirae Asset Securities analysts Kim Chung-hyun and Park Sun-young dated 23 July 2025, the latter now fourteen months old; one aggregator lists two analysts with a mean of 36,000 won and a high of 40,000 won, and I could not put a house name to that high figure.