Hyosung Advanced Materials Stock and Five Years of Capex
- Hyosung Advanced Materials stock closed at 165,900 won on September 18, 2026, valuing the company near $538 million (that close times 4,479,948 listed shares, converted at 1,380.39 won per dollar; share count per the Chickstock quote page).
- Property, plant and equipment went from 1.224 trillion won to 2.108 trillion between 2021 and 2025, a gain of 72.22% (annual balance sheet, S&P Global Market Intelligence).
- Revenue in 2025 came in at 3.283 trillion won against 3.598 trillion in 2021 (annual income statement, same source, page dated August 14, 2026).
Over five financial years this company put 1.308 trillion won, about $948 million, into capital expenditure. That is the sum of five reported capex lines, 2021 through 2025, and it is roughly 1.76 times what the whole company is worth on the market today.
Here is what that spending did not buy. Revenue in the final year of that stretch was lower than revenue in the first year. Operating income was 157.4 billion won in 2025 against 437.3 billion in 2021. So I went looking for where the money went, because it plainly did not go into the top line.
I do not own this stock and I have no order in. What follows is the work I did before deciding that, and the four things that would change it.
Contents
Hyosung Advanced Materials Stock and What Five Years of Capex Bought
First, the company. This is a KOSPI listing, Korea’s main board, the index that plays the role the S&P 500 plays for a US reader. The company makes tire reinforcement material, and it states on its own site that it holds the number one global share in polyester tire cord and in ultra-tensile steel cord, and that one of every two passenger cars in the world runs on cord it made. A trade publication covering the sector put that polyester share at roughly 50%. Alongside the cord business sit aramid and carbon fiber.
Now the spending. I pulled the five capex lines from the annual cash flow statement and added them. All figures below are in millions of won, with dollar equivalents at 1,380.39 won per dollar.
| Metric | 2021 | 2023 | 2025 | 5-yr total |
|---|---|---|---|---|
| Capital expenditure | 148,161 | 358,303 | 222,204 | 1,308,144 |
| Operating cash flow | 234,660 | 352,903 | 210,097 | 1,476,992 |
| Free cash flow | 86,500 | -5,401 | -12,106 | 168,849 |
| Property, plant & equipment | 1,224,325 | 1,572,396 | 2,108,487 | Not applicable |
| Total assets | 2,908,682 | 3,167,434 | 3,903,415 | Not applicable |
| Total debt | 1,549,846 | 1,747,280 | 2,520,688 | Not applicable |
Source: stockanalysis.com annual statements, data from S&P Global Market Intelligence. Income and cash flow pages dated August 14, 2026; balance sheet page dated March 31, 2026. Millions of won. Five-year totals summed by me.
Total assets grew 34.20% over those five years. Total debt grew 62.64%. Plant grew 72.22%. Revenue did not grow at all.
Hyosung Advanced Materials Stock and the Revenue per Won of Plant
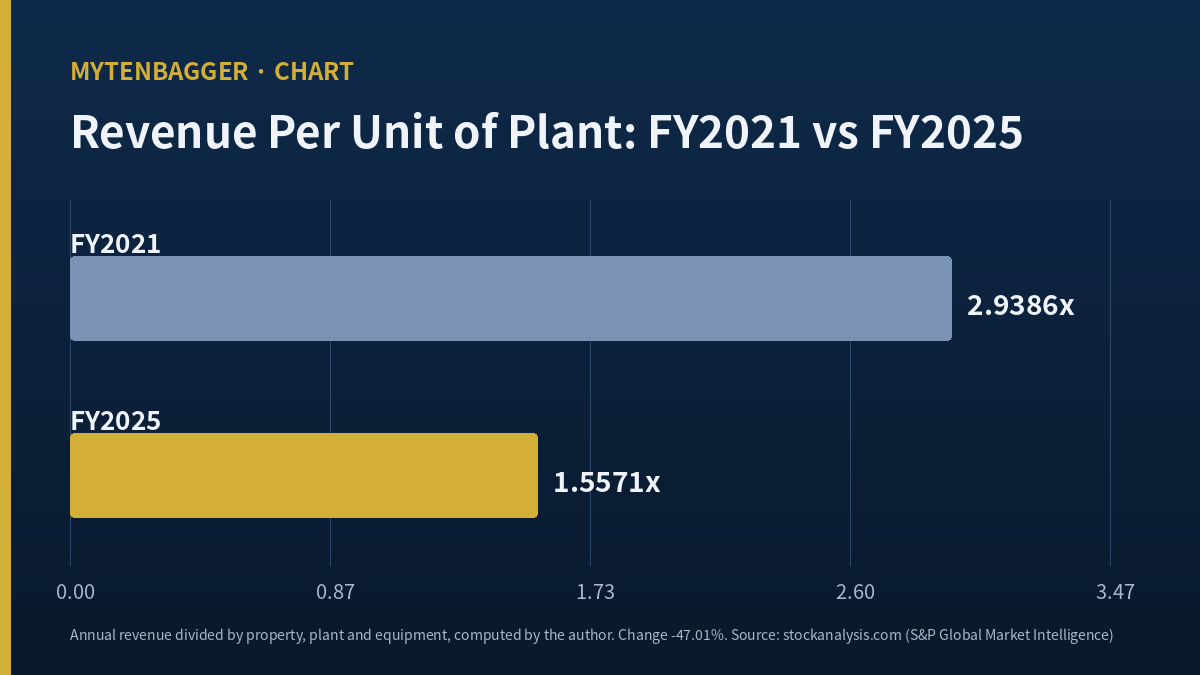
2.9386 in 2021, 1.5571 in 2025
I divided each year’s revenue by that year’s property, plant and equipment. In 2021 every won of plant carried 2.9386 won of revenue. In 2025 it carried 1.5571. That is a decline of 47.01%.
The ratio is crude and I know it. Plant under construction shows up in the asset base before it produces anything, so a company mid-build will always look worse on this measure than a company that finished building. That is the honest defense of the 2025 reading, and I take it seriously enough to have written it here before the conclusion.
What makes me keep the ratio anyway is the length of the stretch. This is not one year of construction. Capex exceeded operating cash flow in 2023 and again in 2024, and free cash flow has been negative in each of the last three reported years. A build phase that runs three years and ends with revenue below where it started is a build phase I want the company to explain before I pay for it.
Hyosung Advanced Materials Stock Next to Hexcel on One Measure
For a global reference I picked Hexcel Corporation (NYSE: HXL). The reason is narrow and I want it stated plainly: Hexcel is made almost entirely of the product line this company runs at a loss. Carbon fiber composites are Hexcel’s whole business. At the Korean company they sit inside the segment that iM Securities recorded at a 30.7 billion won operating loss in the third quarter of 2025 and a 1.2 billion won loss in the first quarter of 2026.
I am holding this comparison to one measure and I am saying so in advance. I am not converting Hexcel’s absolute figures into won, I am not lining up margins, and I am not putting the two multiples in a table. Two points in time, one ratio, nothing else.
| Revenue per unit of plant | FY2021 | FY2025 | Change |
|---|---|---|---|
| The Korean maker | 2.9386 | 1.5571 | -47.01% |
| Hexcel | 0.7373 | 1.1570 | +56.91% |
Computed by me from each company’s reported annual revenue and property, plant and equipment. Korean figures: stockanalysis.com, S&P Global Market Intelligence. Hexcel figures: stockanalysis.com balance sheet, page dated July 29, 2026. Both columns are fiscal-year annual figures, so the two rows stand on the same kind of window.
Hexcel shrank its plant 8.90% over the stretch and grew revenue 42.94%. It got more output from a smaller asset base. The Korean maker did the opposite on both counts. One company harvested an existing base; the other built a new one and is still waiting.
That framing is not a verdict on either management. A harvester eventually runs out of runway, and a builder eventually finishes. It is a statement about which point in the cycle a buyer is stepping into today.
The Guarantee Balance Standing Behind That Plant
Much of the new plant sits in subsidiaries abroad, and those subsidiaries borrow. On September 11, 2026 the company filed a decision to guarantee $20 million of borrowing by its Vietnamese unit, a renewal of a trade finance facility with a Vietinbank unit in Nhon Trach against an original $40 million loan. The filing states a cumulative guarantee balance of 1,630,971,990,800 won, about $1.18 billion.
Set that against shareholders’ equity. Total equity at the end of 2025 was 826.5 billion won. The guarantee balance is 1.9733 times that figure. Against common equity alone, 807.6 billion won, it is 2.0194 times.
Set it against borrowings instead and the picture is calmer. Total debt at the end of 2025 was 2,520,688 million won, so the guarantee balance is 0.6470 times reported debt. That ratio is the one a lender would look at, and it is the reason I am reporting both bases instead of the one that suits my case.
Five such guarantee filings landed in eight days, on September 4, twice on September 7, and twice on September 11. I went through the disclosure list to count them instead of trusting my impression of how many there were. The list I read reaches back only about sixty days, so I cannot say how far the tempo extends.
These are guarantees. They are not borrowings. The subsidiary named in the September 11 filing reported 6.6 billion won of 2025 net income, 475.9 billion won of total assets and 108.3 billion won of equity, so it is not an empty shell. Still, the cluster tells me where the capital story now lives, and it is not on the parent’s balance sheet alone. I looked at a similar question of what a single listing actually wraps around in Lotte Fine Chemical Stock and the Segment That Lost Money.
The 83.6 Billion Won That Did Not Go Into Plant
There is a second spending line in 2025 that the capex row does not carry. The cash flow statement shows cash acquisitions of 83,593 million won, about $60.6 million, and it is the only such entry in the five years I pulled. Investing cash outflow that year came to 351,755 million won against capex of 222,204 million, a gap of 129,551 million, and the acquisition accounts for most of it.
The balance sheet corroborates it from the other side. Goodwill sat between 8.3 and 9.4 billion won in every year from 2021 through 2024. It was 16,134 million at the end of 2025 and 62,962 million on the March 31, 2026 balance sheet, 3.90 times the 2025 close and 46,828 million higher in one quarter. Something was consolidated in late 2025 or early 2026 and it was not a greenfield line.
I could not identify the acquired company from the statements alone, and I did not find a filing that named it in the disclosure list I read. So I am recording the outline of the transaction instead of its name. What that outline tells me is that the asset base grew through purchase as well as through construction, and purchased goodwill produces no revenue at all until the acquired business is consolidated into the top line.
Two further filings on July 9, 2026 point the same direction: an acquisition of shares in another company and two decisions to subscribe to rights issues at subsidiaries. Whatever the plan is, it was still being funded this summer.
I have watched a comparable pattern in a neighboring listing. In Hanwha Solutions Stock Is Also a Petrochemical Company the question was which segment a reader was actually buying. Here the question is which vintage of plant a buyer is actually paying for.
Hyosung Advanced Materials Stock and Two Filings Eleven Days Apart
The India payment, completed August 31
On August 31, 2026 the company filed a corrected notice of an acquisition of shares in another company: 43,896,000,000 won, stated as $30 million, for 264,000,000 shares and a 99.99% stake in HS Hyosung India Private Limited. The stated purpose is diversifying polyester tire cord production into India. The correction moved the acquisition date forward from December 31, 2026 to August 31, 2026, reflecting completion of payment. The trade press reporting on the project puts the site at Nagpur in Maharashtra, 230,000 square meters, due to run by 2027.
So the capex cycle in the table above is not finished. There is at least one more plant coming, and its revenue arrives in 2027 at the earliest.
What I got wrong reading those two filings
The two percentages tripped me. The India filing states the investment as 3.79% of equity capital. The September 11 guarantee states 3.24%. I read them as one scale and briefly concluded that the guarantee was the smaller commitment of the two, which is nonsense on the face of the amounts: 43.9 billion won against 26.8 billion won.
Dividing each amount by its own percentage sorted it out. 43,896 divided by 0.0379 gives 1,158,206 million won, which lands within 0.0749% of this company’s 2024 year-end equity of 1,157,339 million. 26,764 divided by 0.0324 gives 826,049 million, within 0.0548% of the 2025 year-end figure of 826,502 million. The August filing is a correction, and a correction carries the scale of the original. It carries the old exchange rate too: 43,896,000,000 divided by $30 million is 1,463.20 won per dollar, while the September guarantee implies 1,338.20, a gap of 9.34%.
The rule I am taking from this: when a filing states a ratio, divide the amount by the ratio before quoting either, because the base is dated even when the filing is fresh. Measured on the 2025 equity base, the India payment is 5.31% of equity, not 3.79%.
Hyosung Advanced Materials Stock and the Path I Weigh Most
The path I give the most weight, roughly 50%
The India plant runs from 2027, the Vietnam carbon fiber line contributes from late 2026, and revenue per unit of plant recovers toward 1.8 or 1.9 by 2028 without ever returning to 2021 levels. In that world the recent operating recovery holds, and the market pays for an asset base while growth stays out of the price.
What makes me weight this one highest is the arithmetic of the build itself. Capex has already stepped down from 358,303 million won in 2023 to 222,204 million in 2025, while depreciation rose to 221,565 million. The two lines have nearly converged, which is usually what the end of a build phase looks like from outside. The India payment reopens that gap, but at $30 million it reopens it by a fraction of what 2023 and 2024 spent.
Where I am wrong, roughly 33%
Tire cord pricing holds through 2027 and the new capacity fills faster than I assume, so revenue per unit of plant recovers inside two years. Two Korean brokerages and a consensus page carry valuations well above the current quote, and if this path runs they were right and my caution cost me the entry.
The remainder, roughly 17%
Twelve points for a world where the new plant arrives into softer pricing and free cash flow stays negative through 2027. Five points for a world where the guarantee balance stops being a footnote, which would require something to go wrong at a subsidiary instead of at the parent.
Hyosung Advanced Materials Stock and What I Wrote on the Other Side
Everything below is either a way this piece could be wrong or something I could not confirm.
- Revenue per unit of plant penalizes any company mid-build. I said so above and I repeat it here because it is the strongest argument against the whole piece.
- I chose 2021 as the starting year. 2021 was near a cyclical peak for chemical fibers, and peak-to-present comparisons flatter the conclusion I reached.
- Property, plant and equipment on the balance sheet is a net book figure. Depreciation alone would lower it over time, so a rising figure understates gross investment and a falling one overstates disposal. I did not separate gross from net.
- Depreciation and amortization ran 221.6 billion won in 2025 against 180.5 billion in 2021. Some of the plant growth is simply capitalized spending outrunning that charge.
- The balance sheet page carries a March 31, 2026 date while the income statement page carries August 14, 2026. I used fiscal-year columns for every ratio in the comparison table to keep both sides on the same kind of window, but the most recent columns of those two pages do not describe the same moment.
- The five-year capex total is my addition of five reported lines. If any year restated, my total is stale.
- Guarantees are contingent. Comparing a contingent balance to book equity overstates the burden in any state of the world where nothing goes wrong.
- The September 11 subsidiary carries 475.9 billion won of assets against the $20 million guaranteed. On its own numbers that unit does not look fragile.
- I did not read the other four guarantee filings in full. I counted them and read one.
- I could not open the Korean exchange filing viewer directly; the disclosure text I used came through a third-party mirror of the same filings.
- I did not read the NH Investment or iM Securities reports in the original. The NH valuation came through a Korean press summary, and the iM figures came from a copy of the firm’s April brief.
- iM Securities published a 300,000 won valuation on April 28, 2026. NH Investment published 260,000 won on June 29, 2026, down from 320,000 won in April. A Korean consensus page shows 275,000 won. All three levels sit far above the current quote.
- That NH move was downward, which cuts the other way, but the level is still well above where the shares trade.
- iM Securities models 2026 operating profit at 213 billion won against 157.4 billion in 2025. If that lands, the operating recovery is real regardless of my asset ratio.
- Second-quarter 2026 operating profit came in at 77.6 billion won, up 32.09% year over year, on revenue of 952.7 billion won, up 13.01%. The direction is up.
- Korea’s National Pension Service reported 307,690 shares as of August 20, 2026, up from 262,362, filed September 1. The largest domestic institution was adding while I was writing a cautious piece.
- The 50% global share in polyester tire cord is the company’s own claim, echoed by a trade outlet. I did not verify it against an independent market study.
- The India project figures come from a single trade publication and the company’s own filing. There is no second independent account of the site size or the 2027 date in what I read.
- iM Securities wrote that the Chinese carbon fiber line restarted in the first quarter of 2026 and that a Vietnamese line was due in the third quarter. I did not confirm either from a company release.
- The carbon fiber losses I cited are segment figures from a brokerage model. Audited segment disclosure is a different thing.
- Hexcel serves aerospace, which is a different demand cycle from tires. Putting the two on one ratio is defensible only because I limited the comparison to that ratio.
- Second-quarter figures are provisional. The company’s own filing says the audit review was incomplete.
- The 2025 acquisition is unnamed in this piece. If the acquired business carries revenue that is already in the 2025 top line, my revenue-per-plant reading is slightly harsher than it should be.
- Goodwill of 62,962 million won sits on a March 31, 2026 balance sheet. A later write-down of that figure would hit earnings without touching the plant argument either way.
- Depreciation is a real offset to the capex total, and I did not build a gross-asset roll-forward to separate maintenance spending from expansion spending. That separation is the single piece of work that would most improve this analysis.
- My conclusion is not that the business is bad. It is that I cannot yet tell whether the asset base is early or unproductive, and those two look identical from outside until revenue arrives.
What Would Change My Mind, and the Sentence I Hesitated Over
Seven conditions, ordered by which one answers first:
- Third-quarter 2026 free cash flow turns positive for the first time since 2022.
- The third-quarter report shows capex running below depreciation, which would mark the end of the build phase.
- The cumulative guarantee balance stops rising, measured against the 1.63 trillion won figure filed on September 11, 2026.
- Revenue per unit of plant, computed the same way on the third-quarter balance sheet, clears 1.70.
- The India entity draws a further equity injection or a new guarantee in the fourth quarter of 2026, which would tell me the 43.9 billion won was a first installment in substance.
- The Vietnamese carbon fiber line is confirmed running in a company release instead of in a model.
- The 2026 full-year operating profit lands within 10% of the 213 billion won a brokerage put on it.
If the first two clear together, I move this from watch to work. If only the third clears, nothing changes, because a guarantee balance that stops growing is not the same as one that shrinks.
The sentence I hesitated over longest is the one comparing the guarantee balance to equity. I nearly cut it. Guarantees behind operating subsidiaries that hold real assets are ordinary trade finance, and putting a contingent figure next to book equity is the kind of move that makes a cautious piece look better argued than it is. I kept it because five filings in eight days is a fact about tempo, and tempo is the part I can actually observe from here. Size is a separate question. If Hyosung Advanced Materials stock is going to be repriced on anything I have written, I would rather it be on the revenue the plant produces than on a number I put next to equity for effect.
Prices and market value reflect the September 18, 2026 close. Dollar figures are approximate, converted at 1,380.39 won per dollar, the September 17, 2026 Seoul close reported by Investing.com; no September 18 row was published there. Financial statement figures come from stockanalysis.com, sourced to S&P Global Market Intelligence, with the balance sheet page dated March 31, 2026 and the income statement page dated August 14, 2026. Brokerage figures are drawn from a Korean press summary of the NH Investment note and from a copy of the iM Securities brief; consensus levels are from a Korean market data page. Ratios, five-year totals and currency conversions were computed by me.
Related reading