Sajo Daerim Stock Yields 0.90%: Insiders Spend Triple That
- Out: five fiscal years of consolidated dividends paid came to KRW 15.73 billion, roughly USD 11.39 million.
- In: two fiscal years of proceeds recorded under common stock issuance came to KRW 58.26 billion, roughly USD 42.20 million.
- Out: the largest holder filed on July 30, 2026 to spend KRW 4.10 billion, roughly USD 2.97 million, buying the stock.
- In: the dividend declared for fiscal 2025 comes to KRW 2.29 billion at most, roughly USD 1.66 million, and 73.63 percent of that goes to the controlling group.
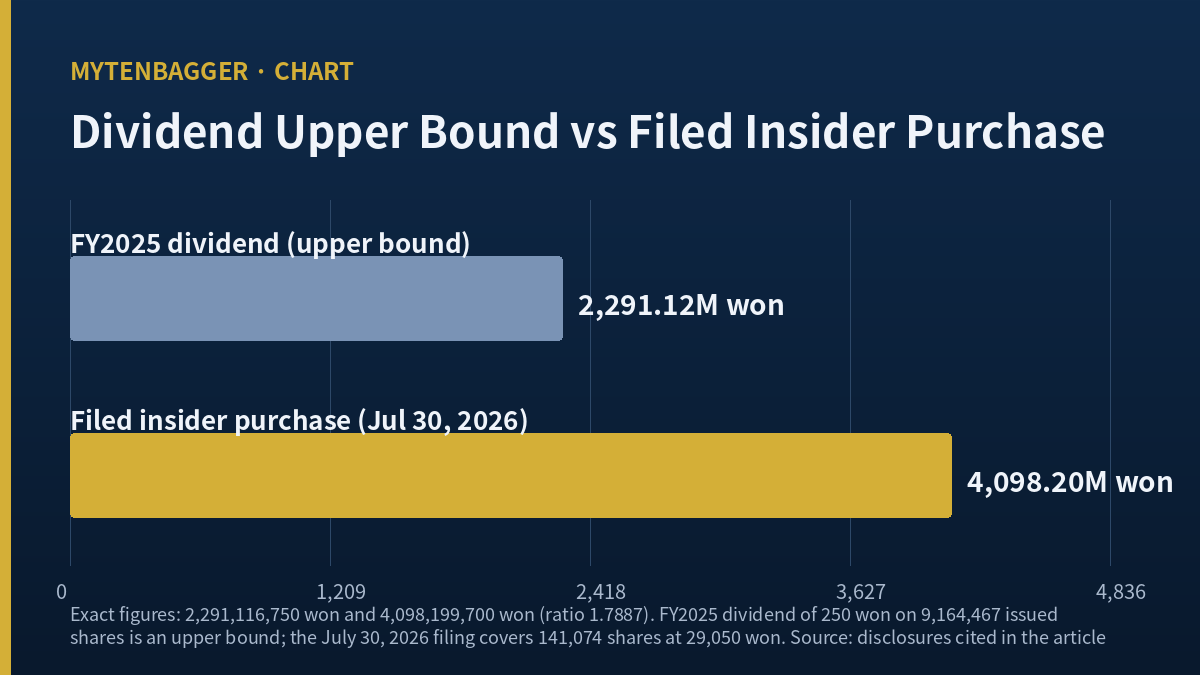
One number is what this company handed its shareholders for the 2025 fiscal year: 250 won a share, which against a closing price of 27,750 won works out to a yield of 0.9009 percent. The other number is what its largest shareholder told the exchange it intended to spend buying the same stock in a nine-session window: 4,098,199,700 won for 141,074 shares at 29,050 won each. I put those two figures side by side, divided one into the other, and got 1.7887. That ratio is why I spent an evening on Sajo Daerim stock, a KOSPI-listed food company I do not own and have placed no order in. KOSPI is Korea’s main exchange board, roughly what the NYSE composite is to a US investor, and this name sits far down it at a market capitalization of 254.3 billion won, about USD 184.2 million.

Contents
What Sajo Daerim Stock Paid Out Over Five Years
The dividend history is short enough to hold in one hand. Per share, by the fiscal year the dividend belongs to: 200 won for 2020, 300 won for 2021, 350 won for 2022, 350 won for 2023, 300 won for 2024, and 250 won for 2025. The 2025 dividend went ex on December 29, 2025 and was paid on April 21, 2026. So the payout per share is down 28.5714 percent from its 2022 and 2023 peak, across a stretch in which the top line went the other way entirely.
On the cash flow statement, consolidated dividends paid run 2,029 million won for fiscal 2021, 4,091 million for 2022, 3,016 million for 2023, 3,506 million for 2024 and 3,084 million for 2025. Five years add to 15,726 million won, about USD 11.39 million. I want to be careful about what that line is: it is a consolidated figure, so it includes dividends that listed subsidiaries paid to their own minority holders, and I could not separate the parent’s own payment out of it. Against five years of operating cash flow adding to 514,124 million won, the payout comes to 3.0588 percent by my calculation.
Taken on its own, that is simply a low-payout company, and there are hundreds of those. What made me keep reading was the line immediately below it.
The Treasury Shares Went the Other Way
Three sales in a single year, and who was on the other side
The financing section shows proceeds recorded under issuance of common stock: 9,843 million won in fiscal 2023, 38,741 million in 2024 and 19,514 million in 2025. The 2024 and 2025 figures alone come to 58,255 million won, about USD 42.20 million. That is 3.7044 times the entire five-year dividend outflow above.
Korean press reporting fills in what those proceeds were. Ilyo Sisa, writing in January 2025, described three disposals of treasury stock during 2024 that raised about 38.9 billion won in total, roughly USD 28.18 million, covering somewhere near 685,000 shares, which the same report put at about half the treasury holding. The buyers were named: an affiliate, Sajo Systems, at 57,700 won a share on August 6; another affiliate, Sajo Seafood, at 59,600 won on August 20; and the group’s vice chairman, Joo Ji-hong, at 43,750 won on December 26. That last purchase came to about 3,714,875,000 won, of which the report put the buyer’s own cash at 18,750,000 won and borrowings at about 3.7 billion, which is 99.4953 percent debt-funded by my arithmetic. The same report gave a total issued share count of 9,168,247 and a remaining treasury holding of 7.95 percent, or 729,006 shares, with related parties holding 64.63 percent.
Every item in that paragraph comes from Korean press reporting; I did not open the underlying filing. The disposal decisions themselves are exchange documents I could not reach directly, so the share counts and per-share prices here carry that limitation with them.
A treasury-share line I took at face value
A treasury-share line is what tripped me. When I first went through the financing section I read “issuance of common stock” as exactly that, new shares issued for cash, and I started building a dilution argument on top of it. Two or three numbers were about to go into that argument before I noticed the issued share count barely moved while the weighted average count climbed. New shares would have moved both. Selling shares the company already held would move only the second one. The financing line was a treasury disposal wearing an issuance label, and the entire dilution argument I had started was the wrong argument about the right money.
What I took from it: when a financing line and a balance sheet line disagree about whether shares were created, the balance sheet is the one telling me what happened, and the label on the financing line is a category name and not a description of the event. I now check the issued count first and read the financing label second.
Sajo Daerim Stock Is Being Accumulated by Its Largest Holder
The filing prints both the count and the price
On July 30, 2026, Sajo Industries filed a trading plan covering its holding in this company. The filing states a current holding of 1,439,381 shares at 15.70 percent, a planned purchase of 141,074 shares at 29,050 won, a transaction value of 4,098,199,700 won, and an expected post-purchase stake of 17.28 percent. The planned window ran from August 31 to September 10, 2026. Multiplying the count by the price gives exactly the stated value, which is the kind of internal agreement I look for before quoting a filing. Dividing the planned holding by the issued share count of 9,164,467 gives 17.2455 percent on my own arithmetic, a shade under the filed 17.28 percent, which tells me the filer counted against a marginally different share base.
The same filing discloses six months of prior buying: 90,000 shares for 2,546,876,300 won, an average of 28,298.6 won a share. Two reports bracket that stretch. A June 25, 2026 filing had the holding at 1,375,748 shares and 15.01 percent, up from 1,352,907 shares and 14.76 percent. So the stake moved 14.76, then 15.01, then 15.70, then a filed intention to reach 17.28. This is accumulation with a paper trail behind every step, and no single opportunistic block would leave that sequence.
There is a second number that changes how I read it. An April 2026 disclosure put the combined holding of the largest shareholder and related parties at 73.63 percent. Applied to the fiscal 2025 dividend, the controlling group receives about 1,686,949,263 won of the at-most 2,291,116,750 won that leaves the company, by my calculation.
Dividend Money Set Beside Insider Money
Here is the comparison, with every input stated. The fiscal 2025 dividend of 250 won a share, applied to the full issued count of 9,164,467 shares, gives 2,291,116,750 won. That is an upper bound and sits above the actual payment, because treasury shares draw no dividend and I could not establish the current treasury holding. The July filing’s planned purchase is 4,098,199,700 won. The ratio is 1.7887. Add the six months of disclosed prior buying and the insider total reaches 6,645,076,000 won, or about USD 4.81 million, which is 2.9004 times that upper bound.
One more figure belongs here because it sets the size of what is left. With related parties at 73.63 percent of a 9,164,467 share count, the shares outside that group come to roughly 2,416,670, or about 67.06 billion won at the closing price, which is around USD 48.58 million. The six months of disclosed buying plus the filed plan, 6,645,076,000 won together, equals about 9.91 percent of that remaining value by my calculation. A buyer working through a float that size moves it, and the average paid over those six months, 28,298.6 won a share, already sits 1.98 percent above the September 18, 2026 close.
Stretch it back one more step. The roughly 38.9 billion won that came in through the 2024 treasury disposals is 12.1226 times the fiscal 2023 dividend, taking that dividend at 350 won on the 9,168,247 shares the same report cited. So across a three-year window the company’s own shares moved toward affiliates and an executive for cash, and the cash paid back out to all holders was a small fraction of the cash received.
I am not claiming this is improper. Everything above is filed or reported, and a controlling family buying its own listed company on the market is, on its face, the behavior of the holder with the most information. I am recording that the direction of value transfer at this company runs mainly through the share register and only marginally through the dividend, and that anyone looking at the 0.90 percent yield as the shareholder return is looking at the smaller channel.
For what a capital allocation trail looks like when the spending stays inside what the business earns, I wrote up a larger Korean seafood name whose investment outlays track its own operating cash. And for how thin the economics are in the foodservice distribution business this company bought into, there is a listed distributor whose operating margin sits where the whole industry’s does.
The branch I weight more heavily
Retained earnings moved from 340,391 million won at the end of fiscal 2021 to 501,058 million at the end of fiscal 2025, an increase of 160,667 million or 47.2007 percent. Across those same five years the declared dividend per share went from 300 won to 250 won, down 16.6667 percent. The five-year consolidated dividend outflow of 15,726 million won equals 9.7879 percent of the retained earnings that accumulated over the same stretch, and the fiscal 2025 dividend upper bound of 2,291,116,750 won equals 0.4573 percent of the closing retained earnings balance.
The branch I weight more heavily is simply that those two lines keep pointing in opposite directions. Earnings retained inside the company keep building, the per-share payout keeps shrinking, and the channel that actually moves value keeps being the share register. Under this branch the fiscal 2026 dividend comes in at or below 250 won a share while the largest holder files another purchase, and the 1.7887 ratio at the top of this piece widens instead of closing.
The branch where I am wrong
Book value per share rose from 57,571.86 won at the end of fiscal 2021 to 72,932.94 at the end of fiscal 2025, and 75,853.47 at the most recent balance sheet date of March 31, 2026, an increase of 31.7544 percent over the five-year span. Total equity rose 53.2432 percent, from 519,013 million won to 795,352 million. That retained value is real and it belongs to every holder of the shares, and the group that has been buying them is one holder among all of them.
So the branch where I am wrong runs like this. A company that keeps equity per share compounding at that rate while trading at 27,750 won is holding something a payout policy could convert at any time. One buyback followed by cancellation, or a dividend restored toward the 350 won of fiscal 2022 and 2023, and the direction I described above reverses inside a single decision. I would rather be wrong that way than right in a way that needs nothing to change.
Sajo Daerim Stock and the Company That Sold It a Business
For a global comparison I picked on an unusual basis: the company that stood on the other side of this one’s largest acquisition. Ingredion, listed in New York under INGR, is the corn refining group whose Korean operation this company acquired, with the purchase price reported at about 341.4 billion won and payment made on February 1, 2024.
I am holding this comparison to one axis, and saying so in advance. I am not putting the two businesses, margins, multiples or growth rates in a table, because their disclosure scopes and reporting currencies differ and I did not verify that any operating figure means the same thing on both sides. The single axis is shareholder return, and only the published figures for it.
Ingredion’s dividend page shows an annual dividend of USD 3.28 a share, a yield of 3.33 percent, a payout ratio of 35.64 percent, a quarterly rate of USD 0.82, an ex-dividend date of July 1, 2026, and a share price of USD 98.63 as of September 14, 2026. Against this company’s 0.9009 percent, the seller of the asset yields 3.6963 times what the buyer of the asset yields. Its payout ratio is a defined number; this company’s is not, because the earnings line it would divide into is negative.
That is the whole peer comparison. One axis, both sides published, no attempt to say which business is better.
What I Left Out of Sajo Daerim Stock
Values I could not stand behind
Book value per share came back as 75,853.47 won at one source, and three other screens implied 73,026, 61,910 and 54,804 won through their own stated price-to-book figures of 0.38, 0.45 and 0.51. Four different equity bases sit under one ratio, so I used none of them. The 52-week low came back as 23,200 won at one source and 25,150 at another, so no low-to-current return appears here. One vendor printed a September 18, 2026 price of 27,250 won against 27,750 at two others, and I took the figure the two agreed on while recording that choosing among three was my decision.
One thing I checked that did hold
The issued share count closed properly. Book value per share of 75,853.47 won multiplied by 9,164,467 shares gives 695,156,622,650 won, which sits below total equity of 795,352 million won for fiscal 2025 by an amount consistent with a non-controlling interest, and the market capitalization of 254,313,959,250 won reproduces exactly from the closing price times the same share count. Three uses of one share count, all closing, is what let me quote per-share figures at all.
Twenty-Four Ways This Could Be Wrong
- The dividend total of 2,291,116,750 won is an upper bound and sits above any actual payment. Treasury shares draw nothing and I could not establish the current treasury count.
- If the treasury holding is still near the 729,006 shares reported for early 2025, the real dividend is roughly 8 percent smaller and every ratio built on it grows.
- That would strengthen my reading, which is a reason to distrust my comfort with it.
- The consolidated dividends-paid line includes subsidiary payments to minority holders, so the five-year total of 15,726 million won overstates what this company itself paid.
- I could not split that line, and the split would change the 3.7044 ratio.
- The 3.7044 ratio compares five years of dividends with two years of treasury proceeds. The windows are deliberately different lengths and I chose them.
- Matching windows year for year would give a different and probably smaller number.
- The treasury disposal details come from Korean press reporting, and I did not read the filings behind them.
- The issued share count differs between sources: 9,168,247 in the January 2025 report against 9,164,467 now, a gap of 3,780 shares I did not explain.
- An insider buying is conventionally read as a positive signal, and my framing treats the same fact as evidence about where value moves.
- Both of those views can hold at the same time, which means this section settles nothing in either direction.
- A controlling group at 73.63 percent has a governance reason to buy that has nothing to do with valuation.
- The planned purchase window of August 31 to September 10, 2026 has closed and I do not know how much was actually bought.
- My own stake arithmetic of 17.2455 percent disagrees with the filed 17.28 percent, so at least one share base here is not what I think it is.
- The Ingredion comparison uses one axis by design, and a one-axis comparison can flatter either side.
- Ingredion’s payout ratio of 35.64 percent rests on positive earnings; comparing it with an undefined ratio is close to comparing a number with an absence.
- The single named Korean brokerage view I found, from Hana Securities in July 2024, called the stock deeply undervalued, and I did not test whether that case has been invalidated.
- That same July 2024 note put fiscal 2024 operating profit at 191.8 billion won against an actual outcome between 125.4 and 133.0 billion depending on source, so the one forward view on record was wrong in the same direction I am leaning.
- No brokerage forward estimate is on the consensus screen now. The estimate count is effectively zero and I am reasoning without any forward anchor.
- Price to sales is 0.0716 times. For a reader who weights that single figure, everything above reads as noise.
- Revenue for fiscal 2025 came in at 1.9297 times the fiscal 2021 figure. The acquisitions bought real volume and this piece does not dispute that.
- Operating profit for the twelve months to June 2026 was still positive at 91,566 million won.
- Quarterly figures do not add to the annual ones at the source I used: revenue by 1,784,959,000 won and net income by 6,111,126,671 won. I left quarterly data out of the argument for that reason.
- The exchange rate here is a single close from the day before the price date, so every USD figure in this piece is an approximate restatement and not a measurement.
What Would Bring Me Back to Sajo Daerim Stock
Six things, ordered by which one answers soonest instead of by which matters most.
- The next major-holder report from Sajo Industries. It states how many of the planned 141,074 shares were actually bought in the closed window, and that is the fastest test of whether the filed intention was real.
- The treasury share count in the Q3 2026 report. Without it the 2,291,116,750 won upper bound cannot become an actual figure.
- Any further treasury disposal. A fourth sale to an affiliate would make the pattern a policy instead of a single year.
- The fiscal 2026 dividend decision. A cut below 250 won a share while insider buying continues would settle which channel this company actually uses.
- Whether the combined related-party stake moves past 75 percent. Korean listing rules put a distribution floor on free float, and a group already at 73.63 percent is not far from having to stop.
- Any buyback and cancellation, as opposed to a disposal. That would be the first move in the opposite direction and would make this whole piece the record of a phase that ended.
All six could come back favorable and I would still wait one more report before doing anything. A company whose share register has moved this much in three years is one where I want to see a new direction hold for another report before I treat it as settled.
If someone opens this piece a year from now, the paragraph that will have aged first is not the dividend history. Those six per-share figures will read the same in 2027. The paragraph that will have aged first is the one about the July filing, because the window it describes has already closed and one report will replace my arithmetic with a count. The second to age will be the peer section, since a yield comparison is a price comparison in disguise and both prices move. What I would keep is the method: check the issued share count before believing a financing label, and check which channel the money actually uses before calling a yield the shareholder return.
Prices and ratios reflect the September 18, 2026 close of 27,750 won. USD figures are approximate, converted at 1,380.39 won per dollar, the September 17, 2026 close, rounded from the source table; the September 18 row was not published at that source. Every multiple I worked out myself is labeled in the text where it appears. Sources: the cash flow statement and balance sheet at stockanalysis.com, Investing.com dividend history, Chickstock, Kokstock, Ilyo Sisa, the July 30, 2026 trading plan filing, Ingredion’s dividend page, the Hankyung consensus screen and Investing.com USD/KRW history. I hold no position in this company.