BHI Stock: Priced at 10.45 Times a Book That Is Nine Months Old
I went looking for a page that does not exist. When I want a quick, comparable read on a listed industrial, I pull the statistics page from a US screening site, because every company on it is presented the same way. It has one for GE Vernova. It has one for Mitsubishi Heavy Industries in Tokyo. It does not have one for BHI stock. The KOSDAQ ticker 083650 returns a 404 there, while KOSPI names return normally. So the fourth row of the table below is the only row I assembled myself, out of Korean regulatory filings and a Korean vendor screen. I do not own this company and I have not placed an order. What follows is the arithmetic I did before deciding that.
| What I checked | What I found |
|---|---|
| Which book the multiple divides | 10.45 is the September 4, 2026 price over the December 2025 equity per share. Against the June 30, 2026 balance sheet the same price is 9.20. |
| What the comparison cost | Three rows came off one screen on three different dates. The fourth had no page at all, so I built it from filings and said so in the table. |
Contents
Four builders of the same machine, and what BHI stock costs against book
BHI Co Ltd makes heat recovery steam generators, the boilers that sit behind gas turbines in combined cycle power plants, plus condensers and desalination equipment. Its customers are engineering contractors building power stations, mostly in the Middle East. That puts it in the same industrial family as three names I can price on a common screen.
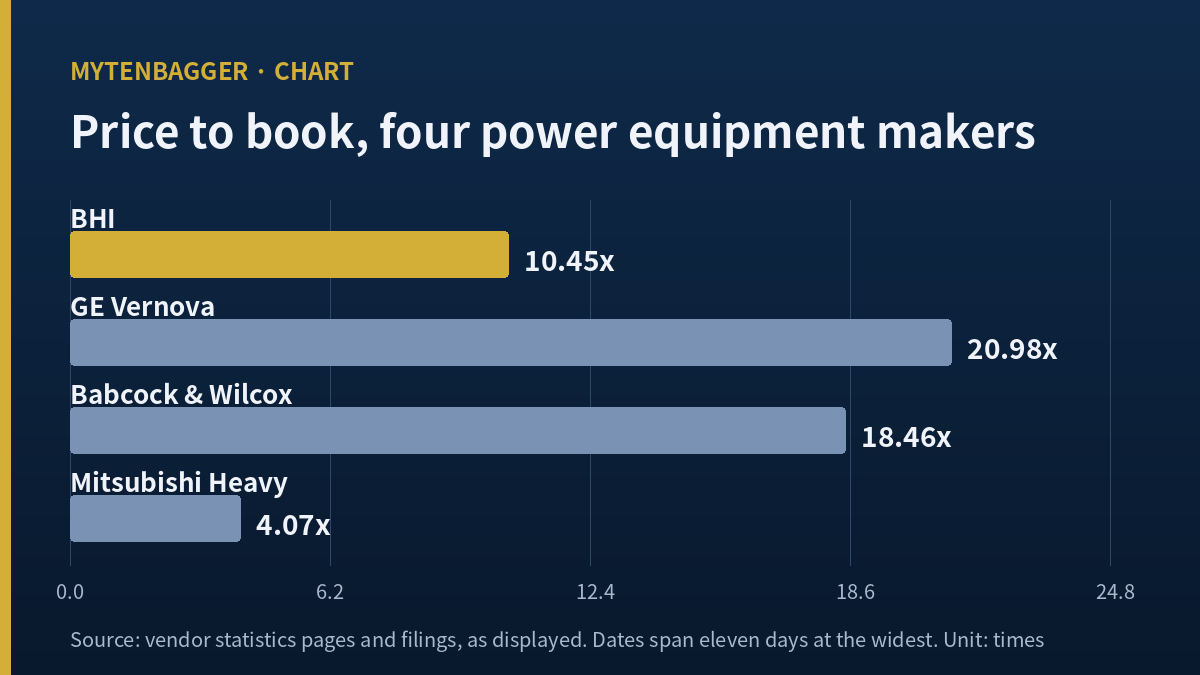
| Company | Revenue (as displayed) | Market value (as displayed) | Price to book | Source and date |
|---|---|---|---|---|
| BHI (KOSDAQ 083650) | KRW 1.05tn | KRW 1.86tn | 10.45 | Korean filings plus vendor screen, Sep 4, 2026 |
| GE Vernova (NYSE GEV) | USD 41.37bn | USD 250.87bn | 20.98 | US screen, updated Sep 6, 2026 |
| Babcock & Wilcox (NYSE BW) | USD 834.35m | USD 1.06bn | 18.46 | US screen, updated Sep 5, 2026 |
| Mitsubishi Heavy (TYO 7011) | JPY 5.13tn | JPY 13.17tn | 4.07 | US screen, updated Aug 26, 2026 |
Three things about this table before anyone leans on it. The revenue column is in three currencies and I did not convert it, so it sets scale and nothing else. The dates are eleven days apart at the widest, and each vendor page carries its own stamp. And the book multiples were computed by four different parties against four different balance sheet dates, which is exactly the problem I take up next.
I once treated a consensus number as if it were my own work
Years ago I held a Korean industrial through a bad stretch, and the sentence I kept repeating to myself was that the average sell-side objective sat well above the price. I never opened a single one of those notes. When the objective came down, I had nothing of my own to fall back on, because the entire position rested on other people’s confidence, with no figure of my own underneath it.
That is why I now insist on rebuilding at least one number per company by hand. For this company the rebuilt number is book value per share, and rebuilding it turned out to matter more than I expected.
The book that BHI stock is divided by is nine months old
The Korean vendor screen shows book value per share of KRW 5,739 and a price to book of 10.45 at the September 4, 2026 close of KRW 60,000. I wanted to know which balance sheet that 5,739 came from, so I divided the company’s reported equity by its share count.
- Owners’ equity at December 31, 2025: KRW 177.57bn. Divided by 30,944,375 shares, that is KRW 5,738.5 per share. The screen’s 5,739 is that number.
- Owners’ equity at June 30, 2026: KRW 201.91bn. Divided by the same share count, KRW 6,524.9 per share.
- KRW 60,000 over KRW 6,524.9 is 9.20 times book, by my calculation, against 10.45 on the December figure.
So the multiple everyone quotes divides by a balance sheet from nine months before the price. That is not an error on the vendor’s part; annual book is what this field conventionally divides by. It does mean the headline multiple lags a company whose equity is compounding quickly, and this one is compounding quickly: KRW 49.54bn at the end of 2022, KRW 73.70bn in 2023, KRW 116.45bn in 2024, KRW 177.65bn in 2025, KRW 201.98bn in total equity at June 30, 2026. That last figure is 4.08 times the 2022 one, by my calculation.
Put that beside the table above and the ranking survives but softens. On the December book, BHI sits third of four. On the June book it sits third still, and the room between it and Mitsubishi Heavy’s 4.07 narrows by more than a full turn. I did not put the 9.20 in the comparison table, because the other three rows are not recomputed on their own latest balance sheets either, and a table where one row gets special treatment tells you about the author instead of the companies.
A revenue field that says trailing and means something else
The same screen reports revenue of KRW 774.1bn and labels the basis as trailing. That figure is the audited 2025 full-year revenue, to the won. The actual last four reported quarters are KRW 204.70bn, KRW 264.85bn, KRW 280.79bn and KRW 296.27bn, which add to KRW 1,046.61bn, or roughly USD 775m. I used my own sum in the table and flagged it there.
This is the kind of thing that only shows up if you add the quarters. The true sum runs 35.2 percent above the reported field, and a scale column being that far off leaves my view of the company where it was. It does quietly change any per-revenue ratio computed off that field, and I have been caught by exactly that sort of substitution before.
What the balance sheet behind BHI stock actually looks like
KOSDAQ is South Korea’s secondary market, roughly analogous in role to a growth board sitting beside the main KOSPI exchange, and it is where this company lists. The balance sheet is the part a US reader should look at hardest, because it does not resemble the ones behind the other three names in my table.
| Year end | Total equity | Liabilities to equity |
|---|---|---|
| 2022 | KRW 49.54bn | 807.13% |
| 2023 | KRW 73.70bn | 477.25% |
| 2024 | KRW 116.45bn | 350.66% |
| 2025 | KRW 177.65bn | 367.65% |
| June 30, 2026 | KRW 201.98bn | 444.61% |
Total assets at June 30, 2026 were KRW 1,100.00bn against liabilities of KRW 898.02bn. I checked the ratio myself: 898.02 divided by 201.98 gives 444.6 percent, so the field is computed on consolidated totals and not on the owners’ share. The direction from 2022 to 2024 is a company deleveraging as it grows into its own balance sheet. The direction since is the opposite, and the reason is worth stating plainly: an engineering contractor takes customer advances and contract liabilities onto the same line as borrowings, so a rising ratio here can mean more work booked as easily as it can mean more debt. I could not separate the two from the summary figures I have, and I am not going to pretend the ratio alone settles it.
Cash tells a friendlier story than the ratio does. Operating cash flow in the first half of 2026 was KRW 67.19bn against KRW 32.45bn a year earlier, and free cash flow KRW 54.15bn against KRW 22.18bn, or roughly USD 49.8m and USD 40.1m at the exchange rate in the footnote.
Why the order flow explains the multiple on BHI stock
On September 2, 2026 the company disclosed a KRW 145.3bn contract to supply heat recovery steam generators for a Kuwaiti power and desalination plant, for Tie Jun International, a project company of the global contractor SEPCO-3 (Gyeongnam Ilbo, in Korean). In May it took a KRW 57.5bn order for one 850MW unit at Israel’s Eshkol plant, following an earlier award at Zafit, with the two together reported above KRW 120bn (Newspim, in Korean). Korean coverage of the Kuwait award counted ten Middle East projects over two years across Saudi Arabia, Qatar, Kuwait and Israel.
Second quarter results, reported on August 14, 2026, showed an operating margin of 15.4 percent, described in Korean press as a quarterly record, on revenue up 75 percent year on year (Etoday, in Korean). Kiwoom Securities analyst Cho Jae-won had modelled 2026 revenue of KRW 952.3bn and operating profit of KRW 109.5bn back in January (Edaily MarketIn, in Korean). IBK Investment and Securities analyst Kim Tae-hyun carried a KRW 140,000 valuation on the name in a May 28, 2026 note, on a buy rating (Newspim, in Korean). I read none of these reports in the original; each reached me through Korean press coverage, and the consensus figures come off a vendor aggregation page, which is no report at all.
The demand story behind all of it is the same one driving power equipment orders everywhere: gas turbines for data center and industrial load. I wrote separately about how far that story can actually be pushed in Korea, where grid connection approvals are the binding constraint. This company is not exposed to that particular bottleneck, because its plants are being built in the Gulf and in Israel, a long way from the Korean grid. I have also been buying into a Korean tower maker on a related thesis, and the difference is instructive: that one’s margin turns on a US subsidy regime, while this one’s turns on product mix.
The earnings multiple divides the same December statements
Once I had established which balance sheet the book multiple used, I went and did the same thing to the other headline ratio. The Korean vendor page reports earnings per share of KRW 2,107 and a price to earnings figure of 28.48. Full year 2025 net income was KRW 65.20bn. Divided by 30,944,375 shares that is KRW 2,106.9, and KRW 60,000 over KRW 2,107 is 28.48. Both fields, then, are computed on the December 2025 accounts.
I find that worth stating in plain language, because it means the two numbers most often quoted about this company describe the same twelve months, and those twelve months ended before either of the two quarters that changed the business. The price in the numerator is from September 2026. The figures underneath are from the previous December. Nobody is doing anything improper here; annual accounts are the conventional input for both fields. But an investor who reads 28.48 and 10.45 as a description of the company as it stands today is reading a photograph taken nine months ago.
The vendor page also carries forward estimates from the two contributing houses. Their 2026 estimate is earnings per share of KRW 3,257, which puts the multiple at 18.42. The rolling twelve month forward figure is KRW 4,002 per share, at 14.99 times earnings and 4.94 times book. That last one is the interesting one. At an unchanged price of KRW 60,000, a book multiple of 4.94 implies book value per share of about KRW 12,146, and across 30,944,375 shares that is equity of roughly KRW 375.9bn, by my calculation. Which is to say the forward book multiple already assumes the balance sheet nearly doubles again from its June 2026 level. I did not build those estimates and I would not defend them; two houses did, and this is what their number quietly contains.
Four quarters, each one larger than the last
The quarterly revenue sequence behind all of this runs KRW 204.70bn, KRW 264.85bn, KRW 280.79bn and KRW 296.27bn for the four periods ending June 2026. The most recent is 1.45 times the earliest, by my calculation, and each step is upward. Four consecutive quarters of sequential growth in a project business is not a trend I would extrapolate, because delivery timing is lumpy and a single large unit shipping a month early or late moves a quarter. It does tell me the order book converted into revenue without a stall over the past year.
One more field closes the loop on my complaint about vintages. The screen reports return on equity of 44.4 percent. Full year 2025 net income of KRW 65.20bn against the average of the 2024 and 2025 closing equity figures, KRW 116.45bn and KRW 177.65bn, gives 44.3 percent. So that field is computed on average equity across the year, which is the orthodox method and also a third distinct base. Three of the most quoted ratios on this company therefore rest on the 2025 accounts or on an average of them, while the company itself has reported twice since.
A fourth basis, and the one I decided to leave alone
There is a coverage field on the same page reading 1.02, and it is the only ratio here that runs on current numbers. First half 2026 operating profit of KRW 80.81bn over the financing cost line of KRW 79.58bn in the same half year gives 1.0154, which rounds to the 1.02 on the screen. So I know the period it covers. What I do not know is what sits in the lower half of it. Korean filings let a company report a pure interest expense line or a broader financing cost line that also carries derivative and currency losses, and the two produce very different coverage figures for the same borrower. The vendor documentation says as much and flags the basis as undetermined for this company.
I could have used 1.02 as the alarming number in this piece, and it would have been an easy paragraph to write. I left it out of my reasoning instead, because a ratio whose lower half I cannot name is not evidence, it is a prompt to go and read the notes to the financial statements, which I have not yet done.
None of that makes the ratios wrong. It makes them slower than the business, which for a company growing at this rate is a difference worth holding in mind before treating any single multiple as a verdict.

Seven reasons I have not bought BHI stock
- A convertible bond of KRW 20bn remains outstanding with a conversion price of KRW 4,045. Full conversion adds 4,944,376 shares to 30,944,375, a 15.98 percent increase by my calculation, and the conversion price is 6.74 percent of the September 4 close. Every per share figure above would need redoing. This detail comes from a Korean outlet’s reading of the annual report (Daily Union, in Korean); I did not open the filing itself.
- The same report puts 2025 trade receivables at KRW 110.18bn against KRW 34.9bn a year earlier, a 215.7 percent rise on 91.26 percent revenue growth. Receivables outrunning sales in a contracting business pushes the cash back down the calendar.
- That outlet also counted seventeen amending disclosures attached to large contracts over the past year. I have not checked those seventeen individually. If contract values move after announcement, the order figures I quoted above are provisional too.
- Only two houses contribute estimates. The consensus objective of KRW 110,000 and the KRW 140,000 in the IBK note are not a market view; they are two opinions with a wide gap between them.
- The price to book of 10.45 is the third highest of four, but the company beneath it is the smallest by a wide margin and carries the most leverage of the four. Small and levered is the combination that reprices fastest when order flow pauses.
- The September 4 session traded 199,320 shares, about USD 8.9m at the close and the exchange rate below. There is no ADR, so a US investor reaches this only through a broker with direct Korea Exchange access, and the country funds that give Americans Korean exposure are weighted toward the large KOSPI names, which leaves out a KOSDAQ industrial of this size.
- I cannot separate customer advances from borrowings inside that 444.61 percent figure, which means the single scariest number in this piece is also the one I understand least.
Where I stand on BHI stock, and what would move me
I am watching and not holding. A KRW 1.86tn company, roughly USD 1,375m, is outside the range where I take positions in Korean names on this blog, and the leverage question above is unresolved on my side; the company has hidden nothing.
Three things would change the arithmetic I did here. If the third quarter book value per share puts the multiple below 9.00 without the price moving, the repricing has come from the company and not from the market. If the liabilities line falls while revenue keeps rising, the advances explanation was right and the debt explanation was wrong. If receivables grow slower than sales for two consecutive quarters, the second objection above dissolves.
And one condition sits apart from those three. The convertible would be the single largest change to every figure in this piece, and yet there is no routine screen that tells me how much of it has converted on any given day. Conversion happens claim by claim, and new shares list on a lag, so the share count I used could already be stale in a way no page I read would show. I have put a marker on that item in place of a threshold, because a condition I cannot observe does not belong on a list that is supposed to close itself.
Prices and multiples here reflect the September 4, 2026 close, checked at the time of writing. USD conversions are approximate, at roughly KRW 1,350.4 per dollar on that same date, and the Korean won is the reference currency throughout. Financial statement figures are consolidated, from Korean regulatory filings; the half year report is filing number 20260814000764. Peer figures are quoted in each company’s display currency exactly as the source page showed them, with the update date beside each row.