Daol Securities: The Profit That Survives Two Subtractions
Daol Investment Securities (KOSPI: 030210) reported a full-year 2025 net income of 43.85 billion won, and I wanted to know how much arithmetic stood between that number and the money the firm actually handled. The answer is two large subtractions, and both of them take away far more than they leave. I read the income statement downward from the top because at a brokerage the top is where the size of the business lives.
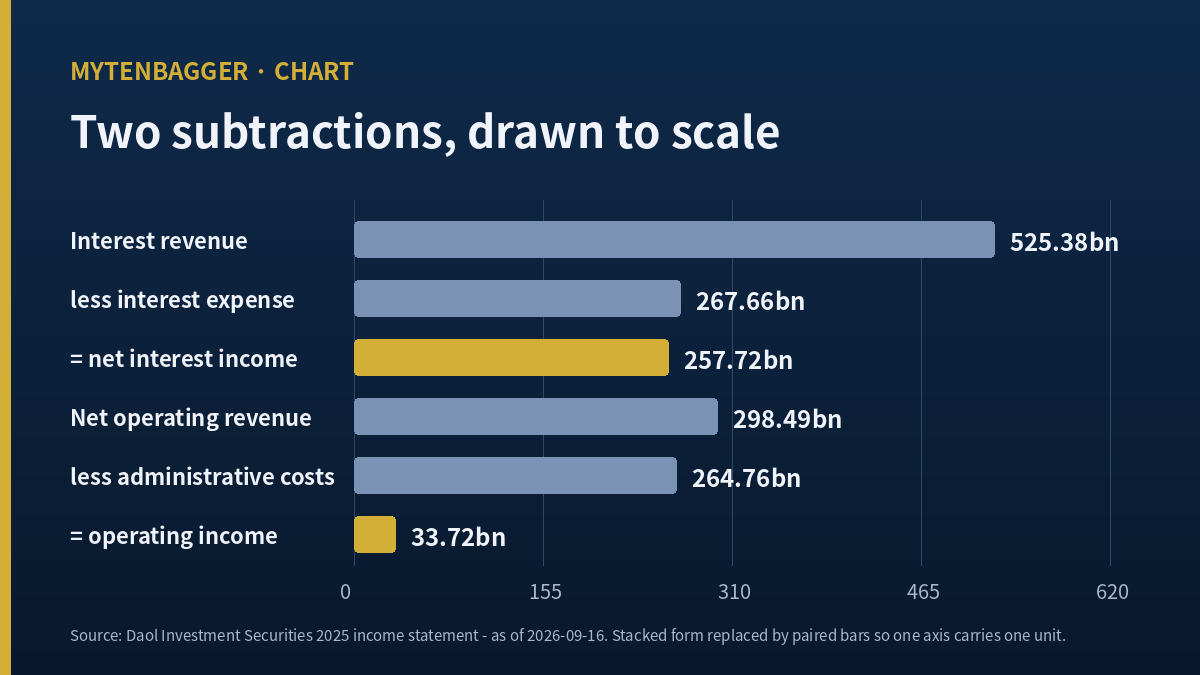
Here is the short version before the detail. Interest revenue of 525.38 billion won becomes net interest income of 257.72 billion won after interest expense. Net operating revenue of 298.49 billion won becomes operating income of 33.72 billion won after administrative costs. What survives both passes is roughly a ninth of what entered the first one, and in the first half of 2026 the parent company on its own kept a small fraction of what the consolidated group kept.
I hold no position here and I have no order working. This is a reading of one firm’s income statement, not a case for owning it.
Contents
What a Korean brokerage income statement puts at the top
A note on the shape of the statement, because it does not match what a US reader expects. Korean securities firms report interest revenue, fee revenue and gains on financial instruments as separate gross lines, then subtract the matching cost lines to reach a figure called net operating revenue. Administrative costs come off that to give operating income. So the statement contains two distinct netting steps before anything resembling an operating result appears, and the gross lines above them are an order of magnitude larger than the result.
The firm is listed on the KOSPI, the main board of the Korea Exchange, where the larger and longer established Korean companies trade, as distinct from the KOSDAQ board that carries smaller and newer names. It is a small company on that board. It was founded in 1981, received its comprehensive financial investment license in 2009, and consolidates an asset manager and a savings bank alongside the securities business.
Why I read Daol Investment Securities from the top down
A brokerage income statement invites you to read the last line and stop. I have learned not to, because the last line at a securities firm is a residue. The gross flows above it are large enough that a one percent move in any of them would swamp the result, and knowing which flow is doing the work tells you what the firm actually is.
So I took the 2025 fiscal year column and worked down it. I should say which column, because I read the same screen twice and the header labels did not sit the same way both times. I anchored on a figure confirmed outside the screen: Korean press reported the firm’s 2025 consolidated net income as 43.9 billion won, and only one column carries 438.5 in hundreds of millions of won. That is the column I used, and every figure below comes from it.
The first subtraction at Daol Investment Securities
Interest revenue for the year was 525.38 billion won. Interest expense was 267.66 billion won. The difference is 257.72 billion won, which is exactly the net interest income the statement prints, so the line reproduces.
What interests me is the ratio. Interest expense consumed 50.95 percent of interest revenue. For a firm this size that is the cost of carrying an inventory and a funding book, and it means the interest business roughly doubles its way down to a net figure. Net fee income of 111.81 billion won sits alongside it and is smaller.
Two comparisons make the size of the interest book clearer. Net fee income is 43.38 percent of net interest income, so lending and carrying inventory produce more than twice what broking and advisory produce at the net level. And interest revenue alone is 15.58 times the operating income the whole firm reported for the year. A brokerage of this shape is moving a great deal of money to keep a modest amount of it.
The second subtraction is the one that decides the year
Net operating revenue for 2025 was 298.49 billion won. Administrative costs were 264.76 billion won. Operating income was 33.72 billion won, and 298.49 minus 264.76 gives 33.73, which is the printed figure to within a rounding step.
Administrative costs took 88.70 percent of net operating revenue. Operating margin was therefore 11.30 percent. I keep coming back to that pair because it describes a fixed cost base sitting under a variable revenue line. If revenue falls ten percent and costs hold, the operating line does not fall ten percent. It falls by most of what is left.
The line below operating income runs the other way
Pre-tax income was 54.90 billion won, which is 21.18 billion won above operating income. Tax took 11.00 billion won, leaving net income of 43.85 billion won. So this firm earned 30.04 percent more after tax than it earned from operations, because non-operating items added more than tax removed.
I am wary of years shaped that way. The operating line is the part I can project; the non-operating line is the part I cannot. Of the 43.85 billion won, 3.33 billion won belonged to non-controlling interests, so the owners of the listed shares did not receive all of it.
Daol Investment Securities in the first half of 2026, twice
The 2026 interim numbers are where the reading gets interesting, because there are two of them and they disagree about how the business is doing.
On a consolidated basis the firm earned 32.2 billion won of net income in the first half, up 0.9 percent year on year, with operating income of 26.3 billion won and a second quarter contribution of 17.1 billion won. That is six consecutive profitable quarters, and it reads as steady.
On a parent-company basis the same half produced 5.8 billion won, down from 16.5 billion won a year earlier, a decline of 64.9 percent. The consolidated figure is more than five times the parent figure. The group’s subsidiaries, which include an asset manager and a savings bank, are carrying the result.
The two quarters inside the half
The half also splits unevenly. If the second quarter contributed 17.1 billion won of the 32.2 billion won, the first quarter contributed 15.1 billion won, so the second quarter was 13.2 percent larger than the first. That is a mild slope and I would not read a trend into two points. I note it because a firm producing roughly 16 billion won a quarter at the consolidated level is producing a number small enough that one desk swinging by 10 billion won, which is what happened below, can decide the direction of a whole half.
Which desks moved
Inside the second quarter the equity desk produced 32.3 billion won of net operating revenue, more than double the 16.0 billion won of a year earlier. Retail and platform went from 3.2 billion won to 7.5 billion won. Fixed income went the other way, from 17.2 billion won to 11.0 billion won. The investment banking desk swung from a 1.4 billion won profit to an 8.7 billion won loss, a move of 10.1 billion won in one line.
Korean coverage of the half framed the parent-level decline as the open question, and I agree with that framing. A group can look steady while the business that names it does not.
Two desks disagreeing inside one half is something I have looked at before at another Korean brokerage. The case where brokerage and derivatives moved in opposite directions was an arithmetic problem: the segments did not add to the reported total. This is not that. Here the segments are not in dispute. What splits is the reporting entity, and the two entities are both correct about themselves.
The balance sheet under Daol Investment Securities
At the end of June 2026 total assets were 10.40 trillion won, total liabilities 9.58 trillion won and total equity 825.71 billion won. Liabilities are 92.06 percent of assets, which puts leverage at 12.60 times equity. Six months earlier assets were 10.46 trillion won against equity of 807.07 billion won, or 12.96 times.
Two movements inside those six months are worth writing down. Equity rose by 18.64 billion won, or 2.31 percent, which is roughly consistent with a half year of retained profit at the observed rate. Total assets fell by 53.05 billion won over the same stretch. A balance sheet that shrinks slightly while equity grows slightly is how leverage came down from 12.96 to 12.60 without anything dramatic happening, and I prefer that explanation to any story about deliberate deleveraging, because the arithmetic covers it.
Real estate project finance exposure, the item that damaged Korean mid-tier brokerages through the middle of the decade, was 231.1 billion won at the end of June against 234.6 billion won at the end of the prior year, split into 176.0 billion won of project finance, 23.4 billion won of bridge loans and 31.7 billion won of other items. A Korean trade publication tracking the sector put the 2022 figure at 731.4 billion won and reported that the share of funding with maturities beyond one year moved from 34.3 percent to 65.5 percent over the same stretch. The direction is clear and the publication still called the normalization ongoing. Measured end to end, 731.4 billion won down to 231.1 billion won is a fall of 500.3 billion won, or 68.40 percent. I want to be careful with that percentage: the two endpoints come from two different publications, and I did not confirm that both are counting the same categories of exposure. A number computed across two definitions can be right about direction and wrong about size.
Three global peers with the same split between group and parent
I picked the comparison on one criterion: firms whose main business is securities but which consolidate a bank or a savings bank, so that the gap between group and parent exists for them too. Nomura Holdings carries liabilities equal to 94.15 percent of assets and leverage of 17.08 times. Daiwa Securities Group sits at 94.63 percent and 18.61 times. SBI Holdings sits at 93.70 percent and 15.87 times. Against those, this firm’s 92.06 percent and 12.60 times is the least levered of the four.
Now I will take some of that back. Nomura’s figures come from a trailing period ending June 30, 2026, which lines up with the Korean firm. Daiwa and SBI report to a March 31, 2026 balance sheet date, so two of the three photographs were taken three months earlier. I also did not open the composition of any peer’s liabilities, and at a securities firm a large share of liabilities can be client money or repo instead of borrowing. A lower ratio here may say something about business mix and nothing about caution.
What the Korean brokerage sector is doing around Daol Investment Securities
The sector had an unusually good first half. Korean brokerages together earned 8.9 trillion won, a record for a half year. That is the backdrop against which a 32.2 billion won result should be read, and against which the parent-level decline should be read too.
The same coverage carried a warning I took seriously: bond trading losses across the industry ran to 4.5 trillion won between the second half of 2025 and the first half of 2026. A record half and a large trading loss inside the same period tell you the result is being made by a small number of moving lines.
I tried to place this firm inside that 8.9 trillion won. Its consolidated half-year result of 32.2 billion won is roughly three thousandths of the industry total, which is about what a company of its size should be. The part that does not follow from size is the split: an industry earning a record half is an industry where the businesses that scale with trading volume are doing the earning, and at this firm the desk that scales with trading volume more than doubled while the parent-company line fell by almost two thirds. Both of those are true of the same six months.
The sector question of what shrinking share counts do to per-share value is one I looked at earlier this year at two smaller Korean houses. Those two were retiring roughly a third of their issued shares. This firm is not doing that, and the reason I am not treating the two cases as versions of one story is that share cancellation acts on the denominator while everything above acts on the numerator.
There is also a reading where the per-share figures themselves need checking before any of this matters. At another Korean brokerage the reported multiples and the market-cap multiples diverged because preferred shares entered the earnings but not the market capitalization. One explanation resolved both multiples there. I could not find a single explanation of that kind for this firm, and I say so instead of borrowing that one.
What I left out of this reading
- Every per-share figure on the screen. I could not settle which share count they use, so none of them appear above.
- The sector price-to-earnings figure the screen prints. I do not know which firms are in it or as of when.
- The fixed income desk’s position at the end of the half. I have the revenue move and not the book behind it.
Where Daol Investment Securities could prove me wrong
- I read the income statement and balance sheet from an aggregator, not from the filed statements.
- The aggregator’s column headers did not align the same way across two readings, so my column choice rests on one external anchor.
- I did not open the notes, where the non-operating gain of 21.18 billion won would be explained.
- I cannot say whether that non-operating gain recurs.
- Half-year segment figures come from Korean press coverage and not from a filed segment note.
- I did not confirm whether the parent-company figures are prepared on the same accounting basis as the consolidated ones.
- I did not open the subsidiary accounts, so I cannot say which subsidiary produced the gap.
- I did not confirm how much of the group result reaches the parent as dividends.
- Administrative costs are a single line to me. I did not see the split between compensation and everything else.
- I treated administrative costs as fixed when testing what a revenue decline would do. At a brokerage a large part of them is variable compensation.
- Project finance exposure figures are as reported in coverage. I did not see a filed schedule.
- I did not see loss provisions held against that exposure.
- The 2022 exposure figure and the funding maturity figures come from a single publication.
- Peer balance sheets come from one data provider.
- Two of three peer balance sheet dates precede the Korean firm’s by three months.
- Peer liability composition is unexamined, which is the weak point of the leverage comparison.
- Peer accounting standards were not reconciled.
- Sector aggregates cover all Korean brokerages and I did not isolate this firm’s share.
- No analyst estimate exists for this firm, so nothing in this reading has an outside number to check it against.
- I contacted no one at the company, its auditor or its competitors.
- My central claim is that the parent earns little of what the group earns. That claim rests on one half-year comparison. A single half is a thin base for a statement about structure, and I have written it as though it were about structure.
Nobody publishes a forecast for this firm
The consensus screen shows Not Rated, a zero in the objective field, zero estimated earnings per share and an empty list of individual notes. A second screen says no opinion has been offered within three months. I opened three other Korean brokerages of similar size on the same day and read the same sentence at each. This is a covered-by-nobody corner of the market, which is why this piece contains no valuation figure from any house.
The habit this reading corrected
When I first saw six straight profitable quarters I registered it as a fact about the company. It is a fact about the group. I had collapsed two reporting entities into one subject and then attached a track record to that subject, and the moment the parent-company line appeared the sentence I had formed stopped being true of half of what it named.
What makes the error easy is that the two entities share a name and a ticker, and most coverage uses that name without qualifying which set of accounts it means. The qualification is usually one word, and the word is usually absent. I supplied the missing word from habit, and the habit picked the flattering one.
The habit I am adopting: when a run of results is offered as evidence about a firm, find out which entity produced the run before using it. If consolidated and parent figures both exist, write both down. If only one exists, say which one it is. The failure here was not a miscounted number. It was letting a name stand for two different balance sheets.
What would change my reading of Daol Investment Securities
I am watching and I own none of it. The firm is worth about 175 million US dollars at the September 16, 2026 close, and there is no outside forecast to check my arithmetic against, so the honest description of my position is that I have read one income statement carefully and know less than I would need to.
Two markers. First, if the 2026 annual report shows parent-company net income back near the 16.5 billion won it managed in the first half of 2025, then this half was a gap and not a shape. If it stays near the current level while the consolidated line holds, then the listed entity is a holding structure with a brokerage attached, and I would value it that way instead.
Second, if administrative costs rise above 88.70 percent of net operating revenue for the full year, the operating line goes to almost nothing on a revenue decline that would look mild anywhere else. That is the number I would check first in the annual filing, before the profit line.
The judging documents are the 2026 annual report and the third quarter disclosure before it. If a first analyst ever initiates on this firm, I will read that before I trust my own column choice.
Figures reflect the fiscal year 2025 and first half 2026 statements as aggregated, and the September 16, 2026 market close. US dollar conversions are approximate, at roughly 1,363.51 won per dollar on September 15, 2026. Amounts stated in won follow the Korean reporting convention of hundreds of millions converted to billions for readability, and ratios are my own calculations from the figures shown.
Sources: WiseReport company profile · Valueline income statement · Valueline balance sheet · Youth Daily on the first half · IB Tomato on project finance exposure · NewDaily on sector earnings · Nomura balance sheet · Daiwa balance sheet · SBI Holdings balance sheet