BGF Retail ROE and the Asset Turnover Behind Its Peer Ranking
I built two columns for five convenience-store companies and the columns disagreed. Ranked by the share of sales that reaches net income, BGF Retail stock sits behind Seven & i Holdings. Ranked by what those companies earn on shareholder capital, the order flips. I wanted to know which line does that, so I kept dividing until only one column was left standing.
Two columns, five companies, listed alphabetically so neither column becomes a ranking
Net income divided into revenue: BGF Retail 2.15% · Casey’s General Stores 4.07% · Couche-Tard 4.11% · Murphy USA 2.43% · Seven & i 2.81%
Net income divided into year-end equity: BGF Retail 14.87% · Casey’s 18.08% · Couche-Tard 19.43% · Murphy USA 75.48% · Seven & i 8.02%
Both columns are mine, computed from each company’s own reported figures on a single convention. The two columns do not put the five in the same order.
The company runs the CU chain, which counted 18,711 stores at the end of 2025. It trades on the KOSPI, the senior board of the Korea Exchange, where the country’s larger and longer-listed companies sit; the KOSDAQ is the separate junior board that hosts smaller and earlier-stage issuers. On August 24, 2026 the shares closed at KRW 145,900, putting the market value at KRW 2,521.7 billion, or roughly USD 1.82 billion.
Contents
What BGF Retail Stock Sells, and What It Owns
Two figures from the 2025 accounts
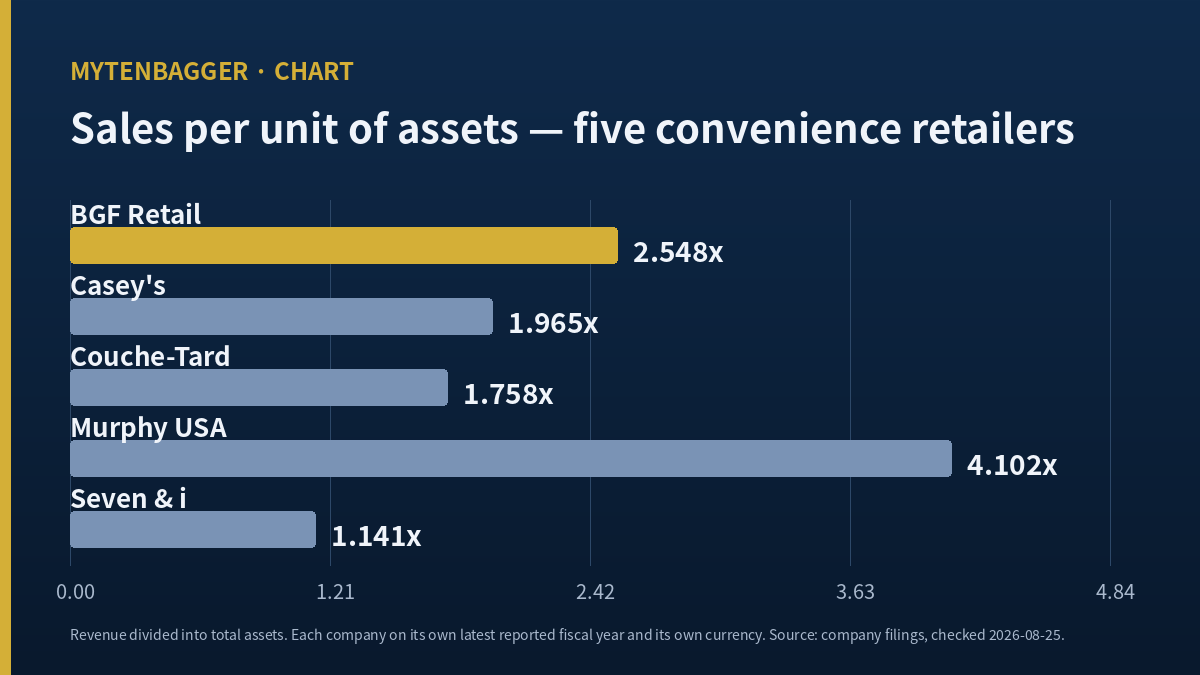
Revenue for the year to December 31, 2025 was KRW 9,061,216 million. Total assets at the same date were KRW 3,556,166 million. Divide the first into the second and you get 2.548. Every won of assets on this company’s statement of financial position produced about two and a half won of sales during the year.
Equity attributable to owners was KRW 1,313,057 million, so total assets were 2.708 times equity. Net income attributable to owners was KRW 195,263 million. Those four numbers come from the consolidated annual report filed with Korea’s electronic disclosure system on March 18, 2026 (filing 20260318000829).
Why the turnover line is the one that travels
I could not convert the peer figures into a single currency without inventing an exchange rate for a Canadian filer reporting in dollars, a Japanese filer reporting in yen and a Korean filer reporting in won, closing on three different dates among those three and four across the whole table. So I did not convert them. What survives that refusal is the set of columns built by division. A ratio carries no currency, and it is the only part of this comparison I am willing to put side by side.
The Line That Reverses BGF Retail Stock’s Order
Seven & i Holdings is the useful case because two of its three columns look like this company’s. Its net income divided into revenue is 2.81%, above BGF Retail’s 2.155%. Its total assets divided into equity are 2.506 times, against 2.708 here. Those two lines would predict a similar return, or a slightly better one for the Japanese company.
The third line is where they separate. Seven & i turned JPY 10,430,269 million of revenue on JPY 9,142,957 million of assets, which is 1.141 times. BGF Retail turned 2.548 times, or 2.23 times as fast. Hold everything else and swap only that line, and the Korean company’s return on year-end equity falls from 14.87% to 6.66%, while the Japanese company’s rises from 8.02% to 17.92%. The two columns in my summary box change places entirely, and nothing else in either set of accounts had to move.
Murphy USA sits at the other end of the same line. It turned 4.102 times, faster than anyone else I looked at, and it also carries total assets of 7.579 times equity after buying back USD 652.0 million of its own stock during 2025. Its return on year-end equity works out to 75.48%. That figure is not evidence that Murphy USA is four times the business Couche-Tard is; it is evidence that two of its three lines are extreme at once.
Five Retailers, Their Own Reporting, No Conversion
| Company | Fiscal year end | Revenue | Profit line as the company labels it | Sales into assets | Assets into equity |
|---|---|---|---|---|---|
| Alimentation Couche-Tard | April 26, 2026 | USD 76,506.6m | Operating income USD 4,641.1m | 1.758x | 2.690x |
| Casey’s General Stores | April 30, 2026 | USD 17,561.1m | Income before income taxes USD 937.0m | 1.965x | 2.261x |
| Murphy USA | December 31, 2025 | USD 19,384.0m | Income from operations USD 718.5m | 4.102x | 7.579x |
| Seven & i Holdings | February 28, 2026 | JPY 10,430,269m | Operating income JPY 422,993m | 1.141x | 2.506x |
| BGF Retail | December 31, 2025 | KRW 9,061,216m | Operating profit KRW 253,947m | 2.548x | 2.708x |
Sources: Couche-Tard fiscal 2026 results, June 22, 2026; Casey’s fiscal 2026 release filed with the SEC, June 9, 2026; Murphy USA fourth-quarter 2025 results, February 4, 2026; Seven & i consolidated results for the year to February 2026. The last two columns are my own division. Note that Casey’s does not present an operating income line at all, which is why the profit column carries each company’s own label where a common heading would normally sit.
Two chains I left out, and why
Lawson and FamilyMart both run store counts in the same range as CU, and both publish results. Neither is in my table. Lawson was taken off the Tokyo exchange in July 2024 and is now held equally by KDDI and Mitsubishi Corporation; FamilyMart went private under Itochu in 2020. Both still report revenue and a profit line called business profit under IFRS, but I could not reach a statement of financial position for either, and without total assets there is no way to compute the column this piece is about. Their revenue is also recognized on a net basis, at roughly one-sixth of chain-wide sales in FamilyMart’s case, so even the profit share would not sit on the same footing as the other five.
The operating model changes what this ratio means
I picked these peers on one rule: I would put company-operated chains and franchised chains in the same table, but only if I said first which way that difference pushes the number. Casey’s operates 2,944 stores and owns most of the real estate under them. Murphy USA operates 1,800. Almost all of CU’s 18,711 stores are run by franchisees, so the fixtures, the leases and the working capital inside those stores are largely not on the parent’s books. That absence lifts the sales-into-assets column mechanically, and any reader who wants a like-for-like measure of retail efficiency should read this paragraph as the limit of what the table can show.
Store counts are the obvious first thing to reach for in this industry. Bigger chain, better business, more or less. Building the table above pushed me off that reflex in a way I did not expect: the company with the most stores in it has the smallest asset base in its own currency terms, and the reason is not scale at all. It is who signs the store lease. I had looked at these companies without once asking that question in a form I could compute.
Store Counts Stopped Growing on Three Continents
The asset side of a store chain grows when the chain opens stores. So before I trusted a turnover figure I went and looked at whether any of these companies are still opening them.
In the United States, the industry association reported in-store sales of USD 341.2 billion for the twelve months to December 2025, up 1.7% and the twenty-third consecutive annual increase, on a store count of 151,975 that fell 0.2% and has now declined two years running. The mix underneath moved much further than the total: cigarettes went from 30.9% of in-store sales in 2015 to 18.8% in 2024, while foodservice went from 11.9% of in-store sales in 2005 to 28.5% in 2025 and now carries 38.9% of in-store gross profit (NACS, April 15, 2026; NACS tobacco data, March 9, 2026).
Japan is a shade healthier and moving the same way. The Japan Franchise Association put chain-wide sales for the same twelve months at JPY 12,583.0 billion, up 2.2% across 56,054 stores, with customer counts down 0.2% and average spend up 2.5% to JPY 737.9 (Japanese trade press, January 20, 2026). Volume fell and price carried the year.
Korea shows the same slope in the opening line itself. CU added 975 net new stores in 2023, 696 in 2024 and 253 in 2025 (Korean press, August 18, 2026). A chain adding a quarter as many stores as it did two years earlier is a chain whose asset base has largely stopped expanding, and that is the arithmetic under everything in my table.
What four years did to this company’s own turnover
I ran the same division across BGF Retail’s own last four annual filings. Total assets went from KRW 2,946,235 million at the end of 2022 to KRW 3,556,166 million at the end of 2025, a rise of 20.70%. Revenue over the same span went from KRW 7,615,769 million to KRW 9,061,216 million, a rise of 18.98%. Assets grew slightly faster than sales, so the ratio reads 2.585, then 2.546, then 2.557, then 2.548.
That is a slip of 0.037 over four years, which is small enough that I would not build an argument on the direction alone. It matters because of what it is not doing: the one line holding this company’s return up has not been improving. It has been holding roughly still while the store additions behind it fell by three quarters.
The Peer That Is Moving Toward This Arrangement
The most interesting thing I found about Seven & i has nothing to do with its 2026 results. It is what the company says it plans to do next.
Couche-Tard withdrew its takeover proposal on July 16, 2025, citing an absence of constructive engagement, and the Japanese company’s shares fell about 9% the following day. The North American initial public offering that was meant to be the alternative slipped at the April 2026 fourth-quarter presentation to fiscal 2027 at the earliest. What the company is executing in the meantime is a plan to convert 2,600 company-operated stores to franchise by 2030 and to remodel more than 7,000 North American locations (US trade press, May 21, 2026; US trade press, July 17, 2025).
Converting an operated store to a franchised one takes the store’s economics off the parent’s asset base and leaves the fee stream behind. That is, line for line, the arrangement that produces the Korean company’s 2.548. Seven & i has already moved partway there by another route, deconsolidating Seven Bank in June 2025 and York Holdings in September 2025, which is a large part of why its own disclosed return on equity went from 4.5% to 7.6% in one year.
So the gap I measured has a closing mechanism that does not require BGF Retail to do anything at all. If the Japanese company keeps shrinking its asset base toward the franchised model, the 2.23 times difference between the two turnover figures narrows on the other side of the comparison. I would treat that as the most likely way this piece dates, ahead of anything in the Korean accounts.
What BGF Retail Stock Costs Right Now
The multiples, and how I checked them
At the August 24, 2026 close of KRW 145,900 against 17,283,756 shares, market value comes to KRW 2,521,700,000,400. That matched the vendor screen to the won, which told me the screen and I were counting the same shares. Dividing 2025 net income by that share count gives earnings of KRW 11,297 a share and a trailing multiple of 12.91 times. Book value per share works out to KRW 75,971 on year-end equity, against 76,070 on the screen, a gap of 0.13% whose source I did not find. Price to book on my own figure is 1.92 times.
One number, two conventions
Return on equity shows up as 14.87% in the disclosure-based series and 15.6% on the vendor screen. I reproduced both. The first divides 2025 net income by year-end equity of KRW 1,313,057 million. The second divides the same income by the average of the 2024 and 2025 year-end figures, KRW 1,248,594.5 million. Neither is wrong. My table uses year-end equity for all five companies so that the column stays internally consistent.
The dividend, which has not moved
The declared dividend has been KRW 4,100 a share for each of 2022, 2023, 2024 and 2025, having risen once from KRW 3,000 for 2021. On the August 24 close that is a 2.81% yield and a 36.3% payout against reported earnings, which is to say the earnings cover it nearly three times over. At the other end of Korean retail the same division runs the other way: Lotte Shopping paid 2.193 times its owners’ earnings for fiscal 2025. A screen field labeled consecutive dividend increases reads five; the strict version of the same field reads zero, and the strict version matches the filing history.
What Moved BGF Retail Stock in August 2026
The company published preliminary half-year results on August 6, 2026, and filed the full semi-annual report on August 14, 2026. Operating profit for the six months came to KRW 122,961 million, up 33.6% on the same half of 2025, on revenue up 5.6%. The stock rose on August 6 and again on August 7, when it closed at KRW 153,100, and eight brokers were reported that day to have reset their published valuations, seven of them upward, with the increases running from 4.2% to 17.6% (Korean press, August 7, 2026). Two of the drivers the company named for the quarter were a government fuel-cost relief payment usable at franchised convenience stores from April 27, 2026, and a rise in spending by foreign visitors (Korean press, August 6, 2026).
Over the twelve months to August 24, 2026 the shares returned 21.48% against 108.64% for the KOSPI and 31.51% for the exchange’s general-merchandise grouping. Beta against the index over that window came out at negative 0.014 and the correlation at negative 0.017, the closest to zero I have measured on a Korean name. On August 24 itself the index fell 3.12% and this stock rose 3.18% (Korean market coverage, August 24, 2026).
Similar work on other Korean consumer names sits alongside this one. Harim’s operating margin ran ahead of two US chicken processors with no analyst covering it; TheBorn Korea raised capital spending several times over in a year its revenue fell; and I turned constructive on Samyang Foods on the strength of added plant capacity.
Four Ways I Could Be Wrong About BGF Retail Stock
At KRW 2,521.7 billion of market value this sits outside the 100 largest names on the KOSPI, which is why I watch it. My stance is narrow: when a company’s return on capital comes from how fast its assets recycle, and only lightly from what it keeps out of each sale, I want to see that turnover line hold for another year before I treat the return as durable.
Here is what would retire that stance. The equation I used has three lines in it, and my whole reading rests on which one is doing the work. If the return on equity rises from here while the sales-into-assets line stays where it is, the increase will have come from the profit share, and this piece will turn out to have described one year of accounts. The business underneath would be doing something else. That test arrives with the third-quarter report, whose statutory deadline of November 15, 2026 falls on a Sunday, so in practice November 16, 2026 or later.
- The comparison that carries this piece leans on a year Seven & i spent shrinking its own accounts. It deconsolidated Seven Bank in June 2025 and York Holdings in September 2025. Total assets fell 19.7% and revenue fell 12.9% for that reason, which mechanically lifts the sales-into-assets figure I computed for it. The 1.141 times I used is not the number that company would have shown a year earlier, and the gap I built the argument on is therefore narrower than it looks.
- The ratio treats a franchised chain and an owner-operated chain as if one measurement fits both. Casey’s carries its own store real estate; almost all of CU’s 18,711 locations are run by franchisees whose fixtures and working capital are largely outside the parent’s balance-sheet total. Some part of the 2.548 times reflects where the reporting line falls, and no portion of that is an operating achievement. I cannot size it.
- My return column uses year-end equity throughout. The Korean vendor screen uses a two-year average and produces 15.6% where the first produces 14.87%, for the same company and the same year. Every entry in that column would move if I switched conventions, and I could not switch consistently because I do not hold prior-year asset figures for all five names.
- I could not separate interest-bearing debt from the rest of the liabilities. Total liabilities of KRW 2,243,109 million carried KRW 48,253 million of interest expense in 2025, an effective 2.15%, which implies a sizable non-interest-bearing component in a business that leases most of its footprint. I did not open the notes to the accounts, so the leverage line in my table is a total, and nothing finer.
Prices and multiples here reflect the August 24, 2026 close as I checked them while writing, so live quotes will have moved. Screen-sourced figures come from a Kiwoom feed updated on August 24, 2026. The dollar figure for market value uses the Seoul close of KRW 1,382.4 per dollar on the same date and is approximate. Peer figures are left in the currency each company reports; I did not convert them, and so I have not made any statement about relative size.
- Lotte Tour Development: Jeju Casino Recovery and Asset Turnover
- Golfzon Revenue per Store Fell as 689 New Venues Opened