Kyobo Securities Stock Made and Lost Money in the Same Half
Brokerage segment operating profit at Kyobo Securities rose 334.4 percent in the first half of 2026. Its derivatives segment lost KRW 107.2 billion, about $78.3 million, over the identical six months.
Contents
What Kyobo Securities stock earned and gave back in the same half
Kyobo Securities is a mid-sized brokerage listed on the KOSPI, the senior board of the Korean exchange, where the largest domestic industrial and financial names trade. It is not a household name outside Korea. I opened the file on it because it screens cheap, and I kept reading because of one arithmetic problem that would not close.
The five figures I checked, and where the checking stopped
Checked, in order, with two of them ending in a gap
Half-year net profit KRW 158.521 billion ($115.8 million), against KRW 142.910 billion ($104.4 million) for the whole of 2025. That is 10.92 percent more, by my calculation, in half the time.
Derivatives segment operating loss KRW 107.2 billion ($78.3 million), a loss 89.0 percent wider than a year earlier.
Brokerage segment operating profit KRW 108.0 billion ($78.9 million), up 334.4 percent.
Four segment lines carried in Korean press coverage sum to KRW 277.2 billion ($202.5 million); reported operating profit is KRW 211.8 billion or 211.9 billion. KRW 65.3 to 65.4 billion is unexplained, by my calculation.
Market capitalization KRW 1.1396 trillion ($832.6 million) against June 30 book equity of KRW 2.274458 trillion ($1.662 billion).
The brokerage line that grew 334 percent
Bloter, covering the August 14, 2026 results release, put net fee income at KRW 202.7 billion, up 81.8 percent, and interest income at KRW 255.2 billion, up 2.2 percent. Fee income grew thirty-seven times faster than interest income over the same six months, and that ratio is what the rest of this entry keeps running into.
What a 334 percent increase looks like in won
Brokerage operating profit went from roughly KRW 24.86 billion to KRW 108.0 billion, by my calculation from the growth rate Bloter reported. In dollars that is about $18.2 million becoming $78.9 million. It is a large move for a segment that had been small.
The half beat the full prior year
Consolidated half-year net profit of KRW 158.521 billion exceeded full-year 2025 net profit of KRW 142.910 billion. I checked the components in the semi-annual filing: first-quarter net profit KRW 68.411 billion plus second-quarter standalone KRW 90.110 billion gives exactly the half-year figure. Operating revenue of KRW 5.110349 trillion divided by the year-earlier KRW 2.366068 trillion gives 2.1598, which is the 115.98 percent increase Sidae reported. The reported growth rate closes against the filed numbers.
The derivatives line that lost 107.2 billion won
In the same six months, the derivatives segment reported an operating loss of KRW 107.2 billion, and Bloter described the loss as 89.0 percent wider than the year before. Working backwards from that percentage, the year-earlier loss was about KRW 56.72 billion.
One desk gave back what another desk made
KRW 107.2 billion lost on derivatives, KRW 108.0 billion earned in brokerage. The two are within one percent of each other. I am not claiming a causal link between them, and I have no evidence that the derivatives positions were hedges against brokerage exposure. What I can say is that the segment disclosure puts a number of that size on both sides of the same six months.
What I could not determine about the loss
Whether the derivatives book is hedging or directional stays open to me. Neither Bloter nor Sidae said, and the segment notes in the original filing are still unread on my side. That is a material gap, because a hedging loss against an offsetting gain elsewhere reads very differently from a directional loss. I am recording the number without a reading of it.
Four segments that do not add up to the reported operating profit
| Segment | H1 2026 operating profit | Change |
|---|---|---|
| Brokerage | KRW 108.0bn ($78.9m) | +334.4% |
| Principal trading | KRW 242.4bn ($177.1m) | +65.8% |
| Investment banking | KRW 34.0bn ($24.8m) | -10.8% |
| Derivatives | KRW -107.2bn (-$78.3m) | loss 89.0% wider |
| Sum of the four | KRW 277.2bn ($202.5m) | my calculation |
| Reported operating profit | KRW 211.8bn or 211.9bn | +53.8% / +53.9% |
The gap is 65.3 to 65.4 billion won
108.0 plus 242.4 plus 34.0 minus 107.2 gives 277.2. Reported operating profit is 211.8 as Sidae carried it or 211.9 as Bloter carried it. Somewhere between KRW 65.3 and 65.4 billion, about $47.7 million, sits outside the four lines. Unallocated head-office costs and inter-segment eliminations are the obvious candidates. The reconciliation table stayed out of reach, so the number stays open here.
Why the gap matters more than its size
Any story of the form “one desk drove the result” implies that the reported desks account for the result. Here they do not. A reader who takes the four segment lines as the whole company is working with a picture that overstates operating profit by roughly thirty percent, by my calculation. I would want that stated even if the missing amount turned out to be routine.
Two outlets, two segment schemes for the same half
Bloter organized the half around brokerage, principal trading, investment banking and derivatives. Sidae organized the same results around wealth management, sales and trading, and investment banking, and quoted a company representative saying that rising domestic and overseas trading volumes had improved wealth management profitability. Both ran on August 14, 2026. Which scheme matches the company’s formal segment disclosure is something I was unable to settle.
Where the price-to-book on Kyobo Securities stock comes from
Market capitalization on the September 2, 2026 close was KRW 1.1396 trillion, about $832.6 million. That is 10,000 won times 113,960,000 shares, and it reconciles to the won. Consolidated equity at June 30, 2026 was KRW 2.274458 trillion, about $1.662 billion, with no minority interest at all. Dividing one by the other gives 0.501.
The screen says 0.54 and it is using an older equity figure
My data screen reports price-to-book of 0.54. Dividing the same market capitalization by year-end 2025 equity of KRW 2.118939 trillion gives 0.5378, which rounds to the screen value. So the two are the same calculation on different dates. I checked the earnings path as well: market capitalization divided by 2025 net profit gives 7.974, and the screen’s price-to-earnings is 7.97. Both routes count the same share number, which is not something I can assume in Korean brokerages with multiple share classes.
A par-value check that closed
Par value of 5,000 won times 113,960,000 shares gives KRW 569.8 billion, which matches the paid-in capital field on my screen. Preferred shares would have broken that multiplication. This is a small test and it passed, which is worth saying because I have had it fail on other Korean names.
A KOSPI listing with 84.75 percent held by three names
A Korean corporate information service that summarizes the filings lists the largest shareholder as Kyobo Life Insurance and two others, holding 96,579,001 shares together. Against 113,960,000 shares outstanding that is 84.7482 percent, which rounds to the 84.75 percent figure the filing carries. The last recorded change in that block is dated September 20, 2023.
What is left for the market to price
Subtracting leaves 17,380,999 shares. At the September 2, 2026 close that is KRW 173.81 billion, about $127.0 million, by my calculation. Foreign ownership stands at 1.08 percent. Trading volume on that session was 57,039 shares. I am not asserting that concentrated ownership explains the discount to book, because the counterexamples are easy to find and I did not test the proposition. I am recording it because it changes who bears the cost of any equity raise.
The parent has a listing question of its own
Korean financial press reported on July 7, 2026 that Kyobo Life is examining listing conditions at a working level and that the company said no decision has been made. The same report described a holding-company conversion roadmap presented to the board in 2023, named the already-listed brokerage as a complicating factor in the debate over parent and subsidiary both being listed, and said IMM Private Equity and EQT Partners remain in arbitration and litigation seeking recovery above 310,000 won per share against an investment near 245,000 won. The same coverage noted the parent acquired 50 percent plus one share of SBI Savings Bank in 2026.
The capital target sitting behind Kyobo Securities stock

A Korean business daily reported in April 2026 that the company intends to reach KRW 3 trillion of shareholders’ equity by 2029 in order to qualify as a comprehensive financial investment business operator, and KRW 4 trillion by 2031 to move up to the top-tier investment banking designation. Equity at June 30, 2026 was KRW 2.274458 trillion, leaving KRW 725.542 billion, about $530.1 million, to go.
Retained earnings get there before the deadline
Annualizing the half-year net profit gives KRW 317.042 billion, and subtracting the KRW 62.678 billion paid out as the 2025 dividend, a KRW 550 per share payout the board resolved on February 5, 2026 (Thu) and Herald Business reported, leaves KRW 254.364 billion of annual retention, by my calculation. Dividing the shortfall by that gives 2.85 years from mid-2026, which lands inside 2029. Measuring instead by how much equity actually grew in the half, KRW 155.519 billion, and doubling it gives 2.33 years. Both routes arrive before the stated deadline.
The two routes disagree by 59.676 billion won
Half-year net profit less the annual dividend is KRW 95.843 billion. Equity actually rose KRW 155.519 billion over the same half. The difference of KRW 59.676 billion is not accounted for by profit and dividends, and other comprehensive income or treasury share transactions would be the usual explanation. The statement of changes in equity is still unread on my side, which is why the slower of the two routes is the one I lean on.
Kyobo Securities stock measured against Virtu and Futu
I picked the comparison companies by a single rule this time. Their most recent published reporting period has to end on the date I am using, June 30, 2026. Everything else can differ, including how long that period runs, and that difference bites here: my company’s figures cover six months while both comparison figures cover twelve. Same end date, different length. So direction is the only thing I will read across the three, and no multiple goes next to any of them.
One market maker and one pure brokerage
Virtu Financial (NASDAQ: VIRT) is a market maker, which is the closest global analogue to the desk that lost money here. On a trailing twelve-month view ending June 30, 2026, Virtu reported revenue of $3.264 billion and operating income of $1.362 billion, with revenue up 24.68 percent against the prior comparable trailing period on the data site I used. Futu Holdings (NASDAQ: FUTU) is an online brokerage, the analogue to the desk that made money. Over the same trailing window Futu reported revenue of HK$24.059 billion and operating income of HK$16.045 billion, with revenue up 49.43 percent on the same comparison. Futu reports in Hong Kong dollars and I have left those figures in their reporting currency without converting them.
What the three can and cannot be read against
Both global names grew in the window. The Korean company grew too, at the brokerage desk, and lost more at the desk that most resembles Virtu’s whole business. That is the comparison I am willing to make. A reader can divide operating income by revenue for either US-listed name and get a margin, and those two margins are comparable to each other. What none of them is comparable to is the Korean company’s margin, because its operating revenue line is built on a different base, as the next section explains.
Why Nomura, Daiwa and Jefferies are not in that table
Nomura Holdings and Daiwa Securities Group both close their fiscal years in March. Their April-to-June figures do end on June 30, so my stated rule does not actually throw them out, and I want to be exact about why they are absent: I did not obtain those quarterly filings, and a fiscal first quarter sits differently in a company’s own reporting rhythm than a completed half does. Jefferies Financial Group closes in November, so nothing it has published ends on my date. Naming all three matters more than quietly dropping them, because it shows the comparison set is small and shaped partly by what I could reach. In my entry on Daishin Securities in August 2026 I set a comparison alongside figures whose periods did not line up, and this rule is my correction to that.
The revenue line behind Kyobo Securities stock that a screen and a filing count differently
My data screen shows revenue of KRW 451.7 billion. The consolidated 2025 filing shows operating revenue of KRW 4.506795 trillion. The ratio is 9.98 times, by my calculation. Korean brokerage operating revenue includes gross proceeds from sales of trading assets, while the data vendor is showing something closer to net operating revenue. Neither figure is wrong; they count different things.
What I removed from my reasoning because of it
Three screen values sit on top of that KRW 451.7 billion figure: an operating margin of 42.15 percent, a price-to-sales ratio of 2.52, and a seven-item quality score of 86. I took all three out of my reasoning for this entry. A margin computed on net revenue and a margin computed on gross revenue are not the same measurement, and I have no way to align this company’s version with Virtu’s or Futu’s.
Leverage and cash flow read differently at a broker too
Total liabilities of KRW 19.714462 trillion over equity of KRW 2.274458 trillion gives 866.78 percent, matching the screen field to the decimal. Client deposits and repurchase agreements sit inside that liability total, so it does not mean what a manufacturer’s ratio means. Half-year operating cash flow of negative KRW 574.930 billion is the same phenomenon: changes in financial assets run through operating activities at a broker. Full-year operating cash flow was positive KRW 710.841 billion in 2024 and negative KRW 896.989 billion in 2025.
Where Kyobo Securities stock sits against its own closing high
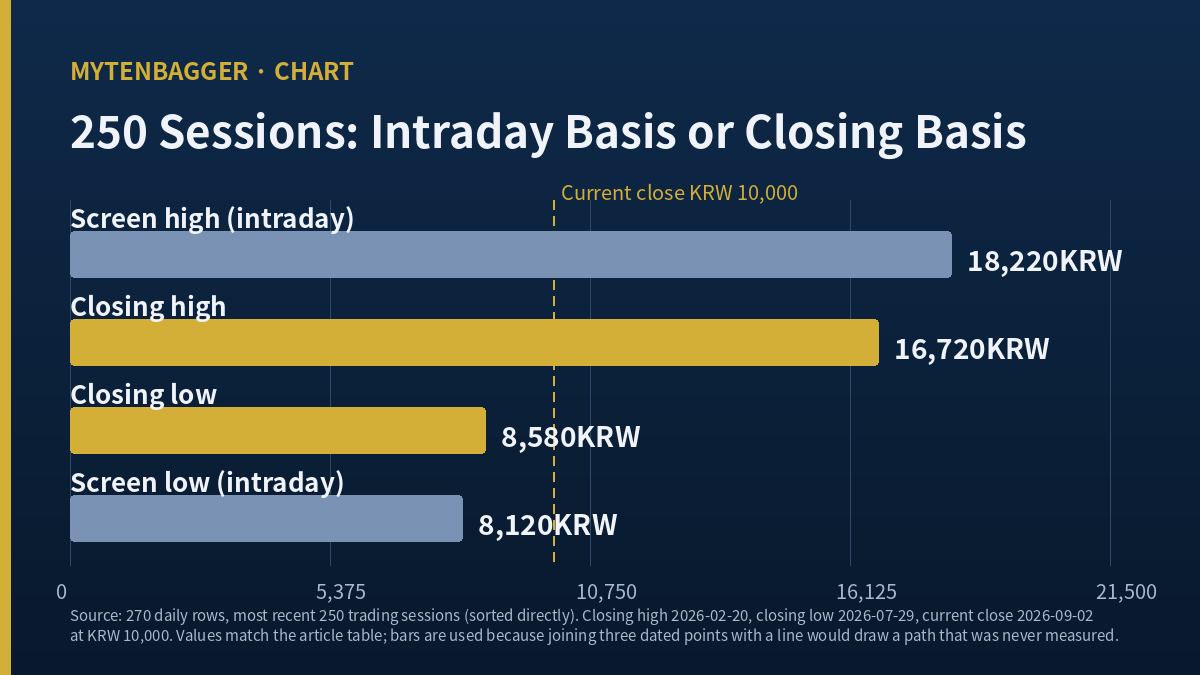
My screen gives a 250-session high of 18,220 won and a low of 8,120 won. I pulled 270 daily rows and sorted them, then cut the most recent 250 sessions. The 18,220 figure is the intraday high of February 20, 2026 (Fri); the close that day was 16,720 won. The 8,120 figure is the intraday low of July 30, 2026 (Thu); the lowest close was 8,580 won on July 29, 2026 (Wed).
Nearly five percentage points ride on that choice
Measured against the intraday high the stock is 45.12 percent below it. Measured against the closing high it is 40.19 percent below. Subtracting the two rounded figures gives 4.93 percentage points; using unrounded inputs gives 4.92. I used the closing series throughout so that every percentage in this entry is computed against the same price the tables carry. No row in the 270 had a close outside its own high-low range.
What the sell side has written about Kyobo Securities stock since 2025
Six broker reports appear in the Korean research archive I use. Korea Investment and Securities published in February 2025 and again in September 2024. NH Investment and Securities published in August 2018. Samsung Securities published three notes in 2014. Consensus estimates returned nothing, and the forward earnings, forward multiple and peer multiple fields on my screen are all empty.
Reports exist; published numbers do not
This is a situation I have not had before. The reports are not missing. What is missing is the rating and the valuation figure, neither of which appears on the public path I can reach. So this entry contains no cell for that number. What it contains is the fact that the notes existed and the dates they carry. Nothing published since February 2025 covers a half that beat the prior full year.
Nine arguments against Kyobo Securities stock
- The KRW 65.3 to 65.4 billion between the segment sum and reported operating profit is unexplained here, with the reconciliation table unread.
- Reported operating profit differs between Sidae and Bloter, KRW 211.8 billion against 211.9 billion, and the company release itself stayed out of reach.
- Sidae and Bloter use different segment schemes for the same six months, so the four-line table may not be the company’s formal disclosure.
- I do not know whether the derivatives loss is hedging or directional, which changes what it means entirely.
- The 2.85-year retention path assumes half-year 2026 earnings repeat for three years, and doubles a single half, ignoring seasonality.
- KRW 59.676 billion of the half’s equity increase is unaccounted for by profit less dividends.
- Newswhoplus, in May 2026, put contingent liabilities at KRW 1.3028 trillion, 60.3 percent of equity measured against first-quarter 2026 equity of KRW 2.162109 trillion, with real-estate project finance making up KRW 1.2089 trillion of it. That is one outlet and the source data stayed out of reach. A 2023 Korea Institute of Finance report separately grouped this company among brokers whose project-finance guarantees exceeded 60 percent of equity.
- Whether the KRW 3 trillion requirement is measured on consolidated or separate financial statements I did not establish. I used consolidated equity, and the equity figure Korean media quoted for the first quarter matched the consolidated filing at the billion-won level.
- Comparing against Virtu and Futu on direction only is a weak comparison, and I chose it because the stronger one is unavailable to me.
Reaching Kyobo Securities stock from a US account, and my stance
There is no wrapper that carries this one
The company has no American depositary receipt. At $832.6 million of market value with 84.75 percent locked in one block, this sits well below where those funds operate. Neither fund’s holdings list was checked here, so treat that last clause as an inference.
Where I stand
I own none of it and I have no order in. On the arithmetic alone the company reaches its own capital deadline without raising equity, which surprised me, because I opened this expecting the opposite. What holds me back is that the half carrying that arithmetic also carried a KRW 107.2 billion derivatives loss whose nature I cannot determine, and I found nothing written about that half on any path I can reach. I am not willing to carry a three-year earnings assumption with nobody outside the company checking it.
What would change my mind, and what I do if I am wrong
Third-quarter equity of KRW 2.345 trillion is the line I set, sitting between the KRW 2.338049 trillion the slower route implies and the KRW 2.352218 trillion the faster one implies. Below it, and equity is accumulating more slowly than even the conservative path, and the 2.85-year figure loses its footing. Above it, with the derivatives loss narrower than KRW 107.2 billion, I move this from a name whose case depends on an untested assumption to one whose assumption is holding, and I put it on the watch list. The filing is due November 15, 2026, a Sunday, so it will arrive on November 16, 2026 (Mon) or later. And if the KRW 2.345 trillion line itself turns out to be disconnected from how the company actually plans its capital, I will write that at the top of the next entry on this company instead of burying it in a list at the bottom. Both conditions expire with the 2026 annual report in March 2027.
Does the parent listing change the case
Nothing is settled. The July 2026 report named the already-listed subsidiary as a complication in the parent’s listing debate and went no further. I do not have a general view on what happens to a listed subsidiary when its parent lists, and I am not going to invent one.
Why does the dividend yield show three values
My screen shows 5.38 percent, a filing-based field on the same screen shows 5.5 percent, and 550 won over the September 2, 2026 close of 10,000 won gives 5.50 percent by my calculation. The last two agree in value but rest on different reference dates, and I could not establish which close produced 5.38 percent.
How reliable are the segment figures
They come from Korean press summaries of the company’s August 14, 2026 results release. I did not take them from the segment note in the filing. Given that they do not sum to reported operating profit, I would treat them as directionally useful and not as audited detail. A case where two share lines carry the same price but not the same book sits in my Kumho Tire entry.
What are the prices and rates here based on
Prices and ratios reflect the September 2, 2026 close as checked in the early hours of September 3, 2026 (Thu) Korea time. Dollar amounts are approximate, converted at roughly 1,368.7 won per dollar, the Seoul close on the same date. The Korean won is the reference currency throughout and the dollar figures are a convenience for readers outside Korea.
Sources I used for this entry
Financial statements come from the Korean regulatory filing system, specifically the 2025 annual report and the 2026 semi-annual report filed August 14, 2026. Segment figures and the results summary come from Korean press coverage of the same release. Ownership data comes from a Korean corporate information service, research history from a Korean research aggregator, and the daily price series from 270 rows I pulled and sorted myself. Peer figures come from a US financial data site. Anything marked as my calculation is not in the source material.
My Korean-language entry on this company takes a different angle on the same half, working from the ownership block and the capital target instead of the segment split. For two other Korean brokers where the ownership block was similarly tight but the capital was moving outward instead of inward, see my entry on Shinyoung and Bookook cancelling roughly a third of their shares.
Yuanta Securities Korea sits on the other side of that same question: it cancelled 3.3 percent of its own shares while its Taiwanese parent kept buying more, which is capital going out and control coming in at once. I worked through that pair of moves in my entry on Yuanta Securities Korea burning 3.3 percent of its own shares.
- Bloter on the first-half results and segment breakdown
- Sidae on operating profit rising 53.8 percent
- Financial Today on the parent’s listing review
- Seoul Economic Daily on the 2029 capital target
- Newswhoplus on project finance contingent liabilities
- Virtu Financial trailing twelve-month financials
- Futu Holdings trailing twelve-month financials
- Korean shareholder register summary
- Korean research report archive
- Herald Business on the KRW 550 dividend resolution
- Money Today on the September 2 won-dollar close