DL E&C Stock: The Same 52.9% Shows Up Three Times This Quarter
Two headlines from the same English-language Korean business desk, four weeks apart. One reads that Korean builders’ profits jumped 53 percent on cost improvements. The other reads that DL E&C’s profit jumped 53 percent and it is targeting plant and data center orders. I read them in the wrong order and spent about ten minutes believing the second was a restatement of the first.
It is not. The two figures are almost exactly the same to one decimal place, and they count entirely different things. Working out which is which is how I ended up writing about DL E&C at all, and it turned out to be the most useful half hour I spent on this company.
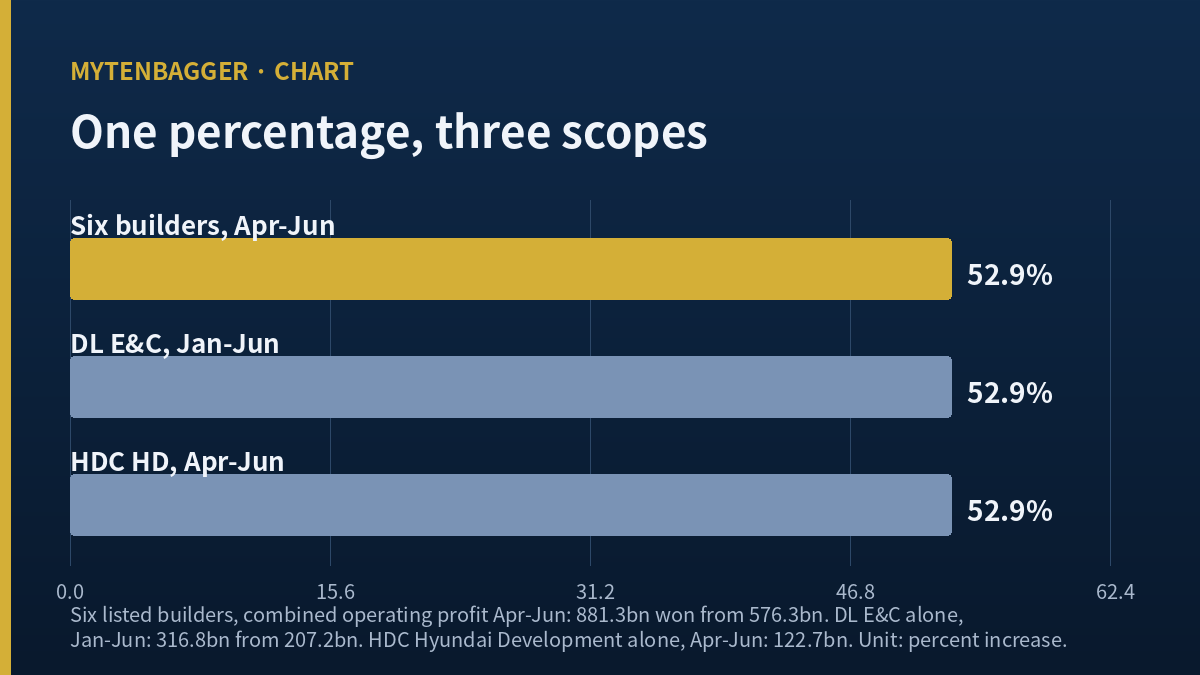
One percentage, three scopes
52.9% | six listed builders, combined operating profit, April to June only | 881.3bn won, up from 576.3bn
52.9% | DL E&C alone, operating profit, January to June | 316.8bn won, up from 207.2bn
52.9% | HDC Hyundai Development alone, operating profit, April to June only | 122.7bn won
DL E&C’s own June quarter grew 26.3 percent. That is the figure a reader looking at one quarter of this company would want, and it is not the one in either headline.
Contents
DL E&C Stock and Two Headlines Carrying One Number
For readers outside Korea: DL E&C trades on the KOSPI, the senior board of the Korea Exchange, under the code 375500. KOSPI is the larger of Korea’s two main boards, with the KOSDAQ carrying smaller and more technology-weighted names. Construction is one of the KOSPI’s older sector groupings, and it has spent the past three years shrinking on the top line while the market argued about whether the bottom line was recovering.
The share closed at 81,200 won on Wednesday, September 9, 2026. On the share count of 38,693,623, that puts the whole company at roughly US$2.34 billion by my calculation, using a won-dollar rate of 1,344.45 taken from the September 8, 2026 close. Korean won is the currency of record throughout this piece and the dollar figure is a convenience, nothing more.
What the Industry’s Number Counts
Six listed builders reported a combined operating profit of 881.3bn won for the June quarter, up from 576.3bn a year earlier. Divide one by the other and you get 1.529, which is where the 52.9 percent comes from. Combined revenue for those six fell 6.5 percent to 18,096.7bn won.
So the sector line is: revenue down, profit up half again. The explanation given in the reporting is cost ratios, meaning the sequential completion of sites contracted when materials were expensive, and their replacement by sites priced after construction costs were raised. Groundbreakings have been falling since 2023, which is what pulled revenue down in the first place. The profit recovery and the revenue decline are the same event seen from two ends.
What DL E&C Stock’s Own Number Counts
DL E&C’s 52.9 percent covers a full half year. The industry figure covered a single quarter. First-half operating profit was 316.8bn won against 207.2bn a year earlier, on revenue of 3.53 trillion won. The first-half operating margin came to 9.0 percent, against 5.5 percent in the same period of 2025.
The June quarter on its own tells a milder story. Revenue fell 9.5 percent to 1,802.9bn won and operating profit rose 26.3 percent to 159.4bn won, for a quarterly margin of 8.84 percent by my calculation. A reader who saw the sector headline and assumed it described this company’s latest quarter would be overstating the quarter by roughly double.
I want to be careful about what I am claiming here. I am not saying the reporting was wrong. Each headline is accurate about its own scope. I am saying that two accurate numbers that happen to land on the same decimal are a trap for anyone reading quickly, and I walked into it.
The Third Appearance Belongs to Someone Else
The third 52.9 percent is HDC Hyundai Development’s June quarter, where operating profit reached 122.7bn won on revenue that fell 21.4 percent to 914.6bn. That gives a quarterly operating margin of 13.42 percent by my calculation, the highest of the six, and comfortably above DL E&C’s.
I am including this because it is the part I would be tempted to leave out. The number I built a piece around belongs to a competitor as well, attached to a better margin than the one I am writing about. If the coincidence is what makes the story, honesty about the third instance is the price of telling it.
Where DL E&C Stock Sits Among the Six, and Against a Swedish Target
Here are all six, June quarter, with the margin column worked out by me from the two reported figures in each row.
| Builder | Revenue (bn won) | Revenue change | Operating profit (bn won) | Operating margin |
|---|---|---|---|---|
| HDC Hyundai Development | 914.6 | -21.4% | 122.7 | 13.42% |
| DL E&C | 1,802.9 | -9.5% | 159.4 | 8.84% |
| Samsung C&T | 3,988 | +17.5% | 202 | 5.07% |
| Hyundai E&C | 6,842.3 | -11.4% | 261.8 | 3.83% |
| GS E&C | 2,779.9 | -13% | 91.4 | 3.29% |
| POSCO E&C | 1,769 | -5.2% | 44 | 2.49% |
Two things fall out of the table. The combined margin of the six is 4.87 percent by my calculation, so DL E&C runs at roughly 1.8 times its own sector’s average quarter. And revenue is falling at five of the six, with Samsung C&T the exception, which is what makes the profit recovery a cost story across the whole board and not a demand story at any single company. I wrote about the other end of that same board in the Hyundai E&C entry from August, where the argument was about order timing instead of margins.
For an outside marker, take Skanska, the Swedish contractor and one of the larger builders in Europe and North America. On November 18, 2025 it raised its financial target for Construction to an operating margin of at least 4.0 percent, up from at least 3.5 percent, and its chief executive framed that as the reward for five years of improving earnings quality. That is a stated ambition and not a reported result, so I am not putting it in the table. But it tells you what a large Western contractor considers a good outcome to aim at, and DL E&C’s half year is running at more than twice it. Korean housing at these cost ratios is, for now, a structurally fatter business than global civil contracting.
What a Cost Ratio Is, and Why It Moves Slowly
The phrase doing all the work in this sector’s reporting is the cost ratio, and it is worth spelling out for readers who do not follow Korean builders. A Korean construction company recognizes revenue on a project over the years it takes to build, and books the costs of that project against it as they land. When steel, cement and labor prices jumped, sites already under contract at older prices kept running for years at a squeezed margin, because the contract price was fixed before the cost base moved. Nothing about that is fixable by management in the quarter it shows up.
What fixes it is time. Those sites finish, they stop consuming revenue at a bad margin, and the mix shifts toward sites signed after construction prices were reset upward. That is why the recovery arrives as a step in the margin line and not as a jump in the revenue line, and why it arrives across an entire board of competitors within a few quarters of one another. Korean trade coverage of the June quarter traced this company’s result to stabilization in the housing division’s cost ratio specifically, which is the same mechanism named at the company level.
The sequencing matters for anyone deciding how much of this to extrapolate. A cost ratio that improves because bad sites ran out improves once. It does not compound. The margin can hold at the new level, and holding is genuinely valuable, but the year-over-year percentage that produced two of this quarter’s three appearances of 52.9 will not repeat by the same mechanism once the base year already contains the better cost ratio.
Within this company the step is visible across the two quarters of 2026. The March quarter ran an operating margin of 9.12 percent and the June quarter 8.84 percent, by my calculation from the reported revenue and operating profit in each. That is a small sequential decline and not a reversal, and two quarters is not a trend. I note it because the direction of that small move is the thing my whole second-half condition below is written about.
The Balance Sheet Under DL E&C Stock
Net cash was around 1.2 trillion won at the end of the June quarter and the debt-to-equity ratio was 86.4 percent. In a sector where project financing guarantees and unsold regional inventory have been the standing worry for three years, a builder carrying net cash is a different kind of company from one carrying net debt, and the market is not paying much for the difference. The share trades at roughly 0.61 times the book value per share reported for the June quarter, by my calculation, against a return on equity of 11.86 percent on the same screen.
The company also said its housing division held margins above 20 percent for a second consecutive quarter. I could not verify that figure against a segment disclosure I had read myself, so I am recording it as the company’s own characterization and leaving it out of my arithmetic.
Orders Are the Half That Is Behind
New orders in the first half came to 5.24 trillion won, up 110.7 percent, and the order backlog stood at 28.9 trillion won at the end of June. Those look strong until you set them against the company’s own annual order goal. Korean daily coverage from August 11, 2026 put the half-year intake at roughly two fifths of the annual goal and noted that more than seven trillion won of further wins would be needed in the second half to reach it. The same piece carried the caution I would have written myself: if new orders do not keep up, the revenue base thins out from the following year onward.
The backlog composition is where the concentration shows. Housing accounts for the clear majority of the 28.9 trillion, which is the same division whose cost ratio produced the margin recovery. That is a coherent story when housing is working and one place for the whole thing to fail when it is not. I would want to see the plant and data center ambitions convert into signed work before treating the backlog as diversified, and as of this writing they are targets with a pipeline attached, which is a different object from an order.
One reporting detail worth flagging: two Korean outlets published slightly different first-half order totals for the same company on the same basis, differing by less than a tenth of a percent. One results write-up from July 30, 2026 carried the higher figure and the August coverage above carried the lower. I used the lower one for the achievement rate. The gap is immaterial to any conclusion here, but it is the kind of thing worth noticing before a reader treats a two-decimal ratio built on either figure as precise.
The second-half plan is specific: plant orders of around 2.5 trillion won, data center orders of around 2 trillion, and a preliminary plant pipeline the company describes as roughly 10 trillion. An SMR design contract with the US firm X-energy sits underneath the plant ambition. The largest single domestic item is a Seoul redevelopment project where, according to Korean construction press, the company was the only bidder when tendering closed on Monday, August 31, 2026, so the tender failed and a negotiated award becomes possible if a re-tender draws the same single bid. That is a plausible path and it is not a contract.
What I Got Wrong While Writing This
My first draft of the sector paragraph said that the six builders’ combined operating profit rose 52.9 percent “in the first half.” I had carried the period across from the DL E&C figure without noticing, because the two percentages were identical and my eye treated them as one fact with one scope. The correction was small, four words, but the version I nearly published would have made a quarterly recovery look like a half-year trend across an entire sector.
What bothers me is the mechanism. I did not misread a number. I read two numbers correctly, saw that they matched, and let the match do the work of checking. Matching is not evidence of shared scope, and the closer two figures sit, the more likely I am to stop asking what each of them measures. I have started writing the period next to every percentage in my notes for this reason.
Three Things That Cut Against DL E&C Stock
The margin and the revenue decline are the same fact. Cost ratios improved because expensive legacy sites finished. When those are gone, the improvement stops being an improvement and becomes a level, and it will be sitting on a smaller revenue base unless order intake fills back in. A half-year intake running at about two fifths of the annual goal is not yet filling it back in.
The peer table does not crown this company. HDC Hyundai Development posted a better quarterly margin on a quarter of the revenue. If the thesis is operational quality, one competitor is currently doing it better, and I would want several more quarters before treating one reading as a ranking.
The macro caution in the sector reporting is not decorative. The same August coverage that described the profit recovery also flagged raw material prices, oil, rebar and cement, alongside currency and interest rate moves that push construction and procurement costs up together. Every one of those runs directly at the cost ratio that produced the recovery.
Where I Stand on DL E&C Stock and What Breaks It
I do not own it and I have no order working. At this size it falls into my watch bucket, and what I do in the watch bucket is write down the arithmetic so a later version of me can check it. What I would want before doing anything more is a third and fourth quarter that hold the margin without the help of finishing legacy sites, because that is the only way to tell a company outcome from board-wide conditions.
The watch bucket is not a neutral place, and I want to be accurate about why this one is in it. A builder running roughly 1.8 times its sector’s combined quarterly margin, carrying net cash instead of net debt, and trading below the book value of its own equity is a combination that would normally hold my attention for longer than one reading. What holds me back is not the company. It is that I cannot yet separate what management did from what the completion cycle did to the whole board at once, and every number I would use to make that separation is a number that also moved for five competitors in the same quarter.
My interest fails on two conditions. First, if the second-half margin falls back toward the sector’s combined 4.87 percent, then this was the board’s story and not this company’s. Second, if the annual order goal finishes materially short and the backlog starts shrinking instead of growing, then the good margin is being earned on a base that is running out.
One more thing, because it is the part I keep circling. Everything strong in this piece is a percentage, and percentages are the format most likely to be quoted without their scope attached. I built an argument out of noticing that, and then I have to accept that my own conclusions are written in the same format and travel just as badly.

Related reading: Teuksu Construction entry
Prices and multiples reflect the September 9, 2026 close as checked at the time of writing. This piece may publish some days later, so figures can differ from live quotes by that gap. The dollar conversion is approximate, taken at about 1,344.45 won per dollar on September 8, 2026, and Korean won is the currency of record throughout. Quarterly figures come from Korean business press reporting of company results and from a Korean market data screen queried on September 9, 2026; anything marked as my calculation is a ratio or difference I worked out myself.