Why Youngone Shares Fell and What Its Negative Cash Flow Means
In August 2025, Youngone’s first-half operating cash flow sat in parentheses, and the number inside was KRW 209.29 billion, about USD 150.29 million. On that line alone, the company looked like it was burning that much cash in six months.
The lowest close that week was KRW 55,600 (USD 39.93). On August 20, 2026 the close was KRW 74,300 (USD 53.35). The KRW 55,600 close turned out to be the floor of the last 250 trading sessions.
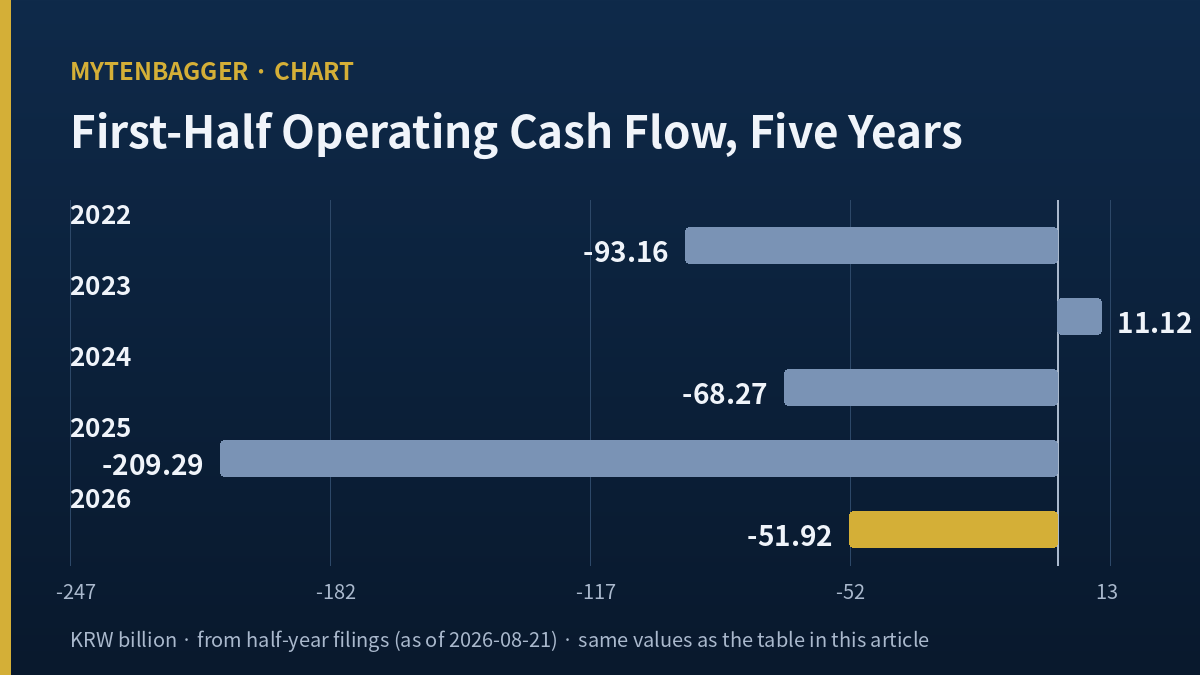
A year later the same line is still in parentheses. First-half 2026 operating cash flow is an outflow of KRW 51.92 billion (USD 37.28 million). What changed is not the sign. What changed is the frame: once five years are on the table the parentheses stop being the finding. The finding moved to a different line, and that line is where Youngone stock lost a fifth of its value in nine sessions.
Ten days in August 2026
| Date | Close | What is verifiable that day |
|---|---|---|
| 2026-08-06 | KRW 95,000 | Highest close of this stretch |
| 2026-08-12 | KRW 85,200 | Down 6.06 percent in one session from KRW 90,700. Cause unidentified |
| 2026-08-14 | KRW 85,900 | Half-year report filed, receipt number 20260814003968 |
| 2026-08-20 | KRW 74,300 | 137,303 shares traded, the heaviest session of the stretch |
From KRW 95,000 on August 6 to KRW 74,300 on August 20 is 21.79 percent lower across nine trading sessions. Measured only from the filing date, KRW 85,900 on August 14 to KRW 74,300 is 13.50 percent lower in three sessions. That same filing showed first-half revenue of KRW 2.1275 trillion (USD 1.528 billion), up 15.03 percent from KRW 1.8496 trillion a year earlier, and first-half operating profit of KRW 295.97 billion (USD 212.53 million), up 29.79 percent from KRW 228.04 billion. The report that lifted every top-line number by a double-digit percentage was followed by a fall.
Contents
Youngone stock fell 21.79 percent in nine sessions
Youngone Corporation trades on the KOSPI, the senior board of the Korea Exchange, under code 111770. The KOSPI is the larger of Korea’s two boards, with the KOSDAQ carrying smaller and earlier-stage names. Youngone is a contract manufacturer of outdoor and performance apparel, and it also consolidates SCOTT Sports, a Swiss bicycle and sports equipment business.
I fix the reading base first. Every price here rests on the close of Thursday, August 20, 2026, at KRW 74,300. Multiply that by 44,310,902 shares outstanding and market capitalization comes to KRW 3.2923 trillion (USD 2.364 billion), which matches the KRW 3,292.3 billion on my data screen to the won. The share count also reconstructs from paid-in capital: 44,310,902 shares at a KRW 500 par value equals KRW 22.155 billion, and the screen’s KRW 22.2 billion is that figure rounded. Two independent paths land on the same share count, so I treat it as settled.
The distance from the high comes in two versions
The highest intraday print of the last 250 sessions is KRW 103,200 (USD 74.11) on March 3, 2026, and the close that day was KRW 98,000. Against the intraday print, KRW 74,300 is 28.00 percent lower. Against the close, it is 24.18 percent lower. My data screen reports the first. I put both in the table and use the second in the text, because close against close is nearer to a price I could have acted on.
The twelve-month return splits the same way. The screen shows 23.82 percent, using an intraday August 21 print as the end point. Matching close to close, KRW 57,700 on August 20, 2025 to KRW 74,300 on August 20, 2026 is 28.77 percent higher. In a stretch where one month is negative and twelve months are positive, the choice of end point moves the answer by roughly five points.
| Measure | Figure | Basis |
|---|---|---|
| Reference close | KRW 74,300 (USD 53.35) | Thursday, August 20, 2026 |
| Market capitalization | KRW 3.2923 trillion (USD 2.364 billion) | 74,300 times 44,310,902 shares, zero reconstruction error |
| Against 250-session intraday high | 28.00 percent lower | KRW 103,200 on March 3, 2026 |
| Against 250-session closing high | 24.18 percent lower | KRW 98,000 on March 3, 2026 |
| Against the close one year earlier | 28.77 percent higher | KRW 57,700 on August 20, 2025 |
| Against the 250-session closing low | 33.63 percent higher | KRW 55,600 on August 21, 2025 |
Youngone stock sits on four negative first halves out of five
Here is the line, laid out across five years.
| First half | Operating cash flow | Operating profit, same half |
|---|---|---|
| 2022 | Outflow of KRW 93.16 billion | KRW 354.01 billion |
| 2023 | Inflow of KRW 11.12 billion | KRW 377.71 billion |
| 2024 | Outflow of KRW 68.27 billion | KRW 237.49 billion |
| 2025 | Outflow of KRW 209.29 billion | KRW 228.04 billion |
| 2026 | Outflow of KRW 51.92 billion | KRW 295.97 billion |
Four of five are outflows, and the one inflow lands in 2023. All five halves posted an operating profit. In the first half of 2022 the company earned KRW 354.01 billion of operating profit and still paid out KRW 93.16 billion more cash than it took in. In this company the sign on first-half operating cash flow does not tell me whether the year is going well.
The cash comes back in the second half
Cut it into single quarters and the return shows up. The first quarter of 2025 sent out KRW 99.04 billion and the second sent out KRW 110.25 billion, which is the KRW 209.29 billion first-half outflow. Then the third quarter brought in KRW 364.11 billion and the fourth brought in KRW 220.05 billion. On a full-year basis 2025 operating cash flow was an inflow of KRW 374.88 billion. The annual figure alone would never flag this name. The half-year figure alone does.
I used the same account in the opposite direction on August 16, 2026, in my note on APR Corporation, where a record quarterly operating profit came with far less cash, and I treated the distance between them as a warning. One account, two readings. What separates them is how many times the same sign has repeated at that company.
The improvement is real on size. This year’s KRW 51.92 billion outflow is 24.81 percent of last year’s KRW 209.29 billion, the smallest of the four outflows. Free cash flow narrowed on the same path, from an outflow of KRW 313.88 billion in the first half of 2025 to an outflow of KRW 148.86 billion (USD 106.89 million) in the first half of 2026. I could not decompose the improvement by account. Inventory rose from KRW 1.2246 trillion at the end of 2025 to KRW 1.3854 trillion at the end of June 2026, an increase of KRW 160.84 billion, so whatever narrowed the outflow sits in receivables or payables, and the filing text did not let me pin it down.
Three brokers had Youngone stock revenue too low and profit too high
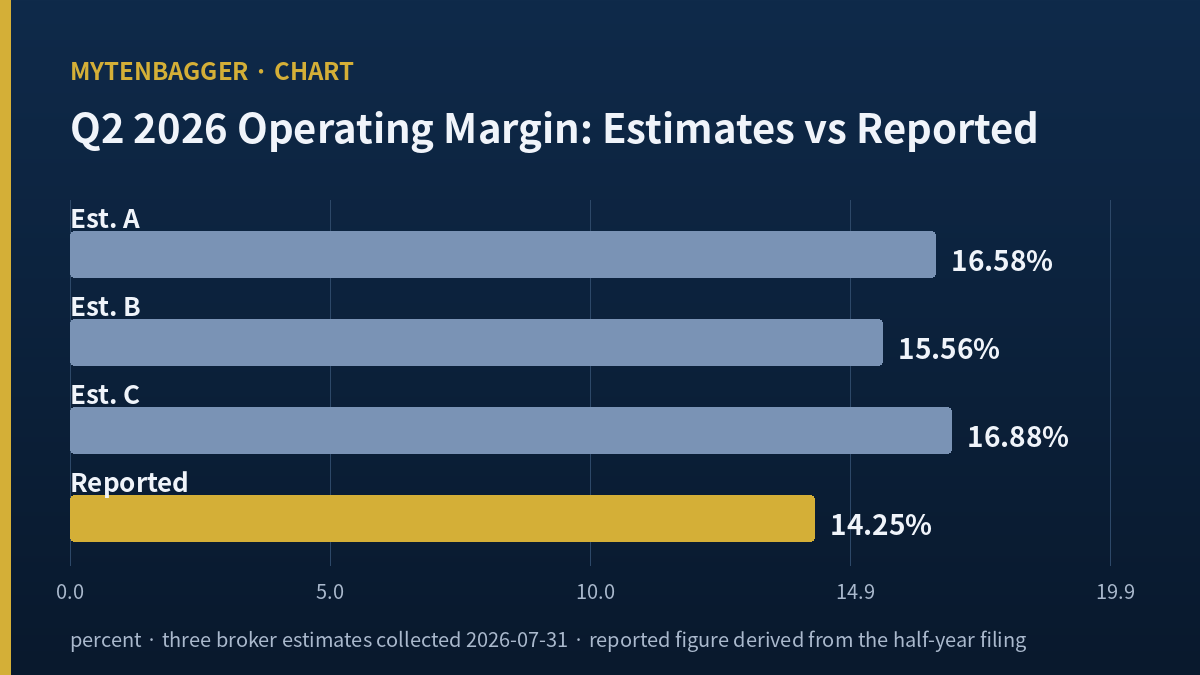
This is the line the August decline is attached to. On July 31, 2026 the Korean outlet Inthenews collected second-quarter estimates from three brokerage houses. The half-year filing of August 14 gave the actual figures. Second-quarter revenue on a standalone basis was KRW 1.2317 trillion (USD 884.48 million) and standalone operating profit was KRW 175.57 billion (USD 126.07 million). Standalone quarters are the half-year cumulative less the first-quarter cumulative.
| Estimating house | Q2 revenue estimate | Q2 operating profit estimate | Implied margin |
|---|---|---|---|
| Shinhan Securities | KRW 1.2012 trillion | KRW 199.2 billion | 16.58 percent |
| NH Investment & Securities | KRW 1.1944 trillion | KRW 185.8 billion | 15.56 percent |
| DB Securities | KRW 1.1516 trillion | KRW 194.4 billion | 16.88 percent |
| Average of the three | KRW 1.1824 trillion | KRW 193.13 billion | 16.33 percent |
| Reported | KRW 1.2317 trillion | KRW 175.57 billion | 14.25 percent |
Revenue cleared all three. It came in 2.54 percent above Shinhan’s KRW 1.2012 trillion, 3.13 percent above NH’s KRW 1.1944 trillion, and 6.96 percent above DB’s KRW 1.1516 trillion. Operating profit missed all three. It came in 11.86 percent below Shinhan’s KRW 199.2 billion, 5.50 percent below NH’s KRW 185.8 billion, and 9.69 percent below DB’s KRW 194.4 billion. Three houses produced six different numbers and the direction was the same every time. The average estimated margin of 16.33 percent (KRW 193.13 billion over KRW 1.1824 trillion) against the reported 14.25 percent (KRW 175.57 billion over KRW 1.2317 trillion) leaves 2.08 points.
The same split appeared a year ago, and it was wider
Analyst Lee Hye-in at Samsung Securities wrote on August 18, 2025 that second-quarter 2025 revenue beat consensus by 5.4 percent, and with actual revenue of KRW 1.0382 trillion that implies a consensus revenue of KRW 985.02 billion. The same note wrote that operating profit missed consensus by 13.7 percent, and with actual operating profit of KRW 145.72 billion that implies a consensus operating profit of KRW 168.85 billion. Both implied figures are my reconstruction from the beat and miss percentages the note disclosed, and neither is consensus source data.
On those reconstructed numbers the market expected a 17.14 percent margin (KRW 168.85 billion over KRW 985.02 billion) and received 14.04 percent (KRW 145.72 billion over KRW 1.0382 trillion), a difference of 3.11 points. The 3.11 points of 2025 is wider than the 2.08 points of 2026. Two consecutive years of the same split support my reading. A narrowing gap cuts against it. I record both.
The 2025 note put the miss down to cost of sales, writing that labor inside cost of sales rose 18 percent year on year as production headcount expanded, and it reported a SCOTT operating loss of KRW 26.5 billion for that quarter. For 2026 I have three candidates and no split between them. Labor is the first. SCOTT is the second, and analyst Ryu Eun-ae at KB Securities put the first-quarter 2026 SCOTT loss at KRW 25.8 billion against KRW 28.1 billion a year earlier. That same note valued the shares at KRW 120,000, which stands 61.51 percent above the KRW 74,300 reference close. I record where the covering house stands and I do not adopt the number as my own. The currency is the third. On August 20, 2026 the won closed the Seoul onshore session at 1,392.6 per dollar, 5.1 won below the August 19, 2026 close, and Money Today reported that level as an eleven-month low for the dollar against the won. For an exporting contract manufacturer a firmer won reduces what actually gets received. I could not obtain segment profit disclosure, so I list the three without dividing the 2.08 points among them.
Six things that cut against this reading
Without this section there is no view here, only a data gap that reads like one.
One, five is a small sample
The claim that a negative first half repeats here rests on five observations, one of which points the other way. A ten-year window might change the picture and I did not pull one.
Two, I cannot name the account that improved
Inventory grew KRW 160.84 billion over the half while the outflow shrank, so the improvement sits somewhere in receivables or payables, and an improvement whose source I cannot name can reverse next period without warning me first.
Three, the estimates reached me through a collector
I read the three second-quarter estimates in a July 31, 2026 news summary and did not open the Shinhan, NH or DB notes. If any of the three revised after July 31, my comparison sits on stale inputs.
Four, August 12 is outside my explanation
The stock fell 6.06 percent in a single session on August 12, from KRW 90,700 to KRW 85,200, two days before the filing. I do not know what drove it. My account covers three sessions after August 14 and leaves the front half of the 21.79 percent decline unexplained.
Five, tariffs and slowing demand are still standing
The same July 31 summary noted that softening global consumption and tariff exposure remain live variables and that a firmer Swiss franc could widen the SCOTT loss. Those two decide whether margin damage is temporary or structural, and I have nothing that settles it.
Six, the reverse reading can be wrong too
From last August’s KRW 55,600 low to KRW 74,300 is 33.63 percent. Reading the same account in the opposite direction does not make the reverse correct. Five years went on the table, not one line.
Youngone stock carries three book values and two multiples
Before borrowing a multiple from a screen I try to reconstruct it. Book value per share came back three different ways.
| Source | Book value per share | Price to book at KRW 74,300 | Reconstruction |
|---|---|---|---|
| Data screen, Kiwoom feed | KRW 93,841 | 0.7918 times | Implies 43,609,030 shares, which does not match the share count |
| WiseReport screen | KRW 96,154 | 0.8018 times | Implies KRW 4.2607 trillion of equity, which matches no filed balance |
| Owners’ equity at June 30, 2026 | KRW 101,926 | 0.7290 times | KRW 4.5164 trillion over 44,310,902 shares |
| Spread across the three | KRW 8,085 | 0.0728 times | 101,926 less 93,841 |
I use the third. Both the equity figure and the share count are dated June 30, 2026 and I know the arithmetic that produced them. This is the same family of problem I hit in my Hyein note, where two multiples were sitting on two different share counts. Here the share count held and the equity figure split.
The earnings multiple splits too. The screen’s 6.69 times uses the owners’ share of fiscal 2025 net income, KRW 492.27 billion, and KRW 3.2923 trillion over KRW 492.27 billion is 6.688 times. Owners’ net income across the four quarters through June 2026 is KRW 590.82 billion (USD 424.26 million), and the same market capitalization over that figure is 5.5724 times. I use 5.57. With first-half owners’ net income of KRW 306.84 billion running 47.32 percent ahead of KRW 208.29 billion a year earlier, a multiple anchored to the twelve months that ended in December 2025 prices earnings that have already been superseded.
Three vendor fields reconstructed cleanly and two did not. Interest coverage of 18.92 comes back as first-half operating profit of KRW 295.97 billion over first-half interest expense of KRW 15.65 billion, or 18.9169. Payout of 18.9 comes back as a KRW 2,100 dividend over precise earnings per share of KRW 11,106.13, or 18.9085 percent. Return on equity of 12.7 percent comes back on average owners’ equity, KRW 492.27 billion over the KRW 3.8895 trillion midpoint of the 2024 and 2025 year-end balances, or 12.6563 percent. The field labeled EBITDA reads KRW 120.40 billion, which equals first-quarter 2026 cumulative operating profit to the won with no depreciation added, so I dropped it. The raw payout field of 45.3 reconstructs on no path I tried, so I dropped that too.
Amer Sports sells what Youngone builds
For a cross-market reference I picked the company that owns a brand Youngone manufactures. Amer Sports (NYSE: AS) owns Arc’teryx, and KB Securities described Arc’teryx orders as a 70 percent growth driver for Youngone in its May 14, 2026 note. That makes Amer the customer’s side of the same garment.
| Measure | Youngone | Amer Sports |
|---|---|---|
| Price, August 20, 2026 close | KRW 74,300 (USD 53.35) | USD 32.53, down 4.38 percent that day |
| Market capitalization | USD 2.364 billion | USD 18.93 billion |
| Trailing twelve-month revenue | KRW 4.3416 trillion (USD 3.118 billion) | USD 7.44 billion |
| Trailing twelve-month net margin | 13.61 percent | 7.34 percent |
| Trailing earnings multiple | 5.57 times | 33.93 times |
The company that sells the jacket keeps a smaller share of each dollar than the company that sews it, and carries 5.07 times the earnings multiple. Youngone’s trailing net margin of 13.61 percent is KRW 590.82 billion over KRW 4.3416 trillion. Amer’s 7.34 percent is USD 546.40 million over USD 7.44 billion. Amer’s market capitalization reconstructs as 581.82 million shares at USD 32.53, or USD 18.927 billion, matching the quoted USD 18.93 billion.
This argument cuts at me as well, and I would rather say so than let it sit. A brand owner carries inventory risk, demand risk and marketing spend that a contract manufacturer never touches, and the market pays for optionality on growth ahead of the current margin. Amer also listed in 2024, so its trailing window is short, and its mix includes hard goods that Youngone does not make. The comparison is directional. It is not like for like, and I limited it to five rows for that reason. One item does survive the caveats: the reported earnings per share of USD 0.96 does not reconstruct from USD 546.40 million over 581.82 million shares, which gives USD 0.9391, a 2.22 percent difference. That is the third stock in a row from this data source where the earnings per share field misses reconstruction by roughly 2.3 percent, and I now treat that field as unusable without the reconstruction printed beside it.
My stance on Youngone stock and what would break it
The seven-item screen I keep returns a perfect score here: revenue scale, a 12.66 percent operating margin, positive earnings per share, a 12.7 percent return on equity, a 6.69 times earnings multiple, a 0.79 times price to book, and positive operating profit. I do not put that score into the decision. Neither of the two things this article is about, the size of the margin miss against estimates and the size of the half-year cash outflow, is one of the seven items.
Instead I write down two separate breakpoints, because the point at which my stance changes and the point at which this article’s explanation fails are different events.
| Type | Threshold | Basis | Checked at |
|---|---|---|---|
| Drop from the watchlist | Third-quarter 2026 standalone operating margin below 13.74 percent | Median of the last six standalone quarters, which ran 10.15, 14.04, 15.04, 10.42, 13.44 and 14.25 percent | Third-quarter report, statutory deadline November 15, 2026 |
| Margin damage wording retired | The same quarter at 15.04 percent or better | The third quarter of 2025 printed 15.04 percent, so matching it removes the damage reading | The same report |
| This article’s thesis retired | Revenue and operating profit land on the same side of consensus | Two years of opposite-signed surprises become coincidence if the third quarter breaks the pattern | The same report and the consensus standing at that date |
| Cash wording rewritten | Second-half 2026 operating cash flow fails to turn positive | Every second half from 2022 through 2025 turned positive | The 2026 annual report |
The third row is new to my process. Until now I have written the point where I am wrong about a company and the point where I am wrong about my own explanation on a single line, and they are not the same line. If revenue keeps beating while profit keeps missing into a third quarter, the problem belongs to the business and not to one reporting period. If the two land together, the story I built from two years belongs to chance.
At KRW 74,300 this trades at 6.69 times fiscal 2025 owners’ earnings and 5.57 times the four quarters through June 2026. The 1.12 times between those two is what August repriced. I read that as a price on how long the margin holds, and while I hold that reading I am waiting on one line of the third-quarter income statement. I read five years of the cash flow line. The next thing I owe this company is a sixth reading, and it belongs on the income statement.
Sources and reference dates
- Financial figures: Korean regulatory filings via the Financial Supervisory Service, half-year report receipt 20260814003968, first-quarter report 20260514001455, fiscal 2025 annual report 20260319001279. Standalone quarters derived by subtracting cumulative periods
- Broker estimate collection: Inthenews, July 31, 2026, in Korean, translated here instead of quoted
- Second-quarter 2025 review: Samsung Securities, analyst Lee Hye-in, August 18, 2025
- First-quarter 2026 review: KB Securities, analyst Ryu Eun-ae, May 14, 2026, which carried a KRW 120,000 valuation on the shares. The same note’s 20.8 percent margin figure does not hold at the company level, since KRW 120.40 billion over KRW 895.80 billion is 13.44 percent, so I left it out
- Shareholder return campaign: Daily Brief on the Quad Asset Management shareholder letter of June 30, 2026
- Capital allocation figures: Bloter, July 13, 2026 and Bloter, August 5, 2026
- Exchange rate: Money Today, August 20, 2026 at 16:19 KST. Seoul onshore close of 1,392.6 won per dollar, the single rate used for every conversion in this article
- Amer Sports quote and trailing figures: stockanalysis.com, August 20, 2026 at 16:00 EDT
- Kakao Pay Balance Sheet: Liabilities Tripled, Equity Barely Moved
- Kyobo Securities Earnings: Brokerage Gains, Derivative Losses
- Kumho Tire Stock Costs the Same as Goodyear: Valuation Compared
- KT Corp Q2 Earnings: Five Ways to Score One Korean Telco Quarter