Kolon Industries Stock: Aramid Capacity Doubled, Exports Up 8.8%
The number I trust least in this piece is measured in tons. I still built the piece around it, because it is the only number here that reports a decision this company made. Everything else in the piece reports something that happened to it.
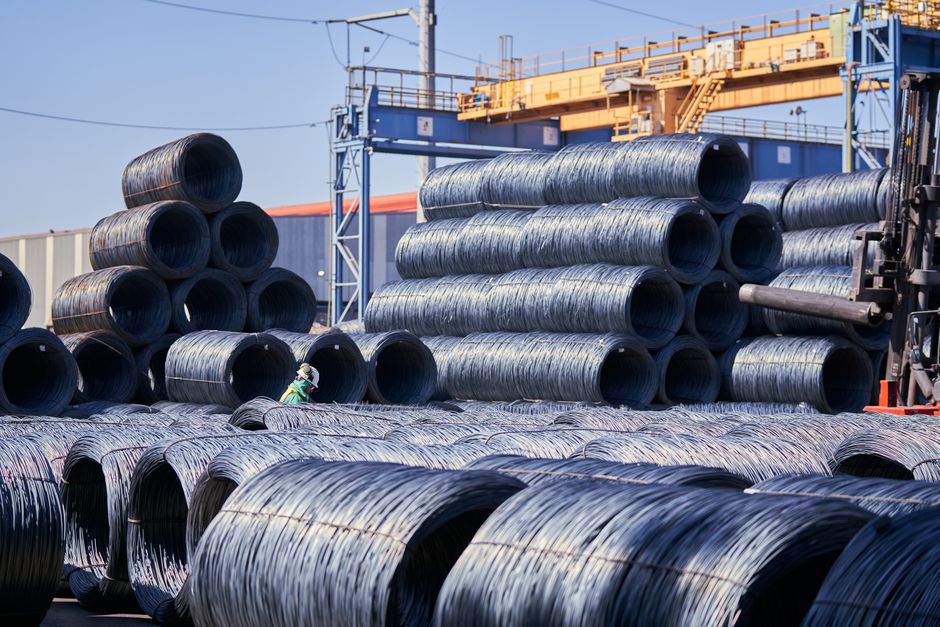
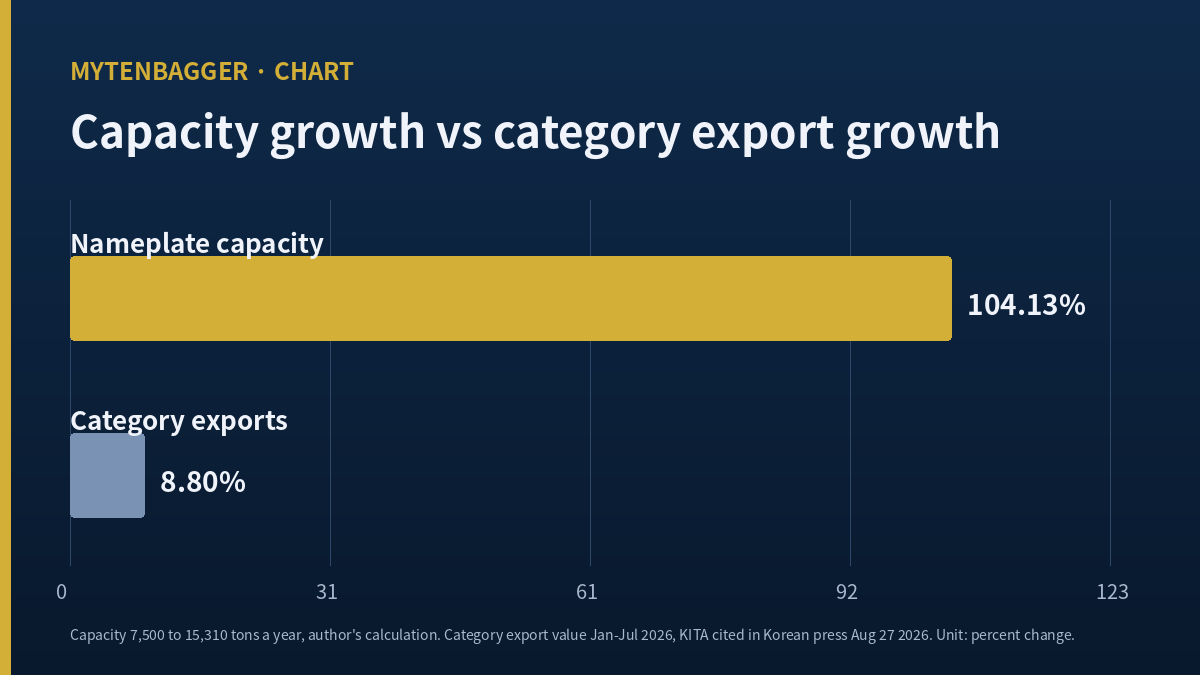
Kolon Industries is a KOSPI-listed Korean maker of industrial materials, chemicals, display films and apparel. Its best known product outside Korea is para-aramid, the fiber family that goes into body armor, tire reinforcement, brake friction materials and the strength members inside fiber optic cable. The company took its nameplate capacity for that fiber from 7,500 tons a year to 15,310 tons, a 104.13 percent increase on my own arithmetic, on the back of a 300 billion won investment committed in 2023.
Over the first seven months of 2026, Korean exports of the high-tenacity filament category that contains this fiber came to USD 105.04 million, which the source itself put at about 145.3 billion won, up 8.8 percent from the same seven months a year earlier. Those two figures are what this piece is about. One of them roughly doubled. The other grew by less than a tenth.
Two rates of change, and the windows they cover
Nameplate capacity: 7,500 tons to 15,310 tons, up 104.13 percent (my calculation), investment committed 2023
Category export value: USD 105.04 million for January through July 2026, up 8.8 percent year on year (Korea International Trade Association, cited in Korean press on August 27, 2026)
Plant utilization: roughly half in the opening quarter of 2025, 90 percent by the June 2026 quarter, full run rate as of the August 2026 report
Before going further I want to be precise about what the capacity figure is and is not. Nameplate capacity is what a plant is designed to produce in a year at full run rate. It is not output, it is not shipments, and it is not revenue. A company can double its nameplate capacity and sell exactly what it sold before.
Korean press reporting on August 27, 2026 put the three domestic producers side by side. Kolon Industries moved from 7,500 tons to 15,310 tons. Taekwang Industrial moved from 1,500 tons to 5,500 tons, a larger multiple on a smaller base. HS Hyosung Advanced Materials sits near 3,700 tons. Utilization at the Kolon plant went from roughly half in the opening quarter of 2025 to 90 percent by the June 2026 quarter, and the same reporting described it as running at its full rate by late August.
That utilization path is the part I find persuasive. A plant that has doubled its design capacity and is running near its ceiling is selling more than it was, whatever the export statistic says about the category as a whole. Reconciling those two observations is the whole question here.
Contents
Kolon Industries stock next to two other aramid producers
I built the smallest peer table I have built in a while. It has one measured column, because the second column I wanted did not survive verification.
| Producer | Para-aramid nameplate capacity | Share of the three-name total |
|---|---|---|
| Kolon Industries (KOSPI: 120110) | 15,310 tons | 62.46% |
| Taekwang Industrial | 5,500 tons | 22.44% |
| HS Hyosung Advanced Materials | 3,700 tons | 15.10% |
| Three-name total | 24,510 tons | the whole base |
Capacity figures as reported in Korean press on August 27, 2026. The right column is my own division and does not appear in the source. There is no multiple column in this table on purpose: two of these three names are diversified conglomerates where aramid is a minority of revenue, so a price multiple for the company would not be a price multiple for the fiber.
The names missing from this table are the two that invented the category. DuPont sells para-aramid as Kevlar and Teijin sells it as Twaron, and between them they have been the incumbent suppliers for decades. I left both out of the table because I could not find a capacity figure for either that I was willing to put next to a sourced Korean number, and I would have been guessing. Their absence is a hole in the table and I would rather label it than fill it with something I have not checked.
What I can say about the wider market comes from the same Korean reporting, and it is a comparison of counts. The unit there is plants. An industry source quoted there put it plainly: where a Korean producer runs one plant, Chinese producers run six or seven. That is a single unnamed industry voice and I treat it as one, but the direction it points is consistent with the price commentary in the same article, which described bulk-grade para-aramid pricing as having come down sharply on the back of Chinese expansion.
The export line, and what it actually counts
Here is the sentence I had to change while writing this piece. I had drafted the export figure as though it described this company. It does not.
The USD 105.04 million is a customs statistic for a product category, high-tenacity aramid filament yarn, aggregated across every Korean exporter of it. Kolon Industries is the largest of the three domestic producers by capacity, at 62.46 percent of the three-name total on my arithmetic, but the statistic does not break out by company and I cannot allocate it. If the two smaller producers grew faster or slower than the largest, the category growth of 8.8 percent tells me nothing about which of them did what.
It also counts exports only. Domestic sales into Korean tire and cable makers are outside it entirely. And it counts value while saying nothing about volume, so a category where prices are falling can ship materially more tons than the 8.8 percent suggests. That last point cuts in the company’s favor and I want it on the record next to the points that do not.
What survives all of that is narrower than the headline but still worth having. A domestic industry that has been adding capacity aggressively is selling into an export market whose total value grew by single digits over seven months. Volumes may well have grown faster. Value did not.
Kolon Industries stock on a balance sheet that grew 27.97 percent
Away from the fiber, the company’s balance sheet has been getting larger while its income statement has not. I pulled four year-end positions.
| Year end | Total assets | Total liabilities | Total equity | Debt to equity | Book value per share |
|---|---|---|---|---|---|
| 2022 | 6,003.5 | 3,270.4 | 2,733.1 | 119.66% | 86,186 won |
| 2023 | 6,002.7 | 3,073.1 | 2,929.7 | 104.90% | 92,518 won |
| 2024 | 7,248.1 | 3,475.0 | 3,773.0 | 92.10% | 120,405 won |
| 2025 | 7,682.5 | 3,617.5 | 4,065.0 | 88.99% | 129,709 won |
Amounts in billions of Korean won, from the consolidated financial screen at WiseReport, retrieved September 9, 2026. Korean won is the currency of record throughout this piece. I checked that liabilities and equity sum to assets in every row: 2022 and 2025 close exactly, and 2023 and 2024 are each off by 0.1 billion won, which is what rounding to one decimal produces.
Assets grew 27.97 percent across those four years on my calculation. Debt to equity came down every single year, from 119.66 percent to 88.99 percent, and book value per share went from 86,186 won to 129,709 won. On the face of it that is a company steadily strengthening.
Revenue did not grow, and the operating margin was cut by more than half. So the asset base expanded by better than a quarter while the earning power sitting on top of it shrank. Some of that expansion is the aramid plant, which by design earns nothing until it runs. Some of it is not, and I did not manage to split the two.
What Kolon Industries stock costs against book value
The screen prices this company at 0.42 times book value. That number and the 129,709 won book value figure above are two ways of saying the same thing, so I will not treat them as independent evidence.
The forward view is more interesting. Six brokerage houses carry estimates for 2026, and the consensus earnings per share on that screen is 7,015 won. Against the September 9, 2026 close that puts the shares at 7.85 times forward earnings on my own division. The market capitalization works out to about USD 1.23 billion, converted at 1,344.45 won to the dollar.
Two things about those six houses are worth saying out loud. First, they are six separate opinions and the screen shows them as a list of prices without telling me when each was written, so an estimate published before the June quarter results sits in that list looking exactly like one published after. Second, six is not many, and a company this size with a segment mix this broad can easily have three of those six modeling a different business as the swing factor. I discussed the price targets themselves in the Korean edition and am deliberately not repeating them here.
I did check one thing about the consensus that I can verify: the earnings figure implies a substantial recovery from the 2025 result, and the June 2026 quarter reported by the company on August 7, 2026 is consistent with a recovery being underway. Whether it reaches the consensus level is a different question and I have no opinion I can defend on it.
My position on Kolon Industries stock
I do not own it. I have no order in. I am watching, which is where I start with anything outside the top hundred Korean names by market value, and nothing here moved me off that starting point.
What I like is specific and I will state it without hedging. A plant built on a 300 billion won commitment made in 2023 is now running at its full rate, and the company that built it has been reducing leverage every year while doing so, and in August its board raised the interim distribution by half. That is the shape of a capital cycle turning, and I would rather look at it now than after two more quarters of it.
What stops me is also specific. I built this entire piece on a capacity figure and a customs statistic, and neither of them tells me what this company sold. The one number that would settle it, segment-level revenue and operating profit for industrial materials, I did not obtain. I am looking at the outline of a business. The business itself is one disclosure away.
There is a smaller thing I want to record, because it changed the piece. I wrote the export figure into a draft paragraph as a fact about Kolon Industries, and only when I went back to check the attribution did I notice that the trade association counts a product category. It never counted a company. The sentence had read as a finding about this business and it was actually a finding about an industry. I rewrote it, but for about twenty minutes this piece said something I could not support, and it read perfectly well while it did. That is the failure mode I worry about most in a piece built on two numbers.
Where my case for Kolon Industries stock breaks
Two conditions, both testable, both at the same event.
First, whether the September 2026 quarter shows the aramid plant contributing at its full run rate or not. The company has now described the plant as running at capacity. If the September quarter operating result does not improve on the June quarter, then full utilization is not translating into profit at the price this fiber currently commands, and my read of the capital cycle is wrong at the level of unit economics, which is a worse place to be wrong than timing.
Second, whether the segment disclosure in that report lets me do the split I could not do here. If it does and industrial materials is carrying the improvement, the capacity story is the right frame. If the improvement turns out to be sitting in chemicals or apparel, then I built this piece around the wrong division and the tons were a distraction.
Both conditions resolve at the third quarter report, whose statutory deadline is November 16, 2026. And here is the part that bothers me about writing conditions down at all. The report arrives on a fixed date, but the last day on which acting on it would have been useful arrives before that, because a market that expects the answer prices it in ahead of the disclosure. I will find out whether I was right. I will find that out after the window in which being right would have paid for the waiting has already closed. Writing the condition down does not move that window. It only means that when the window has passed I will know exactly what I was waiting for, which is a smaller consolation than it sounds and is still the reason I write them.
Twenty things on the other side
Against everything above, in order of how much each one bothers me.
- The category export value grew 8.8 percent while nameplate capacity grew 104.13 percent. Supply moved far faster than the demand measure I have.
- That export statistic counts a whole product category. It does not identify this company within it and I cannot allocate any of it.
- It counts exports only and excludes domestic shipments entirely.
- It counts value where I wanted tons, so it is contaminated by whatever prices did.
- Korean press reporting in August described bulk-grade para-aramid pricing as having fallen sharply.
- The same reporting quoted an industry source saying Chinese producers run six or seven plants for every one Korean plant. That is one unnamed voice.
- Chinese expansion is an industry condition. No amount of execution by this company resolves it.
- Domestic capacity across the three Korean producers reached 24,510 tons on my addition, and all three added capacity into the same market.
- Taekwang expanded on a larger multiple than Kolon did, from 1,500 tons to 5,500 tons. The smallest player was the most aggressive.
- Total assets grew 27.97 percent over four years while revenue did not grow at all.
- The operating margin over the same four years was cut by more than half.
- My peer table has one measured column because I could not verify a second.
- DuPont and Teijin, the two incumbent global suppliers, are absent from that table for the same reason.
- Two of the three names in the table are diversified groups, so the table describes fiber lines while the row labels name whole conglomerates.
- Only six houses carry estimates, and the screen does not date any of them.
- A 2026 estimate of 7,015 won per share requires a recovery that has so far shown up in two quarters out of the last four.
- The price is 0.42 times book value, which is cheap only if the book is earning something. In 2025 it was barely earning.
- Book value per share grew from 86,186 won to 129,709 won while the shares fell over the same broad stretch. The market has been discounting the book while the book kept growing.
- I could not obtain segment-level revenue or operating profit, so I cannot attribute the recent improvement to any division.
- The demand forecast I found most encouraging, up to 16,000 tons of data center para-aramid demand by 2028, comes from a single brokerage and is two years out.
Related reading: nine fiber and spandex names into one table in August 2026
Prices and multiples reflect the September 9, 2026 close as checked at the time of writing. Dollar conversions are approximate, at roughly 1,344.45 won per dollar as of the September 8, 2026 session, which was the most recent published close at the time of writing. Korean won is the currency of record throughout. Figures I describe as my own calculation were derived by dividing or differencing two sourced values and appear in no source.
Related reading: strongest quarter did not justify annualizing it