KT Stock Has Five Yardsticks for One Quarter and They Disagree
I do not own KT stock and I have no order working. I opened the file on the evening of August 28 (Fri), 2026, after the Seoul close at 54,500 won, because a single line in the second-quarter release would not sit still. Consolidated operating profit came in at 648.3 billion won. Depending on what I held that figure up against, it was a collapse, a recovery, or a beat.
All five comparison points are legitimate. Two of them were written down by named analysts before the numbers were published, so they are not hindsight. One of them is the same company three months earlier. One is the same company a year earlier. One is the company’s own revenue line, which moved the opposite way from its profit line against the very same two forecasts.
What follows is the arithmetic for all five, and my refusal to pick one.
· Price I used: 54,500 won, August 28 (Fri), 2026 close. Market capitalization 13.735 trillion won on 252,022,018 shares issued.
· Reported 2Q26 consolidated operating profit: 648.3 billion won. Revenue 6,679.9 billion won.
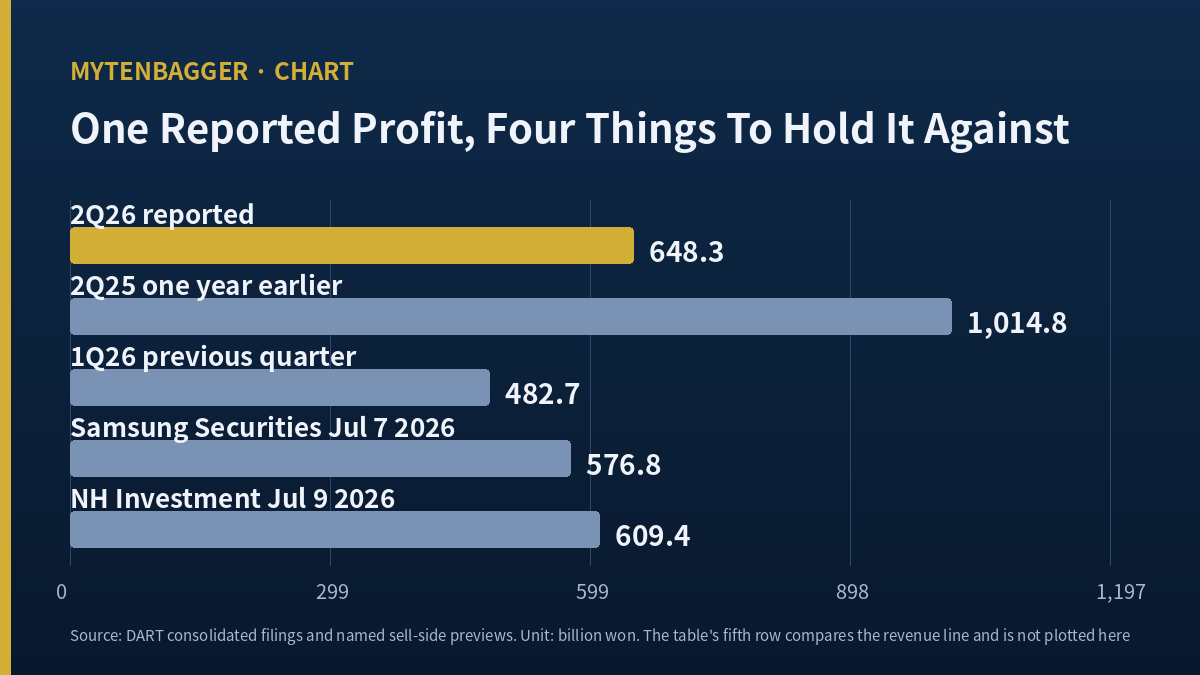
· Against 2Q25 (1,014.8 billion won): down 36.1%. Against 1Q26 (482.7 billion won): up 34.3%.
· Against Samsung Securities’ pre-print estimate (576.8 billion won): up 12.4%. Against NH Investment’s (609.4 billion won): up 6.4%.
· Revenue against those same two forecasts: down 1.7% and down 2.3%.
· My stance: not held, no order, watching. One of Korea’s three telecom carriers, listed on the KOSPI, Korea’s main board.
Contents
KT Stock Reported One Quarter and I Found Five Ways to Score It
Here is the whole problem in one table. Four of the five rows hold the same 648.3 billion won up against something different. The fifth swaps the profit line for the revenue line and keeps the two forecasts fixed.
| What I measured against | That figure | The 2Q26 print reads as |
|---|---|---|
| Same quarter, one year earlier (2Q25) | 1,014.8bn won | down 36.1% |
| Previous quarter (1Q26) | 482.7bn won | up 34.3% |
| Samsung Securities estimate, July 7 (Tue), 2026 | 576.8bn won | up 12.4% |
| NH Investment estimate, July 9 (Thu), 2026 | 609.4bn won | up 6.4% |
| Its own revenue line, versus the same two houses | 6,797.4bn / 6,840.0bn won | revenue down 1.7% / 2.3% |
Sign. That is the thing I keep coming back to. Three of these five comparisons produce a positive number and two produce negative ones. Four of the five describe the identical 648.3 billion won, and the fifth swaps in the revenue line while holding the same two forecasts fixed. I have written plenty of entries where I argued about how big a number was. This is the first time I have written one where I could not settle what direction it pointed. All figures above are DART consolidated filings and named sell-side reports; the percentages are my own division.
Why the year-ago figure is the odd one out
The 1,014.8 billion won in the second quarter of 2025 contains a one-off property development gain. KT’s real estate arm booked profit from an apartment development in Seoul that quarter, and Korean press put the size of it in the high 300 billion won range. The company itself named that base effect as the reason for this year’s decline when it reported on August 12 (Wed), 2026.
So the largest of my five comparisons is measured against a quarter that will not repeat. That does not make the 36.1% wrong. It makes it a fact about 2025 as much as a fact about 2026, and I am not willing to let a single figure carry both jobs.
Where KT Stock Sat on the Day I Checked
Korea’s exchange lists this company on the KOSPI, the main board, under code 030200. Everything below is the August 28 (Fri), 2026 close.
| Measure | Value | Basis |
|---|---|---|
| Close | 54,500 won (about $39.57) | Aug 28 (Fri) 2026, at about 1,377 won per dollar |
| Market capitalization | 13.735tn won (about $9.97bn) | 252,022,018 shares issued, my calculation |
| P/E | 7.93x on FY2025 owners’ earnings | Kiwoom Securities data screen, fiscal 2025 owners’ earnings |
| P/E, trailing twelve months | 9.80x | stockanalysis.com, screen dated Aug 19 (Wed), 2026 |
| P/B | 0.76x | Book value 71,886 won, June 2026 owners’ equity approximation |
| Dividend yield | 4.40% | FY2025 dividend of 2,400 won per share, my calculation |
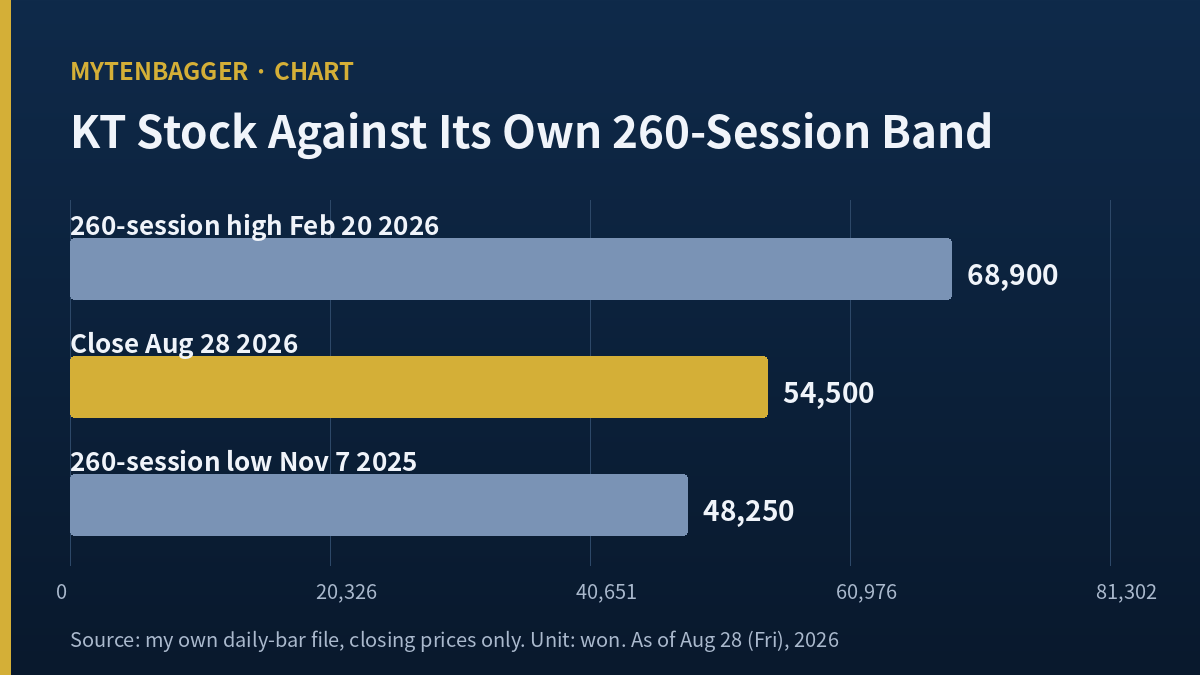
| 260-session closing high / low | 68,900 / 48,250 won | Feb 20 (Fri) 2026 / Nov 7, 2025, computed from daily bars |
| Twelve-month price change | up 0.93% | Against the 54,000 won close of Aug 28, 2025, my calculation |
Two of those rows deserve a sentence. The 7.93x multiple divides the price by 6,869 won of earnings per share, and 6,869 won multiplied by 252,022,018 shares gives 1.731 trillion won, which matches the 2025 profit attributable to owners of the parent almost exactly. The consolidated net income figure is 1.837 trillion won, so anyone quoting the multiple against consolidated profit is off by about six percent.
The 0.93% twelve-month move is the other one. Over those twelve months the price touched both 68,900 won and 48,250 won and came back to roughly where it started. On a total return view, most of what a holder received in that window arrived as the 4.40% dividend.
Four vendor fields I did not copy
The Kiwoom Securities data screen I use labels its 250-session high and low as close-based and returns 69,400 and 48,100 won. I pulled 260 daily bars and checked. Neither 69,400 nor 48,100 appears anywhere in my closing-price column, and both appear in the high and low columns, which are the columns I distrust for the reason at the end of this paragraph. What the screen label actually refers to is something I could not settle, so I recomputed the extremes from closing prices alone and used my own numbers of 68,900 and 48,250 won in the table above. The screen’s six-month and twelve-month return fields are anchored 185 and 379 days back, so I recomputed both from the actual dates. And in eleven of the 260 rows the closing price falls outside that session’s own high and low, which is why no daily move appears anywhere in this entry as evidence.
The Two Houses That Wrote a Number Down Before the Print
This matters more to me than the year-ago comparison, because a forecast is a claim someone made when they still could be wrong.
Samsung Securities’ Choi Min-ha published a second-quarter preview on July 7 (Tue), 2026 carrying operating profit of 576.8 billion won and revenue of 6,797.4 billion won. NH Investment’s Ahn Jae-min followed on July 9 (Thu), 2026 with 609.4 billion won and 6,840.0 billion won. Both were reported in Korean financial press at the time.
Against Samsung, the reported profit came in 12.4% higher and the reported revenue 1.7% lower. Against NH, profit 6.4% higher and revenue 2.3% lower. I checked both divisions by hand.
What I take from this is narrower than it looks. Two analysts, publishing two days apart with the same public information, landed 32.6 billion won apart on the profit line, which is about 5.6% of the smaller estimate. The company then printed above both. A gap that size between two careful forecasters tells me the quarter had a component neither could pin down in advance, and the property base effect is the obvious candidate.
The comparison I refuse to write
There is a sentence available to me here that I am not going to write, and I want to be explicit about why. I could say the quarter was strong because it exceeded both published estimates. I could equally say the quarter was weak because profit fell by more than a third. Both sentences are arithmetically true and both are misleading on their own. When a single reported figure supports opposite headlines, my job in a journal like this one is to record the spread and wait, so that is what I have done.
The Four Annual Estimates I Could Reach on KT Stock
Quarterly forecasts are one thing. Annual ones tell me how much spread there is in the view of the business itself.
| House / analyst | Report date | 2026E consolidated operating profit | 2027E |
|---|---|---|---|
| SK Securities / Choi Kwan-soon | Feb 11 (Wed) 2026 | 2,177bn won | 2,294bn won |
| Daishin Securities / Kim Hoi-jae | Jan 21 (Wed) 2026 | 2,176bn won | 2,352bn won |
| Samsung Securities / Choi Min-ha | Apr 17 (Fri) 2026 | 2,075bn won | 2,280bn won |
| Hana Securities / Kim Hong-sik | May 14 (Thu) 2026 | 1,966bn won | 2,079bn won |
Top to bottom, the 2026 spread is 10.7% of the lowest figure and the 2027 spread is 13.1%. For a regulated carrier that is a tight band. My first read was that the next two years are not seriously in dispute among the people paid to model it. The next two paragraphs are me taking most of that back.
What a tight spread does and does not tell me
A 10.7% band across four houses is narrow, and I want to be careful about what I read into it. It tells me the modeled revenue base is stable, which for a carrier with roughly 83% 5G penetration and regulated pricing is close to a tautology. It does not tell me the four analysts agree on why. All four of these figures were set before the tariff consolidation took effect on July 1 (Wed), 2026, and all four before the company disclosed its 2028 targets on August 12 (Wed), 2026. A tight band assembled from four models that all predate the two events most likely to move them is a weaker signal than its width suggests.
There is also an asymmetry worth naming. The lowest of the four sits 5.3% below the second-lowest, while the top three cluster within 4.9% of each other. So the band is not evenly filled. One house is meaningfully more cautious than the group, and the group is tightly packed above it. That shape carries more information than the width of the band on its own.
One limitation belongs here rather than in a footnote. Every one of those four tables was published between January and May of 2026. I could not obtain a full annual model from any house that was built after the second-quarter print and the company’s investor day, both of which landed on August 12 (Wed), 2026. I am not claiming none exists. I am recording that I could not reach one.
What the company said about itself that day
At its investor day on August 12 (Wed), 2026, KT put out targets for 2028: return on equity of 9% to 10%, a consolidated operating margin above 9%, and a doubling of its AI transformation revenue against the 2025 level. It also committed 750 billion won of share buybacks and cancellations across 2026 to 2028, with the 2026 tranche due to complete by September 9 (Wed), 2026, and set out plans to add one gigawatt of data center capacity by 2031. Those are company targets. None of the four estimates above extends to 2028, so I have no outside model to hold them against yet.
KOSPI, the ADR, and the Two Closes That Are Not the Same Moment
KT trades on the New York Stock Exchange as an American Depositary Receipt under the ticker KT, and it closed at $19.63 on August 28, 2026, with a quoted market capitalization near $9.53 billion.
The ratio checks out arithmetically. The Seoul close of 54,500 won converts to about $39.57 at roughly 1,377 won per dollar, and $19.63 doubled is $39.26, which puts the ADR at half an ordinary share within 0.8%. I derived that ratio from the two prices; I did not read it off a deposit agreement, so treat it as my calculation and not as a confirmed term.
Here is the part that took me a moment. Those two closing prices are both dated August 28, 2026, and they are not the same instant. Seoul finished its session roughly fourteen hours before New York did. Any conversion between the two carries that gap inside it, which is one reason the won market capitalization of 13.735 trillion and the ADR figure of about $9.53 billion do not reconcile exactly even after the currency conversion. The other reason is that the New York quote is computed on shares excluding treasury stock. Neither number is wrong. They answer slightly different questions asked at slightly different times.
Global Peers, and the Rows I Took Out of the Table
I organized this comparison around what I removed rather than around what I kept, because the removals were the informative part.
| Carrier | P/E | P/B | ROE | As of |
|---|---|---|---|---|
| AT&T (NYSE: T) | 8.57 | 1.62 | 18.34% | Aug 28, 2026 |
| Verizon (NYSE: VZ) | 13.05 | 2.00 | 15.84% | Aug 28, 2026 |
| T-Mobile US (Nasdaq: TMUS) | 19.02 | 3.46 | 17.99% | Aug 28, 2026 |
| Deutsche Telekom (ETR: DTE) | 16.20 | 1.56 | 15.06% | Aug 21, 2026 |
| Orange (EPA: ORA) | 12.39 | 1.24 | 14.16% | Aug 14, 2026 |
| NTT (TYO: 9432) | 12.24 | 1.23 | 10.04% | Jul 28, 2026 |
| KDDI (TYO: 9433) | 14.83 | 1.85 | 14.01% | Jun 22, 2026 |
| Chunghwa Telecom (TPE: 2412) | 26.61 | 2.52 | 9.99% | Jul 13, 2026 |
| Singapore Telecom (SGX: Z74) | 13.09 | 2.50 | 20.55% | Jul 13, 2026 |
| Telefónica (BME: TEF) | removed | 1.11 | -10.34% | Loss over the trailing year, so no meaningful P/E |
| SK Telecom (KRX: 017670) | removed | removed | removed | Same provider showed 25.82 and 28.87 on two of its own pages |
| LG Uplus (KRX: 032640) | removed | removed | removed | Quote page dated Jul 9, 2026 against a statistics page dated later |
Peer figures above come from stockanalysis.com, and the as-of column is theirs. I want the two Korean removals on the record because they cut in a specific direction: the same provider’s data on Korean listings runs stale and disagrees with itself, which is why I built this company’s own price and multiple rows from domestic vendor and filing data, and did not put its own row into the peer table. The one place I do quote this provider on this company is the trailing-twelve-month multiple in the table further up, and it sits there as a second opinion that disagrees with the domestic screen.
Reading across the rows that survived, the range running from under nine to just under twenty-seven tells me telecom carriers are not priced as one asset class. Reading down the as-of column tells me something more useful for anyone tempted to build a screen on this: three of these nine rows are more than a month stale.
One thing I could not establish belongs with the table. The provider does not print a fiscal year end on any of these pages, and several of these carriers are commonly understood to close their books in months other than December. I have therefore left the fiscal period column out entirely instead of filling it from memory. A P/E computed on a year ending in March and one computed on a year ending in December are not the same measurement, and I would rather show a table with a missing column than one with a column I guessed at.
The one comparison I will make
AT&T at 8.57x on an 18.34% return on equity, and this company at 7.93x on the 10.2% return on equity its domestic vendor screen reports for fiscal 2025, are close enough on the price side to make the profitability side the interesting difference. That is as far as I will take it. The two multiples come from different providers, on different fiscal periods, under different accounting regimes, and I have not normalized them.

What Would Break This Reading of KT Stock
Five things that argue against everything above. I put them in the order I found them.
- The wireless business is shrinking. Second-quarter wireless service revenue fell 1.8% and average revenue per user fell 2.3% to 34,412 won, with 5G penetration at 83.2%. A tariff simplification that took effect on July 1 (Wed), 2026 cut KT’s plan count from 105 to 18 and is estimated by industry sources to reduce combined revenue across Korea’s three carriers by several hundred billion won a year.
- Subscribers left. Following a penalty waiver program tied to a 2025 data breach, roughly 234,620 accounts moved to other carriers within two weeks by one Korean count, and the remediation carried its own cost.
- A regulator penalized the company during the period I am examining. Korea’s data protection commission issued a fine that was booked as a non-operating expense in this same second quarter, as Korean financial press reported, and the company has signaled it may contest the decision, so the amount finally paid is unsettled. I treat the accounting entry as fixed and the cash outcome as open.
- The 7.93x multiple rests on a year with property income in it. The trailing-twelve-month figure from an outside provider sits at 9.80x on a screen dated August 19 (Wed), 2026. Both are true. They are answering different questions about which year to use.
- I could not find the other side of the trade. Within the sources I can reach, I did not locate a single Korean brokerage carrying a sell or hold rating on this name. A view that is unanimous in my sample is more likely to mean my sample is narrow than that the question is settled.
The date this entry expires
This reading holds until the third-quarter report, which the company has indicated for November 10 (Tue), 2026. That print is the first one whose year-ago comparison contains no property gain. When the base is clean, the year-on-year reading stops pulling against the other four, and the exercise this entry is built on stops being necessary. I will look at that release specifically to see whether the year-on-year and the versus-estimate numbers finally agree on a sign.
Related reading: an earlier entry on SK Telecom and this company, LG Uplus and its second quarter, an entry on KakaoBank

Prices and multiples in this entry reflect the August 28 (Fri), 2026 Seoul close as I checked them at the time of writing. The Korean won is the reference currency throughout; dollar conversions are approximate, at roughly 1,377 won per dollar on that date, sourced from Investing.com. Values I describe as my calculation are not present in any source document and were derived by me. Financial figures are consolidated DART filings unless labeled otherwise, and single-quarter values were separated from cumulative filings. Company statements, regulator decisions and sell-side estimates come from different parties and are attributed individually throughout. Peer data is from stockanalysis.com with its own as-of dates shown; Korean press sources include Electronic Times and ZDNet Korea.
Related reading
- Hancom Stock Rests On a Second Half That Has to Double
- SBS Stock Is Priced Off a Book Value It Gave Back in Six Months