Chong Kun Dang Earnings: Wegovy Is Its Top Seller, Not Its Drug
Wegovy. That was the biggest single product line at Chong Kun Dang Pharmaceutical in the first half of 2026, at KRW 93.5 billion (about USD 67.4 million). It is a Novo Nordisk drug. Who captures the economics of a drug someone else discovered is the same question I ran at Alteogen and its 2 percent royalty, from the licensor’s side instead. Chong Kun Dang co-promotes it in Korea under an agreement that started in October 2025.
I went looking at Chong Kun Dang stock (KOSPI: 185750) because the margin line had gotten strange, and I came out the other side with a question about ownership. Roughly one revenue won in ten now comes from a medicine this company did not discover, does not own, and cannot price. That share is up from nothing two years ago, and the company’s gross margin has moved in the opposite direction over the same stretch.
What follows is the arithmetic I ran, the sources I used, and the eight places where I think I could be wrong.
Consolidated revenue mix, first half of 2026
| Line | KRW bn | Share | Who owns the product |
|---|---|---|---|
| Licensed-in goods | 494.8 | 53.42% | Other companies |
| Own products | 410.3 | 44.30% | Chong Kun Dang |
| Other | 21.1 | 2.28% | Mixed |
| Total | 926.2 | 100% |
Component figures reported by Korean press from the half-year filing; shares are my own division. USD equivalents throughout use roughly KRW 1,386.5 per dollar, the Seoul close on August 21, 2026.
Contents
What Chong Kun Dang Stock Is Actually Selling
A quick orientation for readers who do not follow Korea. The KOSPI is the senior board of the Korea Exchange, the equivalent of a main-market listing, with the KOSDAQ sitting alongside it as the growth board. Chong Kun Dang trades there under 185750. Its holding company, Chong Kun Dang Holdings, is separately listed under 001630, and the two get confused in headlines constantly, so I checked every filing against the ticker before using it.
The licensed-in half
Korean pharmaceutical companies routinely carry two kinds of revenue. One is medicine they developed or hold rights to. The other is medicine developed elsewhere that they market in Korea under a co-promotion or in-licensing arrangement. The second kind builds scale fast and earns a thinner slice, because the originator keeps the value of the molecule.
At Chong Kun Dang the second kind crossed the halfway mark. Licensed-in goods reached KRW 494.8 billion (about USD 356.9 million) of the KRW 926.2 billion consolidated first-half total, which is 53.42 percent by my division. Own products came to KRW 410.3 billion, or 44.30 percent. The three components add exactly to the reported total, which is the first check I run on any mix table.
Wegovy on its own
Inside that half, one name dominates. Wegovy contributed KRW 93.5 billion in the six months, which is 10.10 percent of consolidated revenue by my calculation. The first quarter piece was KRW 48.8 billion, so the second quarter came to KRW 44.7 billion by subtraction. Korean trade press, including ZDNet Korea, describes the arrangement as a co-promotion with Novo Nordisk’s Korean arm that began on October 1, 2025, with both companies working the same hospital accounts, so calling it distribution would misstate the structure.
Two older licensed lines went the other way in the same half. Prolia fell roughly 20 percent and Gliatilin roughly 30 percent, as reported by Korean press summarizing the half-year filing. So the mix did not simply grow; it rotated toward one very large, very new, externally owned line.
Chong Kun Dang Stock and a Gross Margin of 28.6 Percent
The mix shows up one line lower. Cost of sales took 68.9 percent of revenue in the first half of 2025 and 71.4 percent in the first half of 2026, a rise of 2.5 percentage points, as Asia Today reported on August 18, 2026. Gross profit grew only 1.8 percent while revenue grew 10.82 percent.
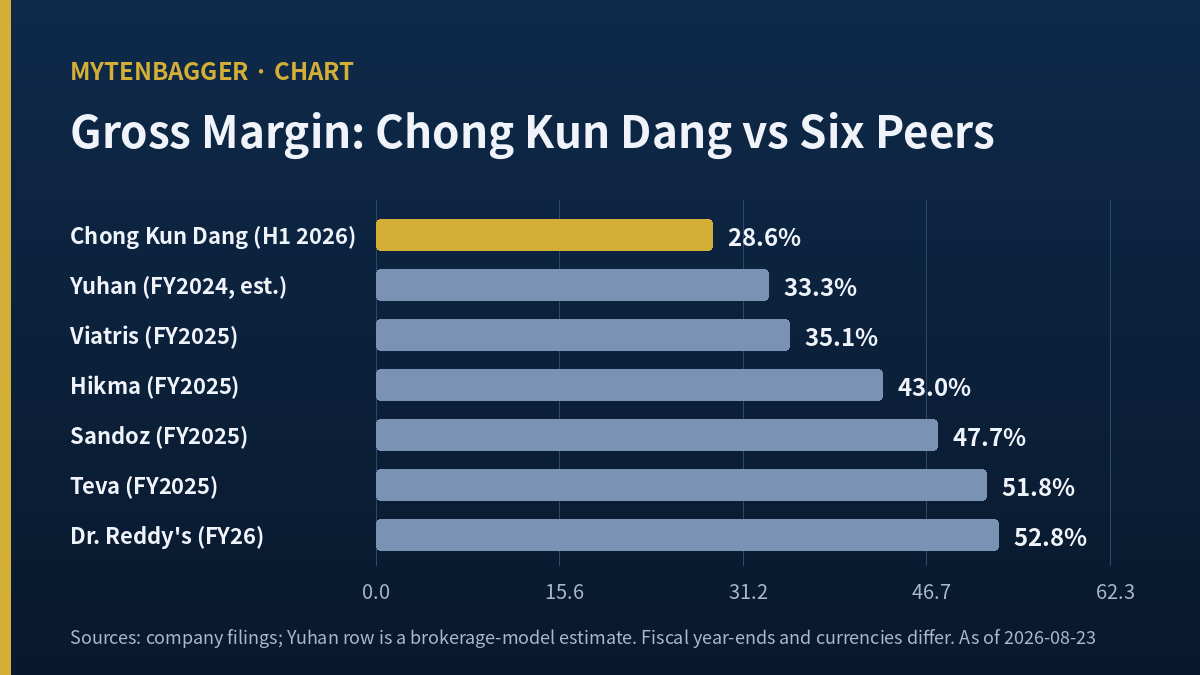
Flip those cost ratios and you get gross margin: 31.1 percent falling to 28.6 percent. That is the number I kept coming back to, because a pharmaceutical company running below thirty percent gross margin is not really being priced as a pharmaceutical company. It is being priced as something closer to a specialty distributor with a research budget attached.
The research budget is real, for the record. Korean reporting puts research spending at KRW 185.8 billion in 2025 against KRW 157.4 billion in 2024, taking it from 9.92 percent to 10.98 percent of revenue. So the company is carrying originator-level research cost on distributor-level gross margin. That combination is the whole story of the operating line right now.
The Six Quarters Behind Chong Kun Dang Stock
| Quarter | Revenue (KRW bn) | Operating profit (KRW bn) | Operating margin |
|---|---|---|---|
| Q1 2025 | 400.96 | 12.45 | 3.11% |
| Q2 2025 | 434.85 | 23.64 | 5.44% |
| Q3 2025 | 429.82 | 20.99 | 4.88% |
| Q4 2025 | 426.78 | 23.48 | 5.50% |
| Q1 2026 | 447.77 | 14.09 | 3.15% |
| Q2 2026 | 478.47 | 18.61 | 3.89% |
Consolidated, from Korean regulatory filings (half-year report filed August 14, 2026; 2025 annual report filed March 18, 2026). The Q4 2025 line is the annual figure minus nine-month cumulative, computed by me. Margins are my own division.
The second quarter of 2026 produced the largest revenue of the six at KRW 478.47 billion. Its operating margin of 3.89 percent ranks fourth of the six. I sorted the column before writing that sentence, because ranking claims are the easiest place to be casually wrong.
Widen the frame and the pattern hardens. Full-year 2023 revenue was KRW 1,669.4 billion and full-year 2025 was KRW 1,692.4 billion, a gain of 1.38 percent across two years. Operating profit over the same two years went from KRW 246.6 billion to KRW 80.6 billion, a decline of 67.33 percent by my calculation. Revenue held still and the operating line lost two thirds of itself.
Two Operating Profits Filed for One Half-Year
Here is a wrinkle worth flagging for anyone reading Korean earnings headlines. This company filed two different first-half operating profits, and both are correct.
The preliminary disclosure of July 31, 2026 is on a separate-entity basis and shows KRW 37.47 billion, up 7.1 percent year over year. The half-year report filed August 14, 2026 is consolidated and shows KRW 32.70 billion, down 9.41 percent. Same six months, same company, opposite direction.
The gap is KRW 4.77 billion (about USD 3.4 million) by subtraction, with consolidated smaller. On revenue the gap runs the other way: consolidated is KRW 3.13 billion larger. Put those two together and the subsidiaries added revenue while removing operating profit. A year earlier the consolidated figure sat above the separate one, so the direction of that contribution turned over within twelve months.
I could not establish which subsidiary produced the KRW 4.77 billion. Non-controlling interests took only KRW 0.22 billion of first-half net income, which is far too small to account for it, and entity-level detail lives in filing footnotes I did not open. I am confident about the gap and not about its owner.
Where Chong Kun Dang Stock Sits Among Global Peers
I split the comparison group in two, because the interesting question is not who has the best gross margin but whether companies with a similar revenue structure land in a similar place.
Group one, businesses carrying heavy third-party or licensed-in volume:
| Company | Fiscal year | Revenue | Gross margin |
|---|---|---|---|
| Chong Kun Dang | H1 2026 (Dec year-end) | KRW 926.2bn | 28.6% |
| Viatris | FY2025 (Dec) | USD 14,299.9m | 35.1% |
| Yuhan (Korea, 000100) | FY2024 (Dec) | KRW 2,068bn | 33.3% |
Group two, businesses selling mostly their own portfolio:
| Company | Fiscal year | Revenue | Gross margin |
|---|---|---|---|
| Dr. Reddy’s | FY26 (March) | INR 335,933m | 52.8% |
| Teva | FY2025 (Dec) | USD 17,258m | 51.8% |
| Sandoz | FY2025 (Dec) | USD 11,086m | 47.7% |
| Hikma | FY2025 (Dec) | USD 3,349m | 43.0% |
Fiscal year-ends and reporting currencies differ across these six, so the levels are indicative and the ordering is what I lean on. The Yuhan cost line comes from a Korean brokerage financial model; the audited statement was not available to me, so I flag that row as an estimate. Dr. Reddy’s is a March year-end.
The split holds up, roughly. The two companies closest to Chong Kun Dang on gross margin are the two whose revenue also leans on third-party volume. I went through Yuhan’s own record quarter and how much of it actually recurs in a separate entry. But the group is not clean evidence for my case, and one line inside it argues against me. Dr. Reddy’s gross margin fell from 58.5 percent to 52.8 percent in a single year, a drop of 573 basis points the company ascribes to loss of exclusivity and to pricing pressure, neither of which has anything to do with licensed-in mix. Margin compression in this industry has more than one cause, and mix is only the one I happened to be tracing.
KRW 487.4 Billion in Siheung and the 626,712 Shares Behind It
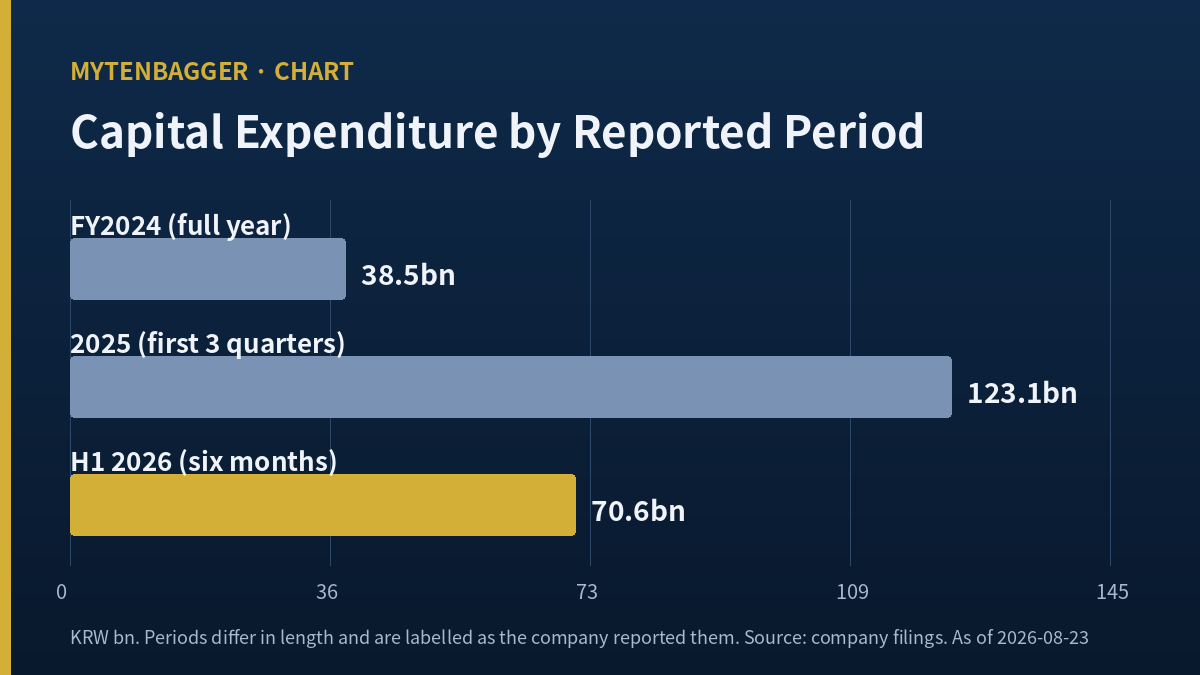
While the operating line was thinning, spending went the other way. Capital expenditure was KRW 38.5 billion for all of 2024. It was KRW 123.1 billion through just three quarters of 2025, and another KRW 70.6 billion (about USD 50.9 million) in the first half of 2026. That last figure is 2.16 times the same period’s operating profit by my calculation. Operating cash flow of KRW 25.6 billion could not cover it, so free cash flow came to negative KRW 45.0 billion.
The money has one destination: a site in Baegot, Siheung, west of Seoul. The company bought 79,790.8 square meters of land for KRW 94.88 billion, and on June 11, 2026 it approved a facility investment of KRW 392.5 billion due for completion on August 31, 2028. Land plus facility is KRW 487.4 billion (about USD 351.5 million) by addition, and the company’s own filing describes the facility portion as 39.0 percent of shareholders’ equity. Korean coverage also carries a figure of KRW 2.2 trillion for the full complex, but the company clarified on June 10, 2026 that only the land contract was firm. Those two numbers measure different things and should not be blended.
The funding side has a detail that a US reader would want. In September 2025 the company issued an exchangeable bond backed by its entire treasury holding of 626,712 shares, at an exchange price of KRW 97,500, zero coupon and zero yield to maturity, exchangeable from November 14, 2025 through September 14, 2030. Proceeds go to Baegot.
Those 626,712 shares are 4.54 percent of shares outstanding by my division, and the arithmetic closes to the won: 626,712 multiplied by KRW 97,500 equals KRW 61,104,420,000, roughly USD 44.1 million. The ownership table independently agrees. Chong Kun Dang Holdings and five related parties hold 5,542,063 shares and free float is 7,634,005; those two sum to 13,176,068, and the difference from total shares outstanding is exactly 626,712.
The exchange price sits 31.39 percent above the August 21, 2026 close, so nothing converts at today’s price. I treat that 4.54 percent as dilution attached to a recovery in the share price, and as nothing at all at today’s level.
What Chong Kun Dang Stock Costs on the Screen
Every price in this piece is the close of Friday, August 21, 2026. I am writing on Sunday, August 23, so the most recent trading session is the reference.
The 250-day window
The close was KRW 66,900, about USD 48.25. Market capitalization works out to KRW 923.4 billion, roughly USD 666.0 million, using 13,802,780 shares outstanding. On adjusted closes the shares sit at 68.20 percent of the 250-day high of KRW 98,100 and 6.2 percent above the 250-day low of KRW 63,000. Measured on closing prices alone the peak was KRW 97,700 on February 19, 2026 and the trough KRW 64,100 on June 26, 2026, putting the shares 31.53 percent below that peak and 4.37 percent above that trough. Trailing returns are positive 1.21 percent over one month, negative 14.78 percent over three, negative 29.8 percent over six and negative 18.41 percent over twelve.
Two book values on two screens
Trailing price to earnings is 11.91 times. Price to book is either 0.86 or 0.88 times depending on which data screen you open, and I chased down why. One screen carries book value per share of KRW 77,497 and the other KRW 76,180. The second one reproduces cleanly: 2025 year-end equity attributable to owners of KRW 1,003.75 billion divided by 13,176,068 shares excluding treasury gives KRW 76,180.09. The first one I could not reconstruct from any combination I tried, so I did not build anything on it. Either way the shares change hands below stated book.
Earnings per share of KRW 5,615 does reproduce exactly. Divide 2025 net income attributable to owners of KRW 77.51 billion by 13,802,780 shares and you get KRW 5,615.39. Using total consolidated net income instead gives KRW 5,638, so the screen is on an owners basis. I mention this because the same vendor field behaved the same way on the last Korean name I checked, and consistency in a data field is worth writing down when you find it.
Five Korean Brokers Wrote Three Different Directions
| Date | House and analyst | Valuation move |
|---|---|---|
| Feb 3, 2026 | Daol Investment, Lee Ji-soo | KRW 110,000 |
| Feb 27, 2026 | Mirae Asset (author unconfirmed) | 110,000 to 155,000 |
| May 29, 2026 | Heungkuk Securities, Lee Ji-won | KRW 100,000 |
| Jul 8, 2026 | NH Investment, Han Seung-yeon | 115,000 to 100,000 |
| Jul 21, 2026 | iM Securities, Jung Jae-won | 120,000 to 90,000 |
Seven 2026 notes turned up in my search and five carried a figure I could confirm. Two more, from Daol and Kiwoom in early August, were described as reductions without a number I could verify, so they are absent from the table.
The forecasts diverge more than the valuations do. For full-year 2026 operating profit, Mirae Asset modeled KRW 85.8 billion, an increase. Heungkuk modeled KRW 80.6 billion, essentially flat. Daol modeled KRW 79.5 billion, a decrease. Revenue estimates cluster tightly between KRW 1,882.4 billion and KRW 1,900 billion, which means the entire disagreement, KRW 6.3 billion wide between the highest and lowest, lives in the cost-of-sales assumption. Three analysts looking at the same revenue and disagreeing about the margin is a reasonable summary of where this company is.
Their reasoning converges even where their numbers do not. NH’s Han Seung-yeon cited weakening profitability on existing medicines, drug pricing and reimbursement changes, thin-margin newly licensed items, and rising net debt from the Baegot program, in a July 8, 2026 note summarized by Edaily. iM’s Jung Jae-won argued that Wegovy, Godex and Fexuclue are expanding the top line while the cost ratio pushes operating profit into decline, in a July 21, 2026 note summarized by Medico Pharma. I read both through Korean secondary coverage and not in the original documents, which I would rather state than imply.
Numbers I Checked and Did Not Use
The word “separate” is the reason this section exists. When I first opened the July 31 preliminary disclosure I wrote down an increase and moved on, and it was only two weeks of filings later that I noticed I had recorded a separate-entity figure as though it settled the consolidated question. The error was not reading the wrong document. It was reading the right document and skipping the label on it.
The dividend series, and why I dropped it
The 2025 dividend was KRW 500 per share against KRW 1,100 the year before, approved at the March 26, 2026 annual meeting, with management citing higher research spending. That is a 54.5 percent cut on its face, and the payout ratio computes to 8.9 percent against earnings per share. I left it out because this company has run a roughly five percent bonus share issue almost every December since 2018, most recently approved in December 2024 with 628,360 new shares listed in January 2025, and the dividend history field I was reading had not been adjusted for any of them. An unadjusted per-share series overstates the cut. I would rather drop a striking number than publish one I know is measured on a shifting share count.
I also set aside a few vendor-screen fields after reconstructing them. A figure labeled EBITDA of KRW 14.09 billion turned out to equal first-quarter 2026 operating profit to the won, with no depreciation added, so it is not EBITDA in any usable sense. An interest coverage ratio of 5.84 does reconstruct correctly as first-half operating profit over first-half interest expense of KRW 5.60 billion. A free cash flow yield of negative 4.87 percent mixes a half-year cash flow with a full market capitalization, so the period does not line up. Return on equity of 8.2 percent reconciles against average equity attributable to owners. Forward estimate fields were empty across the board.
Eight Ways Chong Kun Dang Stock Could Prove Me Wrong
- The mix thesis is a correlation I have not proven. Gross margin fell and licensed-in share rose in the same period. I have company and analyst commentary tying them together, but I have no product-level cost disclosure that isolates the effect.
- On a separate-entity basis this business is improving. First-half operating profit of KRW 37.47 billion was up 7.1 percent. If you believe the parent company is the business and subsidiaries are noise, the trend reverses.
- I never found the owner of the KRW 4.77 billion gap. Knowing that consolidated trails separate is not the same as knowing why.
- Thin-margin revenue is still revenue. Wegovy scale buys sales-force reach, hospital relationships and cash, and management describes the current profitability squeeze as a stage the company is passing through. That reading is available on the same facts.
- Baegot spending is capital formation. Negative free cash flow while building a plant through 2028 is ordinary. Judging that program requires utilization data that will not exist for years.
- Regulation cuts against my framing too. Korea is moving the reimbursement price of listed generics from 53.55 percent of the originator to 45 percent, reportedly effective in August 2026, as Sisa Journal e reported on May 15, 2026. That pressures own-product margin, which is the half I have been treating as the healthier one.
- Peer evidence is mixed, as noted above. Dr. Reddy’s lost 573 basis points of gross margin for reasons unrelated to licensed-in mix.
- I put no value on the pipeline. A domestic phase 3 for the hypertension combination CKD-339 was cleared on July 27, 2026; the in-house antibody-drug conjugate CKD-703 dosed its first patient in a US phase 1/2a in April 2026; and on August 21, 2026 the company in-licensed Korean rights to Kiora Pharmaceuticals’ KIO-301, with financial terms undisclosed. None of that is in the income statement, and I have no basis for pricing it. Leaving something out is different from valuing it at zero.
When This Piece Stops Being True About Chong Kun Dang Stock
At USD 666.0 million of market value it sits outside the range where I take a stance, and finishing the arithmetic did not move me.
What would retire this piece is narrow and specific. Everything above rests on one structural claim: the majority of what this company sells belongs to somebody else, and that majority is what the margin line is paying for. So the frame collapses the moment own products cross back above licensed-in goods as a share of revenue.
That crossing can arrive from either side. Own-product revenue can grow, through the phase 3 program or through prices holding better than the reimbursement reform implies. Or licensed-in revenue can shrink, most plausibly if the Wegovy arrangement is renegotiated, since one co-promotion is carrying 10.10 percent of the top line by itself. The first version would mean the mix problem was a passage. The second would mean I was watching the right ratio for the wrong reason, because the thing that fixed it also removed a tenth of the revenue.
Until one of those shows up in a filing, I will keep reading two lines each quarter: licensed-in share of revenue, and cost of sales as a percentage of it. If licensed-in share drops below fifty percent while the cost ratio also falls, I will have been wrong about how permanent this was, and I will say so here. I would rather be corrected by a filing than by a price.
Prices and multiples reflect the August 21, 2026 close as I checked them at the time of writing, so live quotes can differ. Financial statement figures come from Korean regulatory filings, with the half-year report filed August 14, 2026 and the 2025 annual report filed March 18, 2026, and from the company’s preliminary earnings disclosures. USD equivalents are approximate, at roughly KRW 1,386.5 per dollar on the same date, and the Ratios and divisions not present in the original filings are labeled as my own calculation.