
Doosan Robotics Stock And Six Months That Matched A Year
Doosan Robotics stock closed at 69,000 won on Tuesday, September 1, 2026, which is about USD 50.35 at the 2026-09-01 exchange rate I use throughout this piece. Before I looked at what that price implies, I asked one question of the income statement. Doosan Robotics booked 32.968 billion won of revenue in the first half of 2026. It booked 32.978 billion won across the whole of 2025. Six months came out level with a full year, and the gap between the two figures is 10 million won.
First half of 2026 revenue 32.968 billion won (USD 24.06 million) and operating loss 26.487 billion won (USD 19.33 million)
Full year 2025 revenue 32.978 billion won (USD 24.06 million) and operating loss 59.473 billion won (USD 43.40 million)
Doubling the half year puts revenue at 1.999x the 2025 figure and the operating loss at 0.891x it
Consolidated figures from Korea’s electronic disclosure system. The doubling in the third line is arithmetic I performed, not a company forecast. Won amounts use an exchange rate of 1,370.4, the Seoul market daytime close of 2026-09-01 (Tuesday).
Contents
Why Doosan Robotics Stock Sent Me To The Statements First
I have skipped this name for a long time. Not because it loses money, but because the figures in the coverage kept arriving in units that did not agree with each other. So this time I opened nothing but the filings, pulled eight quarters of single quarter numbers, and added them in two groups of four.
The front four quarters
| Quarter | Revenue | Operating result |
|---|---|---|
| Q3 2024 | 10.034 | -9.588 |
| Q4 2024 | 11.490 | -16.858 |
| Q1 2025 | 5.279 | -12.107 |
| Q2 2025 | 4.532 | -15.650 |
Billions of won, consolidated, single quarter. The fourth quarter row is annual minus the nine month cumulative figure, because Korean issuers do not file a standalone fourth quarter.
The back four quarters
| Quarter | Revenue | Operating result |
|---|---|---|
| Q3 2025 | 10.165 | -15.266 |
| Q4 2025 | 13.002 | -16.450 |
| Q1 2026 | 15.294 | -12.070 |
| Q2 2026 | 17.674 | -14.417 |
Billions of won, consolidated, single quarter. The Q2 2026 line matches the half year report filed on August 14, 2026 and the figures Korean trade press carried on July 24, 2026.
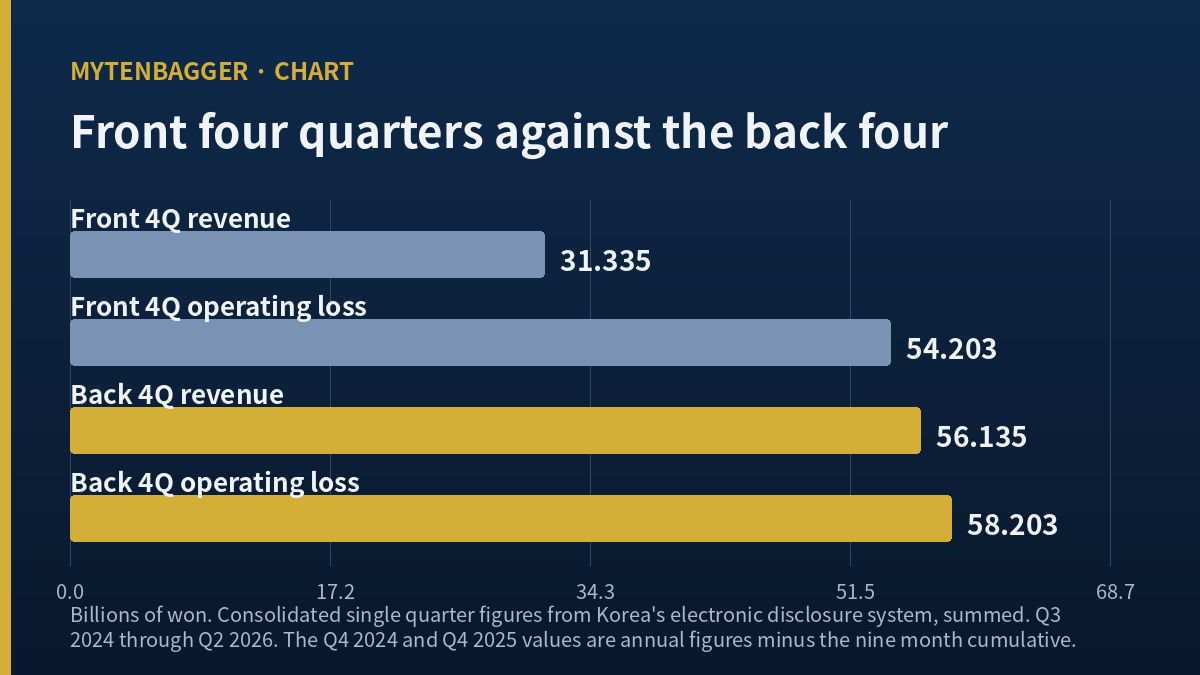
The front four add to 31.335 billion won of revenue and 54.203 billion won of operating loss. The back four add to 56.135 billion won of revenue and 58.203 billion won of operating loss. Dividing 56.135 by 31.335 gives 1.79, so revenue rose 79.14 percent. Dividing 58.203 by 54.203 gives 1.07, so the loss grew 7.38 percent. Revenue rose by 24.80 billion won and the loss rose by 4.00 billion won over the same eight quarters.
I stopped there for a while. When a loss making company grows revenue, the usual picture is fixed cost spreading across a bigger base and the loss narrowing. That is the picture I expected when I built the table. What came out was the opposite shape, and I want to be plain about the fact that the surprise was mine.
Six months that came out level with a full year
The same fact reads differently in annual form. Revenue fell three years running, from 53.038 billion won in 2023 to 46.829 billion in 2024 to 32.978 billion in 2025, and the operating loss widened across the same three years from 19.168 billion to 41.203 billion to 59.473 billion. The 2026 half year broke that pattern on the revenue line and only the revenue line.
| Period | Revenue | Operating result | Net result |
|---|---|---|---|
| 2023 full year | 53.038 | -19.168 | -15.874 |
| 2024 full year | 46.829 | -41.203 | -36.561 |
| 2025 full year | 32.978 | -59.473 | -55.496 |
| 2026 first half | 32.968 | -26.487 | -21.958 |
Billions of won, consolidated. The last row covers six months and the three above it cover twelve, so the rows are not directly comparable. I excluded the 2022 annual row because the operating profit cell on my data screen carries a value the size of revenue, which I read as corrupted.
Doubling the half year is a crude adjustment and I am using it only to set a scale. On that basis revenue runs at 1.999x the 2025 level and the operating loss runs at 0.891x it. The distance between 2.0 and 0.89 is, to me, the entire question in this name. If that distance closes, my reading is wrong. If it holds, I stay outside.
Where The New Revenue Came From
Growth on its own decides nothing, so I tried to separate what was built from what was bought. In July 2025 the company resolved to acquire ONE EXIA, a robot systems integrator based in Pennsylvania, for 35.6 billion won (USD 25.98 million). Korean coverage describes ONE EXIA as a business founded in 1984 that designs, builds and supplies end of line automation, with a specialty in palletizing and box assembly and packing.
Two different ownership percentages are in print
Bloter, a Korean technology outlet, reported on May 21, 2026 that the stake secured through share purchase and a capital increase came to 79.59 percent. A March 13, 2026 report relaying Samsung Securities’ analysis put the resolved acquisition at 89.59 percent, with the remainder to be taken up in stages over three to five years. That is a ten point gap. One figure may be the resolution basis and the other the completed basis, but I could not confirm which. I am printing both and using neither in any calculation here.
How much of the new revenue was acquired
The same Bloter report put first quarter 2026 automation solutions revenue at 6.7 billion won and called it 43.6 percent of the total. I redid that division myself. Dividing 6.7 by the 15.294 billion won consolidated first quarter revenue gives 43.81 percent, which is 0.2 points from the printed figure and looks like rounding. Dealsite, a Korean financial outlet, reported on May 26, 2026 that the North American entity posted 7.9 billion won in the same quarter, up 476.2 percent year on year.
Those two figures rest on different cuts, one by segment and one by entity, so I am not adding them. Either way, close to half of the 15.294 billion won first quarter came from a business the company bought, and buying it cost 35.6 billion won of cash. My original plan was to value the collaborative robot business on its own. That plan did not survive this paragraph.
I ran into a related problem in my note on Rainbow Robotics, another Korean robotics name whose price multiple does not resolve. The method I used there does not transfer cleanly here, because that business was one block and this one had a different business in a different country bolted on within the last twelve months.
Doosan Robotics Stock Next To A Nasdaq Automation Name
For an offshore comparison I used Teradyne, a Nasdaq listed test and automation company, and I picked it on one specific ground. I wanted a listed peer where the size gap on revenue and the size gap on market value come out at clearly different magnitudes, because that difference is itself the observation.
| Measure | Teradyne | Doosan Robotics |
|---|---|---|
| Close, September 1, 2026 | USD 335.46 | USD 50.35 |
| Market value | USD 52.45 billion | USD 3.264 billion |
| Revenue | USD 4.46 billion trailing twelve months | USD 24.06 million for 2025 |
| Trailing earnings multiple | 46.05x | none, the company has no earnings |
Teradyne figures from stockanalysis.com on the September 1, 2026 close. Reconciliation: 335.46 multiplied by 156.34 million shares gives USD 52.446 billion, a drift of 0.008 percent from the printed market value, and 335.46 divided by trailing earnings per share of USD 7.29 gives 46.02 against the printed 46.05.
Teradyne carries 185.3x the revenue and 16.1x the market value. I am not going to claim that ratio is a valuation argument, because the two businesses do different things and I did not verify Teradyne’s segment mix beyond the summary page. What I take from it is narrower. When a Korean growth name is described as small, the smallness on the revenue line and the smallness on the market value line are not the same size, and the second one is where the expectations live.
What Doosan Robotics Stock Costs, And Owning It From Abroad
Doosan Robotics trades on the KOSPI, the senior board of the Korea Exchange, as opposed to the KOSDAQ, where most smaller Korean technology issuers list.
| Item | Value | What I checked |
|---|---|---|
| Close | 69,000 won (USD 50.35) | Tuesday, September 1, 2026. Daily price row and indicator screen agree |
| Market value | 4.4726 trillion won (USD 3.264 billion) | 69,000 multiplied by 64,820,290 shares, no difference against the screen |
| Book value per share | 5,378 won | 2025 year end owners’ equity of 348.594 billion won divided by shares gives 5,377.85 |
| Price to book | 12.83x | 69,000 divided by 5,378 reproduces it |
| Return on equity | -14.8 percent | Loss of 55.496 billion won over average equity of 375.548 billion gives -14.78 percent |
| Seven point screen | 0 of 7 | Revenue scale, operating margin, earnings per share, return on equity, price to earnings, price to book and operating profit all fail |
Kiwoom data on the September 1, 2026 close, with financial items from Korea’s electronic disclosure system. Average equity is the mean of the 2024 and 2025 year end figures.
The 250 day high on my screen was not a closing price
My data screen gives a 250 day high of 170,000 won and labels the basis as closing prices. Pulling the daily rows shows 170,000 as the intraday high of Tuesday, June 2, 2026, while the close that day was 166,700 won. On closing prices, 69,000 is 41.39 percent of the high and the drawdown is 58.61 percent, against the 40.6 percent and 59.4 percent the screen prints, which divide a closing price by an intraday high. This piece uses the closing series only. I did not establish whether the 250 day low of 54,200 won is a close or an intraday print, so I left every low based figure out.
The peak lasted about a week
Closes ran 138,400 won on June 1, 2026, then 166,700 on June 2 with 9,339,442 shares traded, then 157,900 on June 4, 140,300 on June 5, 127,200 on June 8 and 116,600 on June 9. Counting from the session after the June 2 peak, that is four trading days (June 4, 5, 8 and 9) in which 166,700 became 116,600, a fall of 50,100 won or 30.05 percent. Korean coverage on June 5, 2026 framed the fall as expectations fading after Jensen Huang’s visit to Korea. On May 15, 2026 the shares had touched an intraday 52 week high of 138,800 won, up 24.06 percent on the day. No earnings filing landed in that window. What did land was a report that an Nvidia senior director visited the company’s innovation center on April 29, 2026, and that report said plainly that no binding contract or revenue recognition had been confirmed.
The Case Against My Own Reading
My reading is that this company’s operating loss moves independently of its revenue. Here is what argues against it.
First, inside the back four quarters the loss is in fact narrowing, from 16.450 billion won in the fourth quarter of 2025 to 12.070 billion in the first quarter of 2026. Cutting eight quarters in half is my choice, and moving the cut changes the picture.
Second, the first year of consolidating an acquisition normally carries deal related costs into the loss line. I could not isolate that amount, and the company does not publish segment operating results in its quarterly filings.
Third, the second quarter 2026 net loss of 12.792 billion won is smaller than the operating loss of 14.417 billion, so 1.625 billion came in below the operating line. I did not identify the account.
Fourth, inventory turns improved sharply. Inventory stood at 27.181 billion won on 545.8 days of sales in the second quarter of 2025 and at 19.439 billion won on 100.1 days a year later.
Fifth, the balance sheet is not stressed. Equity of 329.231 billion won against liabilities of 112.629 billion gives a debt to equity ratio of 34.21 percent, so losses of this size do not create a funding problem in the near term.
Sixth, peers on the same exchange printed different second quarters. In a survey by Eugene Investment and Securities carried by Asia Economy on August 18, 2026, Robotis reported second quarter revenue of 15.37 billion won and operating profit of 1.98 billion, while Rainbow Robotics reported 12.3 billion won of revenue and a 2.0 billion won operating loss. A smaller Korean robotics name turning a profit cuts against the idea that these losses are simply what the sector looks like. That is a point against my framing and a point for my conclusion at the same time.
Seventh, in the same article Eugene’s analyst Yang Seung Yoon kept an overweight stance on Korean robotics and said attention would separate toward companies proving results through revenue growth, margin improvement and repeat orders. Doosan Robotics was not among the four companies named in that piece. I am not going to use an absence as evidence, since which names appear in an article is an editorial outcome.
Eighth, I reached the opposite conclusion inside the same group not long ago. In my note on Doosan Bobcat I stripped a one off item out of a number that looked good. Here I looked for something to strip out of a number that looks bad and did not find it. That symmetry is either evidence my method does not lean one way, or evidence I gave up too early.
Doosan Robotics Stock Figures I Left Out On Purpose
Anything I could not reproduce from primary figures stays out of the body. Here is what I dropped and why.
| Item | Screen value | Reason for exclusion |
|---|---|---|
| Period returns and moving average gaps | 4.04 percent over one month and others | They are computed off an intraday 67,000 won print from September 2, 2026, not the 69,000 close this piece uses |
| Raw payout ratio | 50.0 | The company has never paid a dividend, so nothing reproduces this |
| Interest coverage | -16.86 | Meaningless against an operating loss, and the interest expense series contradicts itself |
| Enterprise value and EBITDA | both absent | Not supplied. EBITDA is normally absent because Korean filings omit depreciation from the main statements |
| Forward earnings per share and forward multiple | both absent | Not supplied |
Kiwoom data as of September 1, 2026. The interest contradiction is that the 2025 half year cumulative figure reads 3.154 billion won while the same year’s annual figure reads 1.869 billion.
Two share counts also exist. My screen carries 64,820,290 shares while the company’s own governance page gives 64,819,980 as of December 31, 2025. The 310 share gap does not move the market value at the precision I use. Multiplying the company figure by the 500 won par value gives 32.41 billion won, which matches the 32.4 billion won paid in capital on my screen. There has been no bonus issue, split, rights offering or buyback cancellation in the last six months, so the measuring stick under every figure above held still.
Forward numbers exist and none of them close
Dealsite relayed estimates from Mirae Asset Securities analyst Park Sun Young on May 26, 2026 of 59.0 billion won of 2026 revenue and 13.0 billion won of operating profit, with 2027 revenue above 100 billion and a margin in the thirties. Test that against the half year. Reaching 59.0 billion for the year requires 26.032 billion in the second half. Reaching a 13.0 billion operating profit for the year requires the second half to produce 39.487 billion, because the first half was a 26.487 billion loss. That asks second half operating profit to exceed second half revenue by 13.455 billion, which cannot happen. The estimate predates the July 24, 2026 result, so the likely explanation is that it has since been revised. I could not open a revised version.
The scale problem is worse elsewhere. The March 13, 2026 report relaying Samsung Securities put 2026 revenue at around 720 billion won, which is 12.2x the Mirae Asset figure and 21.83x what the company actually earned in 2025. With a half year print of 32.968 billion won on the record, 720 billion cannot describe this company’s consolidated revenue. It probably belongs to a market size or a group aggregate, but I have not seen the underlying document and I will not assert that. The figure appears nowhere in my analysis. A consensus screen at Hankyung Markets, read on September 2, 2026, shows an aggregate buy stance, a 145,000 won valuation and expected earnings per share of 55 won. I am quoting that, not adopting it.
So this is not an uncovered company. It is a covered company whose forward figures I cannot make close. Those are different conditions and I want the distinction on the record. Korean robotics has drawn this kind of expectation before, and I wrote about the way it drains out of a share price in my note on Hyundai Glovis.
Where Doosan Robotics Stock Could Prove Me Wrong
I do not own this and I am not buying it here. Revenue is genuinely growing and I am glad to see it. What I wanted to know was not whether revenue grows but what the loss does while it grows, and cutting eight quarters in half gave me two lines moving the same way. So I have taken revenue growth out of my list of leading indicators for this company’s profit line.
That is not the same as dismissing the business. It holds a front position in Korean collaborative robots, it bought a US integrator and pushed into end of line automation, and a 34.21 percent debt to equity ratio buys it time. I want my entry to sit where that story starts appearing in the income statement. At 69,000 won it sits in the price instead. A screen reading zero of seven says that point has not arrived.
Any one of the following would tell me my reading is wrong. One, the standalone third quarter 2026 operating loss comes in below 9.588 billion won, which is the shallowest of the eight quarters and the floor of the band. Two, standalone third quarter revenue clears 17.674 billion won while the operating loss simultaneously falls below 12.070 billion, which would be the first quarter where the two lines diverge. Three, the company begins publishing segment operating results and the automation solutions segment shows a profit, which would make my statement about a company wide loss moving independently of revenue an artifact of aggregation. Four, a named brokerage’s revised work keeps a 2026 profit path alive and the third quarter lands on it.
The checking date is Monday, November 16, 2026 or shortly after. Korea’s statutory filing deadline for third quarter reports falls on Sunday, November 15, 2026, so the document itself arrives on the following business day or near it.
The questions I am leaving dated
This piece began with one question and it ends with four, each carrying the date on which its answer arrives.
On or after Monday, November 16, 2026. Does the standalone third quarter operating loss land between 9.588 and 16.858 billion won again. If it does, that is a ninth quarter inside the band.
The same day. Does third quarter revenue clear 17.674 billion won while the loss narrows at the same time. That combination would be the first time the two lines part company.
Around mid March 2027. Does the annual report carry segment operating results for the first time. If it does, the spine of this piece has to be rewritten on the ground that I was reading an aggregate.
Whenever it surfaces. Is 79.59 or 89.59 percent the completed ONE EXIA stake. It does not touch the income statement, but it is a gap I failed to close and I would rather leave it visible.
Sources
- EBN, Doosan Robotics second quarter 2026 results, July 24, 2026 (Korean)
- Digital Today, second quarter revenue of 17.674 billion won, July 24, 2026 (Korean)
- Bloter, the ONE EXIA acquisition and the automation solutions segment, May 21, 2026 (Korean)
- Dealsite, Mirae Asset Securities estimates and first quarter detail, May 26, 2026 (Korean)
- Asia Economy, Eugene Investment and Securities survey of Korean robotics, August 18, 2026 (Korean)
- Topstar News, the Nvidia visit and what had not been confirmed, May 15, 2026 (Korean)
- Doosan Robotics governance page, shares issued and par value
- Hankyung Markets, aggregate consensus screen for the company
- stockanalysis.com, Teradyne close and trailing figures, September 1, 2026
- Newsis, the won closed 1.8 higher at 1,370.4, September 1, 2026 (Korean)
- Money Today, the same 1,370.4 close, September 1, 2026 (Korean)