Korean Bakery Samlip Earnings: Why Costs Rose as Revenue Fell
Samlip stock is priced against a quarterly operating cost base of KRW 816.6 billion, or roughly USD 577 million. I had to work that figure out myself. The company does not print it as a single line anywhere, and I only have it because operating cost is what remains when you take operating profit out of revenue. That subtraction is the whole reason I am writing this piece, and the whole reason I am only watching the shares.
Contents
What Samlip stock is actually priced against
Samlip Co., Ltd. trades on the KOSPI under 005610. The KOSPI is Korea’s main board, home to the large industrial and consumer names, and it sits above the KOSDAQ, where smaller and younger companies list. On August 11, 2026 (Tue) the shares closed at KRW 41,200, about USD 29.10, which puts the market value at KRW 355.5 billion or roughly USD 251 million. That is small. It is also less than eleven percent of the company’s annual revenue.
The company reported its first quarter on May 15, 2026 (Fri). Revenue came to KRW 812.3 billion, an operating loss of KRW 4.30 billion and a net loss of KRW 6.82 billion, all on a consolidated basis in the Korean regulatory filing. Against the same quarter a year earlier, revenue was down 0.32 percent. Operating profit went from positive KRW 16.06 billion to negative KRW 4.30 billion, a swing of KRW 20.36 billion.
Divide the profit swing by the revenue decline and you get 7.92. For every won of revenue this company stopped collecting, it stopped keeping almost eight won of profit. Arithmetic like that does not come from the top line. It comes from everything underneath, and the only way I could size that was to derive it.
First quarter, year over year (KRW billion, consolidated)
Published by the company
Revenue 814.85 to 812.28, down 2.57 (down 0.32%)
Operating profit 16.06 to minus 4.30, down 20.36 (down 126.77%)
Derived by me
Operating cost 798.79 to 816.58, up 17.79 (up 2.23%)
Ratio of profit swing to revenue swing: 7.92 to 1
Operating cost is revenue minus operating profit. The company reports it split into two lines, cost of sales and selling and administrative expense, but not by what the money was spent on.
Five quarters of what each KRW 100 of sales left behind
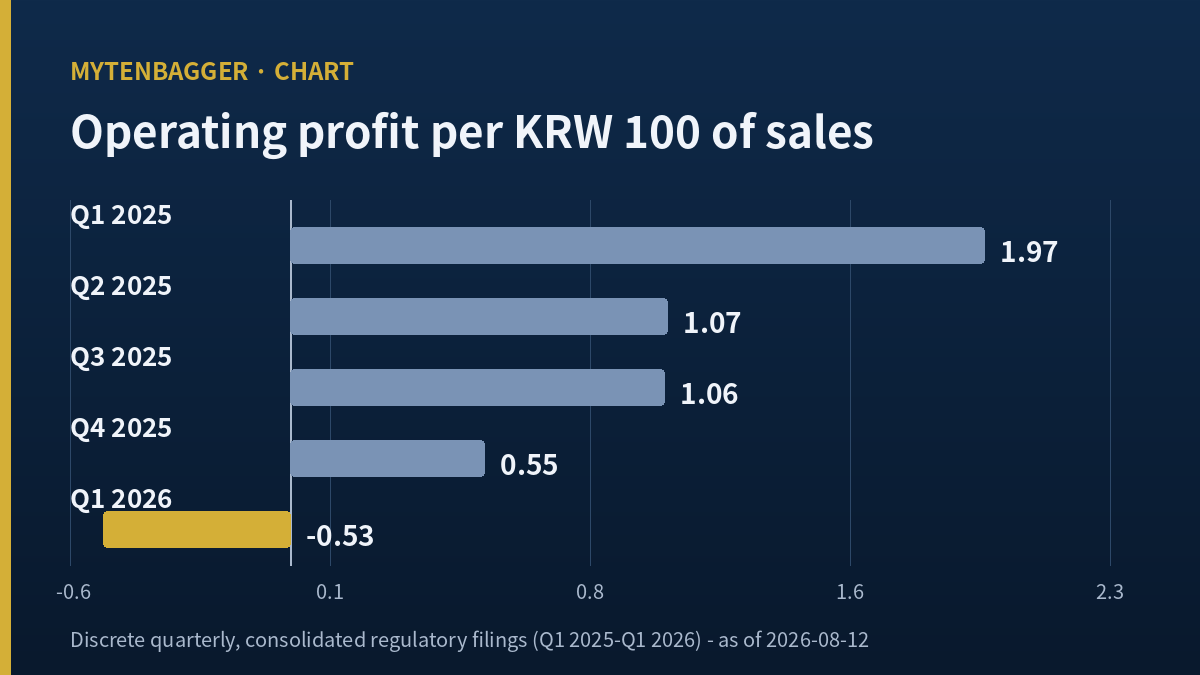
I put the last five discrete quarters on a common base so the revenue swings would stop distracting me. Out of every KRW 100 of sales, operating profit came to KRW 1.97, then KRW 1.07, then KRW 1.06, then KRW 0.55, and then negative KRW 0.53. Those are the first quarter of 2025 through the first quarter of 2026, and the fourth quarter of 2025 is derived by taking nine-month cumulative figures out of the full year.
Quarterly revenue across those five periods ran between KRW 812.3 billion and KRW 869.0 billion. That is a band of about six and a half percent around the top of the range, which for a company selling bread and distributing food ingredients is close to flat. The margin line, over the same five periods, never went up once. Not by a single basis point.
The second and third quarters of 2025 look identical at KRW 1.07 and KRW 1.06, and even that hair of difference points down. Adding the four 2025 discrete operating profit figures gives KRW 38.74 billion, which reconciles to the reported full year to the won, so I am confident the series is clean. Seasonality would show up as one quarter breaking the pattern. Korean bakery demand does shift between summer and winter, and this company also runs food ingredient distribution and highway rest area operations, and none of that turned the direction around even once in five tries.
Samlip stock rests on an operating cost line of KRW 816.6 billion
Here is the constraint. A Korean quarterly report gives me cost of sales and selling and administrative expense as two aggregates. What I want is the cost-by-nature note, the one that breaks the same money into raw materials, employee benefits, depreciation, transport and the rest. Korean issuers attach that note to the half-year report and the annual report. Two filings a year carry it, and the other two do not.
So August 14, 2026 (Fri) is the date this piece is written against. It is the statutory deadline for the half-year report, and what arrives that day is not only second-quarter revenue and profit but the cost-by-nature note on a six-month cumulative basis. I want three rows from it: raw materials, employee benefits, depreciation. If the year-over-year increase in those three roughly accounts for the KRW 17.79 billion, then this is an input cost problem, and input cost problems can be pushed back through price. If those three do not account for it, I have been looking in the wrong place for five quarters.
One vendor field did survive my checks this time. Earnings before depreciation and amortization for the first quarter came to KRW 18.63 billion, which is genuinely different from the KRW 4.30 billion operating loss, and for the 2025 full year it reads KRW 131.69 billion against operating profit of KRW 38.74 billion, a gap of KRW 92.95 billion. In several recent write-ups I have had to throw that field away because the vendor had simply copied operating profit into it. Here it is real. It still only tells me the size of depreciation, though, and not which assets carry it, so I used it to sanity-check scale and kept it out of the argument.
Four years in which only profit moved
Widening out to annual figures produces the same picture. Consolidated revenue from 2022 through 2025 reads KRW 3,314.5 billion, KRW 3,433.3 billion, KRW 3,427.9 billion and KRW 3,370.5 billion. Highest to lowest is a spread of KRW 118.8 billion, or 3.46 percent of the top. Total assets sat between KRW 1,240.8 billion and KRW 1,295.4 billion, a spread of 4.22 percent.
Operating profit over those same four years reads KRW 89.51 billion, KRW 91.73 billion, KRW 94.97 billion and KRW 38.74 billion. Spread of KRW 56.23 billion, which is 59.21 percent of the top. Net profit reads KRW 53.24 billion, KRW 50.23 billion, KRW 86.49 billion and KRW 14.04 billion, a spread of 83.77 percent. Revenue and assets held inside four percent while earnings moved across sixty and eighty. The company has been the same size for four years and the only thing that changed is how much of that size it keeps.
Return on equity fell from 18.03% to 2.91%
Net profit of KRW 86.49 billion over year-end equity of KRW 479.83 billion gives 18.03 percent for 2024. For 2025, KRW 14.04 billion over KRW 481.55 billion gives 2.91 percent. The Korean broker screen I use shows 2.9 percent, which reproduces the consolidated calculation exactly, so I know this particular field is measured against total equity and not against a parent-only figure. Equity itself grew by KRW 1.73 billion between the two dates. The entire collapse sits in the numerator side of that fraction.
I also want to flag that the 2024 figure is a poor comparison point. Net profit of KRW 86.49 billion that year exceeded what I would expect from operating profit of KRW 94.97 billion after tax and interest, and inside it sits a single second-quarter net profit of KRW 46.98 billion against operating profit of KRW 27.00 billion in the same three months. I did not establish what happened below the operating line, so I do not treat 18.03 percent as this company’s normal state. The comparison points I use in this piece are 13.68 percent in 2022 and 11.99 percent in 2023.
Samlip stock and two dates in 2026
February 3, 2026 (Tue): fire at the Sihwa plant
A fire broke out at the company’s Sihwa plant in Siheung on the afternoon of February 3, 2026 (Tue). Nobody died. Three people were treated for smoke inhalation and 554 were evacuated. The company halted the entire plant that day and said on February 4, 2026 (Wed) that it had switched to backup production capacity. Investigators concluded on April 8, 2026 (Wed) that they could not establish a definite cause.
No figure has been published for what the fire cost. Management grouped raw material prices, exchange rates, the fire, and the expense of reorganizing shift patterns into one explanation without sizing any of them. A fire is a one-off, which means it drops out of the next comparison, but I cannot forecast the size of that improvement without knowing the size of the item. This is another thing I am waiting on the half-year note to settle.
August 17, 2026 (Mon): wholesale prices go up
There is a date closer than the half-year report. The company said it is raising prices on around fifty bread products by an average of nine percent, with wholesale prices to distributors moving on August 17, 2026 (Mon) and convenience store shelf prices on September 1, 2026 (Tue). One flagship product goes from KRW 1,800 to KRW 2,000, an increase of 11.1 percent, and a chocolate sandwich line goes from KRW 2,200 to KRW 2,400, or 9.1 percent. The previous increase was in February 2025.
Pricing is the direct counter to everything I have written. If the margin decline is an input cost story, then nine percent of price recovers it. I am not treating the two as equal in size, though. The increase covers around fifty products while consolidated revenue also contains food ingredient distribution and the rest area business, so how much of nine percent survives into group gross margin is a question a quarter has to answer. Third-quarter results in November 2026 will be the first period carrying a full quarter of the new prices.
How Samlip stock did against KOSPI and the food sector
Across the 244 trading days from August 11, 2025 to August 11, 2026 (Tue), the shares fell 25.23 percent. The KOSPI rose 97.88 percent over the identical window, and an equal-weighted Korean food sector index fell 10.02 percent. That is 123.11 percentage points behind the market and 15.20 points behind the sector. Splitting the shortfall, the sector accounts for 107.90 points and the stock itself for 15.20, so roughly 88 percent of the underperformance is sector weather. Within 77 food names the stock ranked 60th and beat 17 of them. Sector median was down 12.0 percent.
The only piece of that I use is the 15.20 points of stock-specific shortfall. A Korean market up 97.88 percent in twelve months is an unusual window, and a whole sector lagging it tells me about the sector. Lagging the sector median by more than thirteen points tells me about the company. I make no causal claim. I note only that the direction agrees with five quarters of falling margin.
On closing prices the peak was KRW 56,100 on September 17, 2025 and the low was KRW 35,750 on June 24, 2026 (Wed). The shares are 26.56 percent below that peak and 15.24 percent above that low, with a maximum drawdown of 36.27 percent. Beta against the index measures 0.117 and correlation 0.256, which is close to no relationship at all.
A bakery that splits the same pressure into four lines
As a counterpart I looked at Flowers Foods (NYSE: FLO), the American packaged bakery group. It is under the same kind of pressure. In first-quarter results released on May 21, 2026 (Thu), net sales came to USD 1.572 billion, up 1.1 percent, and the company itself broke that number apart: price and mix contributed 2.1 points, volume subtracted 3.3 points, and the Simple Mills acquisition added 2.3 points. Reported income from operations was USD 79.8 million, an operating margin of 5.08 percent, and net income was USD 42.1 million, down 20.6 percent.
I did not pick this company because its results are better. I picked it because it is absorbing the same squeeze and it publishes the squeeze in four numbered pieces every quarter. “Volume fell 3.3 percent and price recovered 2.1 of it” is exactly the sentence I want to write about Samlip and cannot. Samlip gives me one revenue total and one profit total. The gap in disclosure resolution weighed on my decision more than the gap in margin did.
Three limits on this comparison
First, the periods are different lengths. The Flowers Foods first quarter closed on April 25, 2026 (Sat) and ran sixteen weeks, while the Korean quarter ran thirteen. Second, the American company’s revenue growth includes 2.3 points of acquisition, so its underlying business shrank too. Third, I read the company’s own release and coverage of it, and I did not open the quarterly filing itself. Because of those three, I compared operating margins and disclosure formats and left valuation multiples alone entirely. The next set of results from that company is due August 20, 2026 (Thu).
How thin the forward view on Samlip stock is
I should be plain about this. I did not read a single broker note on this company while writing. The forward earnings, forward multiple and peer multiple fields in the data service I use were all empty. What I have is one line on a Korean financial portal, dated August 10, 2026 (Mon): a buy consensus, a valuation of KRW 83,375, and an estimated earnings per share of KRW 5,166. No broker name and no report date appeared on that screen.
Multiplying KRW 5,166 by the 8,628,713 shares outstanding implies annual net profit of KRW 44.57 billion, which is a large number for a company that just lost KRW 6.82 billion in a quarter, and the screen did not say which fiscal year it refers to. At the August 11, 2026 (Tue) close of KRW 41,200, that estimate works out to 7.98 times. The same close against 2025 actual earnings per share of KRW 1,626.55, which is consolidated net profit divided by shares, works out to 25.33 times. One multiple, and it sits somewhere between eight and twenty-five depending on which earnings figure goes underneath.
So I am not using either. The forward view on this name, for me today, is one anonymous line on a screen. If that line is right, the valuation paragraph in this piece is worthless. That is why multiples are absent from my argument and appear instead as the fifth item in the counterpoints below. The one named estimate that turned up in searching was a KRW 71,000 valuation published by a Korean broker in February 2025, which is eighteen months stale, and I left it out.
Nine ways I could be wrong about Samlip stock
One. Flat revenue is normal here. Bread and food ingredient distribution are low-growth by nature and a 3.46 percent four-year band reads as stability to plenty of investors. Two. Nine percent of price arrives on August 17, 2026 (Mon), and if it survives intact the five-quarter decline ends in a single period. Three. The first-quarter loss contains a fire, and I folded a one-off into a trend without knowing its weight.
Four. My KRW 17.79 billion cost increase is a derived figure. I did not verify it against cost of sales and selling expense separately in the filing itself. Five. If the consensus estimate of KRW 5,166 holds, this trades on eight times and my read of 25.33 times evaporates. Six. The fourth quarter of 2025 is a residual, calculated by removing nine-month cumulative figures from the full year, so rounding moves it slightly away from whatever the company would report as a discrete quarter.
Seven. Leverage improved throughout the decline. The debt-to-equity ratio fell from 232.91 percent in 2022 to 152.27 percent by the first quarter of 2026, so the balance sheet strengthened while the income statement weakened. Eight. Cash held up better than earnings did. Operating cash flow in 2025 was KRW 88.24 billion and free cash flow KRW 47.11 billion, both positive. Nine. I have never seen segment profit for this company. Bakery, food ingredient distribution and rest areas are all inside one consolidated total and I do not know which of them broke.
Three things that sit beside the numbers
Foreign ownership sits at 2.14 percent, which is among the lowest I have come across in this sector, and that number is itself a signal about how much outside attention this name gets.
The company changed its name and English data has not caught up
The second thing is an obstacle that has nothing to do with the financials. At the shareholder meeting on March 26, 2026 (Thu) this company amended its articles and changed its corporate name from SPC Samlip to Samlip. The parent group had launched a new holding company on January 13, 2026 (Tue) and was tidying up subsidiary naming. Five months on, some English-language data providers list the company under the old name and some under the new one, and search results split between the two. If you look this up by name instead of by the 005610 code, you can easily end up thinking there are two companies. I hit that myself while assembling the peer comparison, and it cost me twenty minutes.
Numbers I left out
The dividend per share for 2025 was KRW 1,000, the first cut in an eight-year run that had climbed from KRW 1,004 in 2018 to KRW 1,800 in 2024. Total payout came to KRW 8.63 billion, which is 61.48 percent of net profit, against 17.96 percent the year before. I noted it and moved on, because I covered a payout ratio inverting like that in another Korean food name very recently and I do not want two pieces resting on the same observation.
Book value per share on the vendor screen reads KRW 61,651, and the 0.66 price-to-book comes from it. Multiply KRW 61,651 by the share count and you get KRW 531.97 billion, which exceeds consolidated equity of KRW 481.55 billion at the end of 2025 by KRW 50.42 billion. Equity attributable to owners cannot be larger than total equity, so that per-share figure is measured against some other statement. I could not establish which, so I dropped the price-to-book ratio from the piece instead of quoting a number whose divisor I cannot name. Three-year revenue growth and the payout ratio field were both discarded for similar reasons, and a total equity field reading KRW 448.2 billion matched neither the 2025 year-end nor the first-quarter balance sheet.
What I would read first on August 14, 2026
If I ever change my read on this, the trigger will be a cost figure and not a profit figure. Quarterly operating cost has to come back below KRW 800 billion from the KRW 816.6 billion it reached, with KRW 798.8 billion from the first quarter of 2025 as the marker. Revenue can do whatever it likes. It has stayed inside a three percent band for four years and will probably keep doing so, which makes the other side of the subtraction the only side worth watching.
And when that line does come down, the reason has to be legible in a note. Prices rise on August 17, 2026 (Mon) and the fire drops out of the comparison, so the reported numbers may well improve on their own. An improvement I cannot trace to a cause is one I cannot carry into the next quarter. That is the actual reason I am watching. The result being poor was never the obstacle; being unable to see what the result was made of was.
The way I get proved wrong is specific. If the half-year cost-by-nature note shows raw materials, employee benefits and depreciation rising by less than half of KRW 17.79 billion between the two periods, then this was never an input cost story and I was watching the wrong line. In that case the pricing counterargument collapses along with my thesis, and I take the name off the watchlist entirely instead of reframing it.
Three earlier pieces circle the same problem from different angles. Nongshim splits overseas revenue across seven countries and publishes no profit by geography, which left me unable to verify the bull case. Cosmax showed a strong return on equity that decomposed into leverage once I pulled the pieces apart myself. Kangwon Land reported operating profit and net profit moving in opposite directions in the same quarter. In all three the obstacle was resolution and not performance, and this is the fourth.
Everything above is written against a hole in what this company publishes and when, and that hole closes on August 14, 2026 (Fri). I am putting the expiry date in the last line so that nobody, myself included, mistakes this for a view about bread.
Prices and multiples reflect the August 11, 2026 (Tue) close as checked at the time of writing. Financial figures come from Korean consolidated regulatory filings. Korean won is the reference currency throughout, and dollar figures are approximate conversions at roughly KRW 1,416 per dollar, the Seoul market close on the same date. This is a personal trading journal and every call in it is my own.
Sources: Dealsite, first quarter results, May 15, 2026 · Newspim, price increase, August 10, 2026 · Ezyeconomy, corporate name change, February 26, 2026 · Daum News, plant shutdown, February 4, 2026 · The Value News, holding company launch, March 10, 2026 · Hankyung consensus screen · Newsis, Seoul foreign exchange close, August 11, 2026 · Flowers Foods second quarter reporting date notice