Dongwon Systems Earnings: Second on Sales, Last on Profit
- Four of the five fiscal years I lined up put revenue and operating profit within two places of each other.
- One year broke that, and it is the most recent full year. Dongwon Systems stock now carries a KRW 617.5 billion market value against a 2025 that ranked second on sales and fifth of five on operating profit.
- Neither the recovery in the first half of 2026 nor the goals the company published for itself has closed that gap for me yet. I own none of this and I am watching.
I did something simple with Dongwon Systems stock before I read a single word of commentary. I took five fiscal years of revenue, sorted them largest to smallest, and wrote down where each year landed. Then I took the same five years of operating profit and sorted those separately. Two short lists, no adjustments, no averages.
On the revenue list, 2025 came in second. On the operating profit list, the same year came in fifth of five. That is a three place gap, and no other year in the window moves that far between the two lists.

Contents
What Dongwon Systems stock is attached to
The company makes packaging. Aluminum cans, flexible film, cartons, and the materials that go into them. It trades on the KOSPI, which is Korea’s main board and the rough local equivalent of the S&P 500 in the role it plays for domestic investors. Its market value on the September 18, 2026 close was KRW 617.5 billion, or roughly USD 446.4 million at about KRW 1,383.3 per dollar on that same date.
Two pieces of local context are worth attaching for readers outside Korea. First, this is a subsidiary inside one of the country’s mid sized business groups, and the group’s seafood and food arm is separately listed on the same exchange. Korean groups routinely list affiliates alongside the parent, which means an investor looking at the group can end up holding overlapping exposure without meaning to. Second, Korean packaging demand is tied closely to domestic food and beverage volumes, and the export growth the company has been describing is an attempt to loosen that tie.
That is a small company by any global measure, and I want to be plain that I hold none of it. What follows is a reading, and the reading starts with two sorted lists, then a third one I added as a check.
Five fiscal years, sorted twice
| Fiscal year | Revenue (KRW bn) | Rank | Operating profit (KRW bn) | Rank |
|---|---|---|---|---|
| 2021 | 1,250.88 | 5 | 90.00 | 3 |
| 2022 | 1,437.00 | 1 | 91.84 | 2 |
| 2023 | 1,276.65 | 4 | 80.85 | 4 |
| 2024 | 1,334.26 | 3 | 91.90 | 1 |
| 2025 | 1,372.87 | 2 | 66.16 | 5 |
Source: annual figures as published by the Hankyung corporate financial page, converted from millions of won to billions. The two rank columns are mine; I sorted each list and wrote the position down.
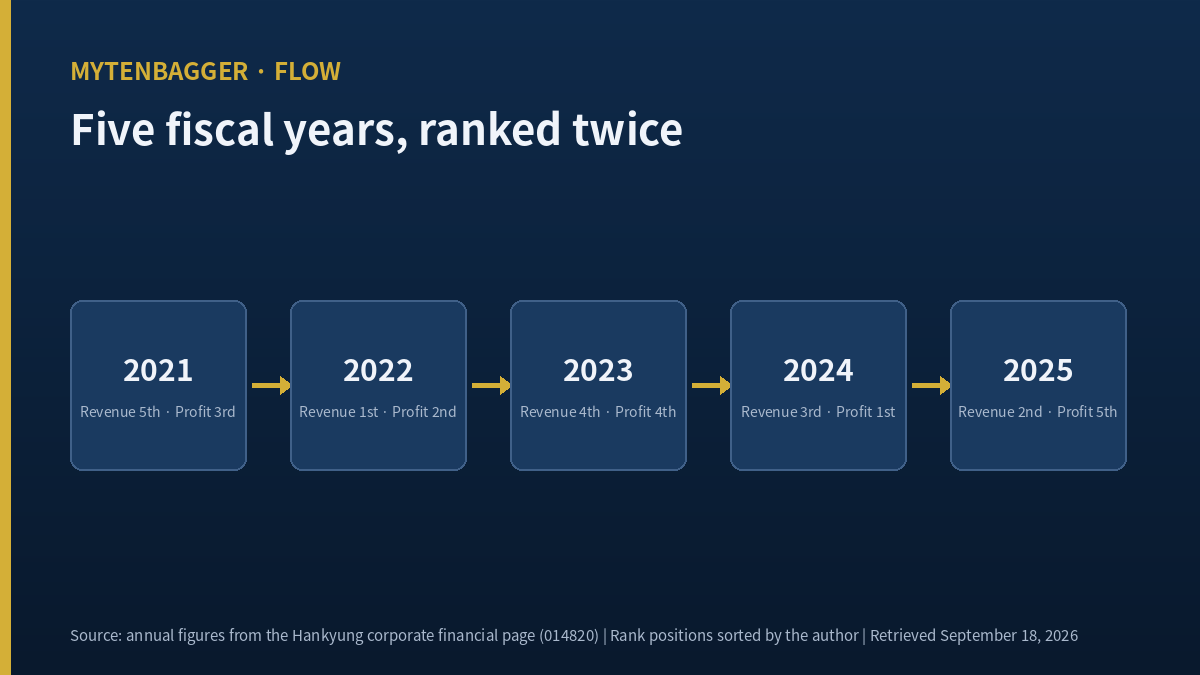
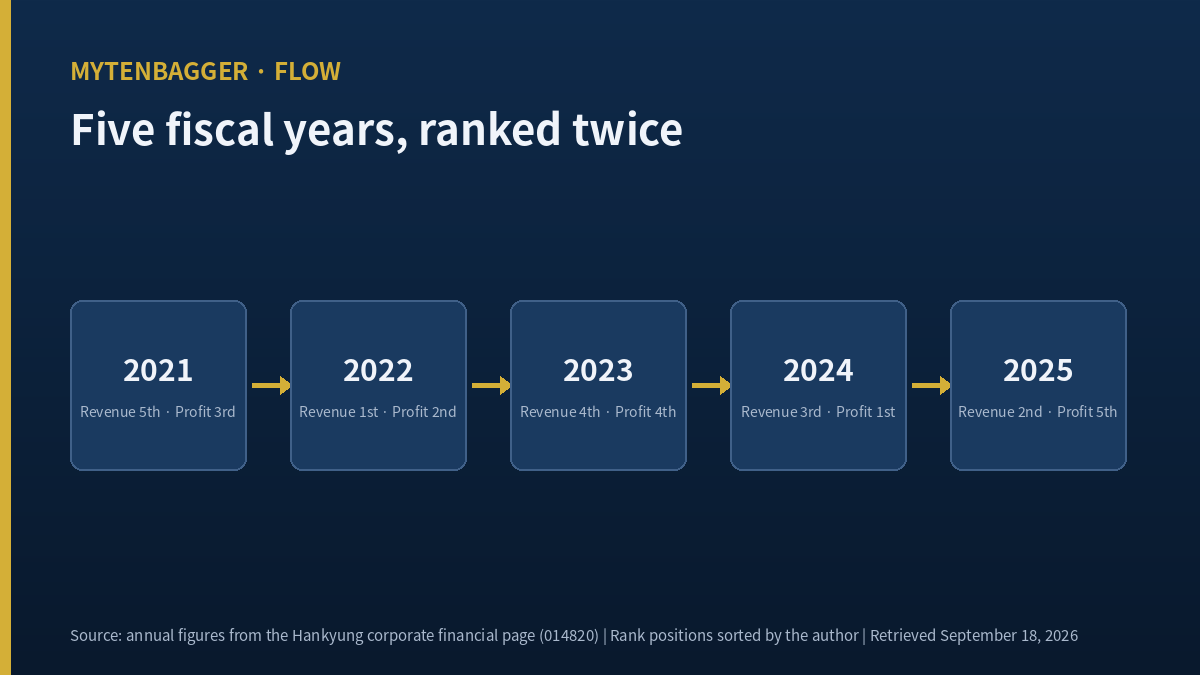
Four of the five years behave the way I expect a packaging business to behave. In 2023 both lines sat fourth. In 2022 revenue was first and profit second. In 2021 revenue was fifth and profit third, and in 2024 revenue was third and profit first. Those are separations of zero, one and two places, which is noise at this sample size.
Then 2025. Revenue second, profit fifth. Three places, and the only year in the window where the two lists disagree that widely.
A third list, and it disagrees with the second
Two lists can be a coincidence, so I built a third one from net profit and sorted it the same way. Net profit for the five years runs KRW 39.87 billion in 2021, KRW 72.34 billion in 2022, KRW 64.20 billion in 2023, KRW 72.41 billion in 2024, and KRW 53.67 billion in 2025, again converted from the published millions.
Sorted, that puts 2024 first by a margin of about 77 million won over 2022 in second, then 2023 third, 2025 fourth, and 2021 fifth. Note what happened to the year I am interested in: on the operating profit list 2025 finished last, and on the net profit list it finished fourth, one place higher, with 2021 below it.
That single place tells me something useful. Whatever pulled the operating line down in 2025 did not carry all the way through to the bottom line with the same force, which points at items below the operating result, financing, other income, or tax, doing some of the work. I cannot say which, because the aggregated annual view I am using does not break those out and I did not open the audited notes. What I can say is that my headline framing, revenue second and profit last, is true of one profit line and not of the other, and a reader deserves to know which one I chose before I start drawing conclusions from it.
For the record, the choice was deliberate. Operating profit is the line that reflects what the packaging business itself earned on what it sold, and that is the question I came with. Net profit answers a different and broader question about the whole corporate structure.
One more thing I checked before moving on, because sorted lists are easy to break. Annual figures only carry signal if the years are comparable, so I looked for anything that would have changed the share count or the consolidation boundary across the window. The recent disclosure record shows an interim dividend decision and the preliminary results release, and nothing in the way of a rights issue, a bonus issue, a split, or a buyback cancellation. Paid in capital sits unchanged across the four balance sheet dates I pulled. That does not prove the five years are perfectly comparable, since an acquisition or disposal inside the consolidation would not show up in any of those places, but it removes the most common reason a five year series quietly stops meaning what it appears to mean. When I read SKC earlier this year the whole point was that a single financing had changed which numbers were worth lining up at all, so this is a check I now run before I sort anything.
I also want to name the thing the lists cannot see at all. Sorting tells me the order of five outcomes. It says nothing about why any of them landed where it did, nothing about the quality of the demand behind the revenue, and nothing about whether the company was pricing to defend volume in the year the margin fell. Those are the questions a buyer of this business would ask first, and rank order answers none of them.
The margin line says the same thing without the ranks
Ranks compress information, so I checked the underlying percentage as well. Operating profit measured against revenue came to 7.1947 percent in 2021, 6.3911 percent in 2022, 6.3331 percent in 2023, and 6.8881 percent in 2024. All four sit in a band roughly eight tenths of a percentage point wide.
The 2025 figure is 4.8188 percent. It is the only one of the five below six percent, and the distance from the nearest of the other four is about 1.51 percentage points, which is nearly twice the width of the band that holds the rest.
Put differently, the four ordinary years occupy a band 0.8616 percentage points wide, from 6.3331 percent at the bottom to 7.1947 percent at the top. The distance from the bottom of that band down to the 2025 figure is 1.5143 percentage points, which is about 1.76 times the width of the band itself. An outlier that sits further from the group than the group spreads is the kind of observation I want to be able to point at a document to explain, and I cannot yet.
The revenue line has no comparable outlier. Across the same five years revenue ranges from KRW 1,250.88 billion to KRW 1,437.00 billion, a spread of KRW 186.12 billion, and the largest year is 1.1488 times the smallest. On the operating line the largest year is 1.3892 times the smallest. Both of those are my divisions on the published annual figures. The top line moves in a narrow corridor; the profit line does not.
I ran the year over year change on both lines as well. From 2024 to 2025 revenue rose 2.8943 percent while operating profit fell 28.0170 percent. Those are my divisions on the published annual figures. In no other step of the window do the two move in opposite directions.
When I looked at Moorim Paper earlier this month, the interesting line was the one that moved when spending changed. Here the interesting line is the one that moved while the line above it barely did.
The first half of 2026 puts the two lines back together
The company disclosed preliminary first half results on July 31, 2026. Revenue of KRW 740.0 billion, up 5.2 percent from the year before, and operating profit of KRW 44.4 billion, up 15.5 percent. The second quarter alone carried revenue of KRW 402.2 billion, up 9.8 percent, and operating profit of KRW 31.4 billion, up 21.1 percent, as reported by Herald Business and by In The News, both Korean outlets covering the same filing.
Two things in that paragraph matter to me. First, the two lines are pointing the same way again, and profit is moving faster than revenue, which is the opposite of what 2025 did. Second, the half year operating margin works out to exactly 6.0000 percent by my division, which puts it back at the floor of the band the four earlier years occupied. Recovery to the bottom edge of normal is still recovery, and I want to be careful not to call it more than that.
The rule I am applying here came out of reading Hansol Paper a few weeks ago: when two published lines about the same company point different ways, sort both and find out which years actually carry the disagreement, before reaching for a cause. It held there and it is holding here on a different pair of lines.
Management credited the improvement to export growth in eco friendly packaging materials and to a Vietnamese affiliate, both described in the Korean coverage as up roughly twenty percent. I have not seen the segment disclosure behind those descriptions, so I am carrying them as company framing and not as figures I checked myself.
A pair of arrows is not an explanation
Here is where I caught myself. My first draft of the section above carried the phrase “margin compression” as though naming it settled something. It settles nothing. A pair of arrows pointing opposite ways tells me that revenue and profit came apart in one fiscal year; it does not tell me whether input costs rose, whether the mix moved toward lower margin work, whether a one off charge landed, or whether capacity sat idle. I opened the annual figures and the half year press coverage. Neither of those documents splits the cost side for me, and I did not open the audited notes.
So the correction I am writing down for myself is this. When two published lines diverge and I reach for a two word name for the divergence, I should stop and check whether I can point to the document that would confirm the name. If I cannot, I record the divergence and leave the cause open. That is what I have done here.
What the company itself wrote down about Dongwon Systems stock
In April 2025 the company published a corporate value enhancement plan, the Korean market’s version of a shareholder return roadmap. A year later it published a progress note on that plan, covered by Digital Today on April 28, 2026. The payout goal was met. Return on equity and price to book both finished the year below where they started, against goals that pointed the other way.
I am deliberately keeping that passage short, because the balance sheet arithmetic behind it belongs to a different reading and I do not want to fold two arguments into one piece. What it adds here is a second independent signal, published by the company itself, that 2025 was the year the profit line behaved differently from the revenue line above it.
The comparison I did want to run, and could not, is a peer margin table. Sonoco Products Company, listed on the NYSE under SON, makes the same category of goods and sits in the market under the sector label Consumer Discretionary and the industry label Packaging and Containers. Korea files this company under a materials style heading instead. I am taking those two labels and nothing else from that page, no figures at all, because until I know the two companies draw their revenue boundaries the same way, any percentage I set beside theirs would do the arguing for me.
Where Dongwon Systems stock goes from here, as I see it
The four paths and what I put on each
These weightings are mine and they carry no mathematical claim. They are a way of writing down how much room I give each story.
Forty seven percent. The 2025 split was a one year event driven by costs that have since eased, the first half margin of 6.0000 percent holds through the second half, and the full year lands back inside the band the four earlier years occupied. The rank lists stop disagreeing.
Thirty one percent. The first half improvement is real but partly seasonal or mix driven, the second half gives some of it back, and the full year margin lands between the 2025 low and the old band. The lists half agree, which tells me almost nothing.
Fourteen percent. Costs re-tighten, the second half undoes the first, and the 2026 profit line finishes near or below 2025. That would make the split structural and the whole framing of this piece too kind.
Eight percent. Something outside the margin story moves first, a large disposal, a capital action, an acquisition, and the five year lists become the wrong comparison altogether. In that case the work above is not wrong so much as pointed at the previous version of the company.
Where this reading of Dongwon Systems stock could be wrong
Twenty one ways in
- Five observations is a small window, and rank position is a coarse measure on a small window.
- Ranking hides magnitude. The top two operating profit years are separated by less than one billion won, so their order is close to arbitrary.
- A three place gap in a five item list sounds larger than the underlying change may be.
- I used consolidated annual figures as published by one aggregator and did not open the audited statements behind them.
- Figures converted from millions to billions of won carry rounding I did not control.
- Fiscal 2021 revenue is the lowest of the five, so the whole window may sit on a recovering base and not on a flat one.
- Packaging demand tracks food and beverage volumes, which I did not measure at all.
- Aluminum and resin input costs are the obvious candidate for the 2025 split, and I checked neither.
- A single non recurring charge inside operating profit would explain 2025 without any of my framing.
- The Vietnamese affiliate introduces currency effects I did not separate.
- Export growth described as roughly twenty percent came from company framing carried in the press; no segment table of mine backs it.
- Preliminary disclosures get revised, and I am leaning on preliminary first half figures.
- Half year figures include seasonality that a full year comparison would smooth out.
- Reaching exactly 6.0000 percent on the half year margin is a coincidence of rounding in the published inputs, and I should not read meaning into the roundness.
- I have no named brokerage estimate for 2026 or 2027, so this reading is untested against the sell side view.
- One article did carry a valuation figure, but the same article stated first half revenue off by two orders of magnitude, so I left out both the figure and the house that supposedly gave it. That decision could be too strict.
- The value enhancement plan progress note is a company document about company goals, and I treated it as corroboration.
- Return on equity and price to book falling could reflect the market and the equity base more than the operating line.
- The peer comparison I declined to build might have been informative even in rough form.
- I wrote this without speaking to anyone who buys packaging for a living.
- If the second half of 2026 lands strongly, the interesting year becomes 2026 and 2025 becomes the outlier I over read.
Five conditions that break my reading
- Third quarter operating margin comes in below five percent, which would put 2026 back alongside 2025 and make the split structural.
- The third quarter filing shows a non recurring item large enough to account for most of the 2025 shortfall, which would retire my framing entirely.
- Full year 2026 revenue falls while operating profit rises, the mirror image of 2025, which would mean the two lists disagree in both directions and rank position carries no signal here.
- Segment disclosure shows the packaging operation flat and the improvement sitting in an affiliate, which would move the story outside the business I thought I was reading.
- The company restates any of the five annual figures, in which case both of my sorted lists have to be rebuilt before anything above means anything.
The first two of those are answered by the same document, the third quarter report, whose statutory filing deadline is November 16, 2026. The third needs the full year. The fourth needs a disclosure the company has not been giving at that grain. The fifth would arrive without warning, which is the only reason I put it on the list at all.
A word on method, because the method is most of what this piece is. I did not model anything. I took published annual figures from a single aggregated source, converted the units, sorted them twice, and then sorted a third line as a check on the first two. Every rank in this piece is a position I wrote down by hand after sorting, and every percentage is a division I ran on those same published figures. The value of that approach is that a reader can redo all of it in a spreadsheet in about ten minutes and find out whether I made an error. The cost is that it sees only what the aggregated view shows, which is why the cost side of the 2025 question stays open above.
So where I stand is short. I hold none of this and I placed no order. The company is small enough that my default at this size is to watch, and nothing in the two sorted lists argued me out of that default. What the lists did do is tell me exactly which filing settles the question, and roughly when it arrives.
The sentence in this piece I rewrote most often is the one that opens the margin section. My early versions all tried to say what caused the 2025 split, and every version failed the same test: I could not name the document that would prove it. What survived says only what the published lines do. I would rather publish a smaller claim I can stand behind than a larger one I would quietly walk back in November.
Prices and the market value above reflect the September 18, 2026 close. Dollar figures are approximate, converted at roughly KRW 1,383.3 per dollar on that same date. Percentages and rank positions are my own calculations on the published annual figures.
Related reading
- Korea’s TS Corporation Earnings After Five Flat Years of Revenue
- Sun Kwang Earnings: Net Profit Rose 2.7x on 11% More Sales