Cosmax Stock: Ranking Three ODM Makers by Debt Instead of Margin
Sort three cosmetics ODM makers by net profit margin. Then sort the same three by return on equity. The two orders do not match, and that mismatch is the whole reason I spent an evening on Cosmax stock instead of moving to the next name on my list.
The two orderings
| Ranked by net margin | Ranked by ROE | Ranked by debt load |
|---|---|---|
| 1. Kolmar Korea | 1. Cosmax | 1. Cosmax |
| 2. Cosmax | 2. Kolmar Korea | 2. Kolmar Korea |
| 3. Intercos | 3. Intercos | 3. Intercos |
Column two and column three are the same order. Column one is not.
Contents
Cosmax stock and the two numbers that did not agree
Cosmax (KOSPI: 192820) closed at 205,500 won, roughly 145 US dollars, on Friday, August 7, 2026. The screen next to that price showed a return on equity of 23.9 percent. For a contract manufacturer of cosmetics, that reads like a business compounding capital at a very good clip. The same screen showed a net profit margin of 5.47 percent.
Those two figures sit uneasily together. A company keeping five and a half cents of every sales dollar does not usually earn twenty-four cents on every dollar of book equity. When it does, the extra is coming from somewhere other than pricing power.
I had the comparison already open because of the piece I published on Friday, August 7, 2026 about Kolmar Korea, the other large Korean cosmetics ODM. Kolmar Korea runs a 6.18 percent net margin and a 14.7 percent ROE. Cosmax runs a thinner margin and a much higher ROE. The company keeping less of each sale was posting the better return on book equity, and I wanted to know why before I formed any view on Cosmax stock.
The tool for this is old and unglamorous. Return on equity factors into three pieces: net margin, asset turnover, and financial leverage. Two of the three were already on my screen. Net margin is 5.47 percent. Financial leverage is one plus the debt-to-equity ratio of 289.6 percent, which gives 3.90 times. The third piece, asset turnover, I recovered from what was left over.
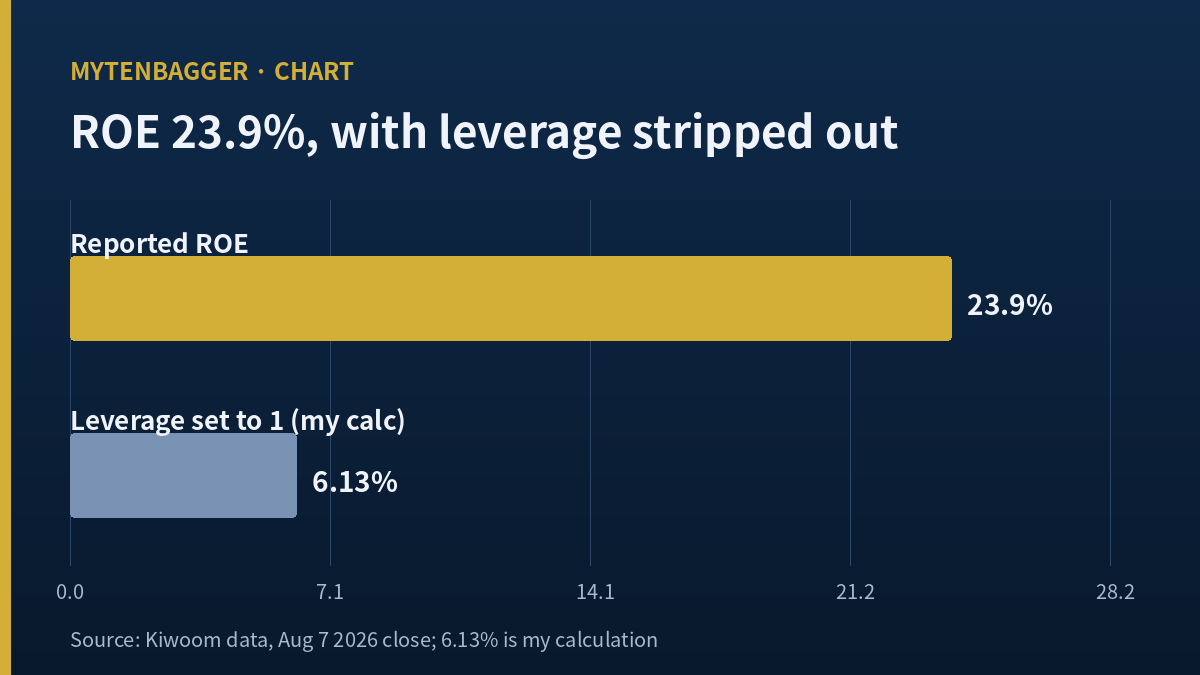
Breaking the 23.9 percent apart leaves 6.13 percent
Divide 23.9 by 5.47 and you get 4.37. That factor is everything stacked on top of the margin. Of it, 3.90 is financial leverage and 1.12 is asset turnover (my calculation). Set leverage to one, which is the same as imagining a Cosmax with no borrowings at all, and the product collapses to 6.13 percent.
That 6.13 percent is the figure I was after. It is what the operating business earns on the capital its owners actually put in, before borrowing multiplies the result. Cosmax turned 2.399 trillion won (about 1.69 billion dollars) of fiscal 2025 revenue into 195.8 billion won of operating profit and 131.1 billion won of net profit. On its own equity base, that work compounds at roughly six percent. The distance between six and twenty-four is debt.
Before leaning on a decomposition I like to check that it closes. Dividing revenue by the recovered turnover figure of 1.12 gives total assets of about 2.137 trillion won; dividing that by leverage of 3.90 gives equity of about 548.5 billion won. Book value per share of 49,206 won multiplied by 11,349,392 shares outstanding gives 558.5 billion won. The two paths land 1.78 percent apart. Market value of 2.332 trillion won divided by that equity gives 4.18, which is the price-to-book figure the vendor already publishes. Five vendor fields, one consistent basis.
Cosmax stock beside Kolmar Korea and Intercos
One company proves nothing. So I put three cosmetics ODM makers side by side and ordered them three separate ways. The Korean comparison is Kolmar Korea; the international one is Intercos, listed in Milan, which is the closest publicly traded equivalent outside Korea.
| Company | Net margin | ROE | Debt measure | P/B |
|---|---|---|---|---|
| Cosmax | 5.47% | 23.9% | Liabilities/equity 289.6% | 4.18 |
| Kolmar Korea | 6.18% | 14.7% | Liabilities/equity 116.44% | 2.77 |
| Intercos | 4.76% | 10.35% | Debt/equity 0.52 | 2.54 |
Cosmax and Kolmar Korea figures are Kiwoom Securities data as of the Friday, August 7, 2026 close. Intercos figures come from stockanalysis.com, page dated Tuesday, July 7, 2026: share price 13.24 euros, market value 1.24 billion euros, trailing revenue 1.05 billion euros, trailing net income 49.83 million euros. The two debt measures are not computed the same way. The Korean ratio puts total liabilities over equity; the international screener convention puts interest-bearing debt over equity. I use the Intercos entry only to read the direction of the ranking, and I do not add or subtract it against the Korean pair.
Order by net margin and you get Kolmar Korea, then Cosmax, then Intercos. Order by ROE and you get Cosmax, then Kolmar Korea, then Intercos. Order by how much the balance sheet is carrying and you get Cosmax, then Kolmar Korea, then Intercos again, which is the ROE order exactly.
I ran the same decomposition on Kolmar Korea to see how far it travels. Its ROE of 14.7 percent over a 6.18 percent net margin gives a factor of 2.38; strip out leverage of 2.16 and the residual is 6.79 percent (my calculation), above Cosmax’s 6.13 percent. Remove the borrowing and the ranking flips. One caution, and I will not bury it: the equity figure recovered by that same route misses the vendor’s reported total equity for Kolmar Korea by 14.15 percent, where the Cosmax reconstruction missed by 1.78 percent. So I treat the 6.79 percent as indicative only, and I rest the conclusion of this piece on the four figures the vendor publishes directly: net margin, ROE, debt ratio, price-to-book.
The largest revenue quarter came with a 3 percent operating gain
If leverage is holding the ROE up, the follow-up question is whether the operating side is closing the gap on its own. The most recent quarter answers it.
First-quarter results released on Tuesday, May 12, 2026 showed revenue of 682.0 billion won, the highest quarterly figure in company history, up 16 percent year on year. Operating profit in the same quarter was 53.0 billion won, up 3 percent. Reconstructing the prior-year quarter from those two growth rates gives revenue of 587.9 billion won and operating profit of 51.5 billion won, so the operating margin moved from 8.75 percent down to 7.77 percent, a decline of 0.98 percentage points (all my calculations, approximate because the published growth rates are rounded). Net profit was 43.8 billion won, up 312 percent from about 10.6 billion won a year earlier.
By subsidiary the quarter split into Korea 423.2 billion won (up 17 percent), China 194.7 billion won (up 20 percent), the United States 42.0 billion won (up 46 percent), Thailand 24.3 billion won (up 2 percent) and Indonesia 22.7 billion won (down 23 percent). Those five add to 706.9 billion won, which overshoots consolidated revenue of 682.0 billion won by 24.9 billion won. I read the difference as intercompany sales eliminated in consolidation.
The full year has the same shape. Fiscal 2025 results, summarized in trade press on Tuesday, February 24, 2026, showed revenue of 2.399 trillion won (up 10.7 percent) and operating profit of 195.8 billion won (up 11.6 percent), both company records. The Korean subsidiary alone produced 1.526 trillion won of revenue and 154.6 billion won of operating profit, an operating margin of 10.13 percent (my calculation), against a consolidated operating margin of 8.16 percent. Domestic work is pulling the average up and the overseas units are pulling it down. China contributed 632.7 billion won (up 10.2 percent), the United States 132.6 billion won (down slightly), Thailand 73.2 billion won (up 68.2 percent) and Indonesia 97.7 billion won (down 13.7 percent).
The subsidiary figures overshoot the consolidated line here too. Those five units add to 2.463 trillion won against consolidated revenue of 2.399 trillion won, an excess of 63.8 billion won, or 2.66 percent of the consolidated total (my calculation). The comparable figure for the first quarter of 2026 was 3.65 percent. Both are small, but the eliminated share grew between the two periods instead of shrinking, which is worth watching in a group that keeps adding overseas plants that supply one another.
One more check on the equity side, since the whole argument turns on how small that equity base is. A dividend of 3,300 won across 11,349,392 shares comes to about 37.5 billion won paid out. Set that against earnings per share of 10,844.33 won multiplied by the same share count, or 123.1 billion won, and the payout works out to 30.4 percent, which matches the published ratio exactly. That also tells me the payout is computed on the controlling-interest earnings figure and not on the 131.1 billion won consolidated number, a gap of about 8.0 billion won. The practical point for this piece is that roughly seventy cents of every earned won stays in the company, and retained earnings are the only thing that rebuilds the equity base against which the 289.6 percent ratio is measured.
Cosmax stock: the figures I worked from and what each one is dated
| Item | Value | Item | Value |
|---|---|---|---|
| Close | 205,500 won (~145 dollars) | Market value | 2.332tn won (~1.65bn dollars) |
| P/E | 18.95x | P/B | 4.18x |
| ROE | 23.9% | Net margin | 5.47% |
| Liabilities/equity | 289.6% | Interest coverage | 2.91x |
| EPS | 10,844 won | BPS | 49,206 won |
| Dividend per share | 3,300 won | Dividend yield | 1.61% |
| Payout ratio | 30.4% | Foreign ownership | 36.41% |
| 250-day high | 270,000 won | 250-day low | 141,000 won |
| Seven-metric score | 5 of 7 | Shares outstanding | 11,349,392 |
Three notes belong with that table. Computing the price position from the same 205,500 won close puts the shares at 76.1 percent of the 250-day high, down 23.9 percent from it and up 45.7 percent from the low (all my calculations). Those high and low readings are intraday values, so a close-to-close drawdown will differ. The 30.4 percent payout ratio reconciles: 3,300 won of dividend over precise earnings per share of 10,844.33 won gives 30.43 percent. A second payout field on the same record reads 72.2 percent and I could not establish its basis, so I left it out. Operating cash flow, free cash flow and EBITDA all carried magnitudes inconsistent with the rest of the record, so none of the three appears anywhere in this piece, and the total equity field was empty, which is why I used the book-value-per-share route instead.
On price action, the August 7 close of 205,500 won is up 13.85 percent over one month, down 1.2 percent over three months and down 13.29 percent over twelve. It sits 11.62 percent above the 20-day moving average, 17.91 percent above the 60-day and 11.16 percent above the 120-day, so above all three. Dividends per share went 500 won for fiscal 2023, 2,300 won for 2024 and 3,300 won for 2025, per Korean regulatory filings.
What the brokerage reports put on paper about Cosmax stock
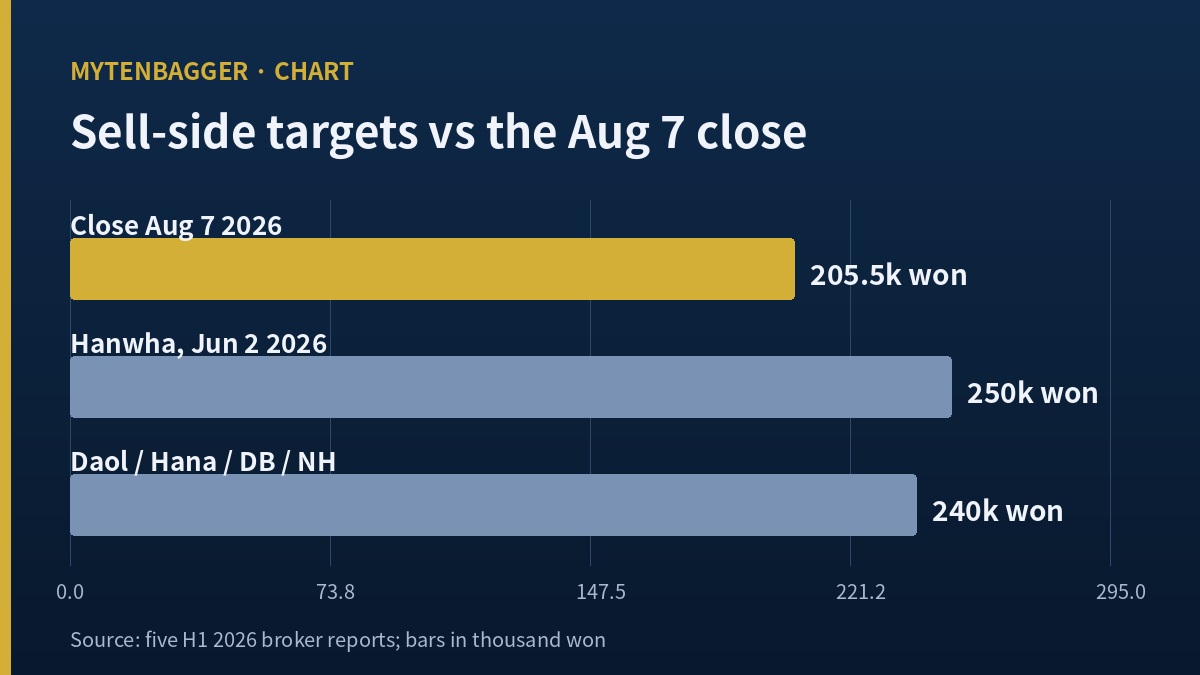
Collecting the Korean sell-side work published in the first half of 2026, the valuation band is narrow. Hanwha Investment and Securities carried 250,000 won in a second-half outlook dated Tuesday, June 2, 2026. Daol Investment and Securities carried 240,000 won on Wednesday, July 8, 2026. Hana Securities analyst Park Jong-dae carried 240,000 won on Tuesday, June 9, 2026. DB Financial Investment analyst Heo Je-na carried 240,000 won on Wednesday, April 15, 2026. NH Investment and Securities carried 240,000 won on Monday, April 13, 2026. Against the 205,500 won close that band spans roughly 16.8 percent to 21.7 percent of headroom (my calculation).
One disclosure about that list. Of the five, I read the underlying articles for two of them, Hana and DB. For the other three I have the report-briefing headline and its publication date and nothing more, which is why I have not attributed those three to a named analyst and have not linked to articles I did not open.
The two I did read point in opposite directions. Hana’s view was that a wider mix of skincare would offset softening color cosmetics and lift profitability, with the US subsidiary approaching breakeven. DB, working the same period, credited the spillover from strong Korean cosmetics exports but added that this is “a period without a new leading skincare-centered brand of the scale that would deliver economies of scale”, as translated from the Korean report briefing. The same 240,000 won figure carries two different sentences behind it.
What I keep in mind reading any of them is that these valuations all assume the 23.9 percent return on equity persists. If most of that 23.9 percent is produced by the capital structure, then what the reports are buying into is the maintenance of the balance sheet as much as improvement in the business. The reports themselves do not separate the two. I picked up that habit after working through a case where a multiple moved because of the earnings beneath it and not the price, and after a case where an unrevised valuation quietly implied a weaker margin than the headline suggested.
Seven things that push against my reading
Here is what would have to be different for my conclusion to fail, and what already points the other way.
- The debt ratio may already be coming down. Korean financial outlet Numbers, in an article dated July 28, 2025, put the ratio at 315.2 percent as of the end of the first quarter of 2025 and set it against a 113.6 percent average for the hundred largest KOSPI companies. Of the 1.554 trillion won of liabilities at that date, 81.1 percent, or 1.260 trillion won, was current. The 289.6 percent on my screen today is lower. The two readings are dated differently, so I will not claim a 25.6 point improvement as fact; I read the direction only.
- Leverage arrives with a bill. Interest coverage of 2.91 times means operating profit covers interest expense 2.91 times over. Kolmar Korea covers it 6.36 times. If this ratio slips below two, I think the cost of the borrowing starts to outweigh what it buys.
- Record revenue did not arrive with better margins. The first quarter set a revenue record while the operating margin fell from 8.75 percent to 7.77 percent (my calculation). If that pattern repeats, the ROE becomes more dependent on leverage, not less.
- The price-to-book multiple clears the sector line. The seven-metric checklist I use sets a 3.0 price-to-book threshold for cosmetics names. Cosmax fails on both P/E and P/B and scores 5 of 7. Kolmar Korea scores 6 of 7.
- The overseas units are heading different ways. Indonesia fell 13.7 percent in fiscal 2025 and another 23 percent in the first quarter of 2026. The United States rose 46 percent in the same quarter. Which of those becomes representative is not settled.
- The capital spending program is still running. Numbers, in the same article, tracked capital expenditure at 84.2 billion won in 2022, 86.3 billion won in 2023 and 164.9 billion won in 2024, and noted a new Thai plant at Bangphli costing roughly 56 billion won targeted to start up in September 2026. Until that spending finishes, the debt ratio may stay elevated longer than I expect.
- My own arithmetic rests on an assumption. This decomposition assumes net margin, debt ratio, ROE and book value per share are all computed on the same basis. For Cosmax the assumption held within 1.78 percent. For Kolmar Korea it broke by 14.15 percent. The method does not close everywhere. Leverage-driven profitability and business-driven profitability are something I separated deliberately for the first time here. Before this, I checked the ROE figure and moved on, and there are names on my list I passed over that way.
Why I am not buying Cosmax stock at 205,500 won
I hold no position in Cosmax and I have no order working. My reason fits in one line. I do not want to pay for the same thing twice.
The 289.6 percent debt ratio is printed on the screen and so is its cost, the 2.91 times interest coverage. Paying 4.18 times book for the 23.9 percent return that leverage produced means paying a premium for what the borrowing delivers while leaving what the borrowing costs out of the calculation. On the business itself I get 6.13 percent (my calculation), and at 6.13 percent I will not pay 4.18 times book.
Two things would bring me back. The first is the net margin rising. Holding the debt ratio where it is, a durable ROE eventually needs margin underneath it, and the first visible sign would be a quarter where the consolidated operating margin clears the 8.16 percent posted for fiscal 2025. The second is the debt ratio falling toward the low 200s, because at that level the same ROE contains more business and less balance sheet.
For the condition that would prove me wrong, I am borrowing someone else’s forecast instead of using the company’s own history. Hana Securities wrote on Tuesday, June 9, 2026 that domestic and overseas margins improve through the second half of 2026. If that happens and operating profit growth outruns revenue growth across both of those quarters, then the premise of this piece, that revenue can climb without the margin following, is simply false, and the 6.13 percent needs recomputing.
Is a high ROE with a high P/B not simply consistent?
They are consistent, and that is my objection. Price-to-book prices equity, and a company with a thin equity base relative to assets will show both a high ROE and a high price-to-book from the same cause. I do not treat the pair as two independent pieces of good news.
Is the 6.13 percent an actual reported figure?
No. It is mine, not the company’s and not the vendor’s. It comes from decomposing ROE into net margin, asset turnover and financial leverage, setting leverage to one, and multiplying the remaining two. A Cosmax with no borrowings does not exist, so the number is a reference line for comparison and not a result the company reported.
Does the comparison with Intercos hold up?
Only directionally. Intercos is the nearest listed cosmetics ODM outside Korea and its net margin of 4.76 percent with a 10.35 percent ROE fits the pattern, but its debt measure is built on a different convention from the Korean pair, and its figures are dated Tuesday, July 7, 2026, a month behind the Korean pair. I used it to see whether the ordering survives outside one market. I did not use it to size anything.
Prices and multiples in this piece reflect the Friday, August 7, 2026 close as checked at the time of writing, and are Kiwoom Securities data unless another source is named. This article publishes later than it was written, so live quotes will differ. Korean won is the reference currency throughout; dollar figures are rounded conversions at approximately 1,416.1 won per dollar, the Seoul foreign exchange market close on the same date as reported by Money Today. Intercos figures stay in euros as published. Anything marked “my calculation” was derived by me and does not appear in the underlying source.
Related reading
- Handsome Corp Stock: Markdowns Took the Margin, Not the Market
- Sebang Battery Stock Funds Lithium Out of Lead Margins