Why a Rising Simmtech Share Price Widens the Company’s Loss
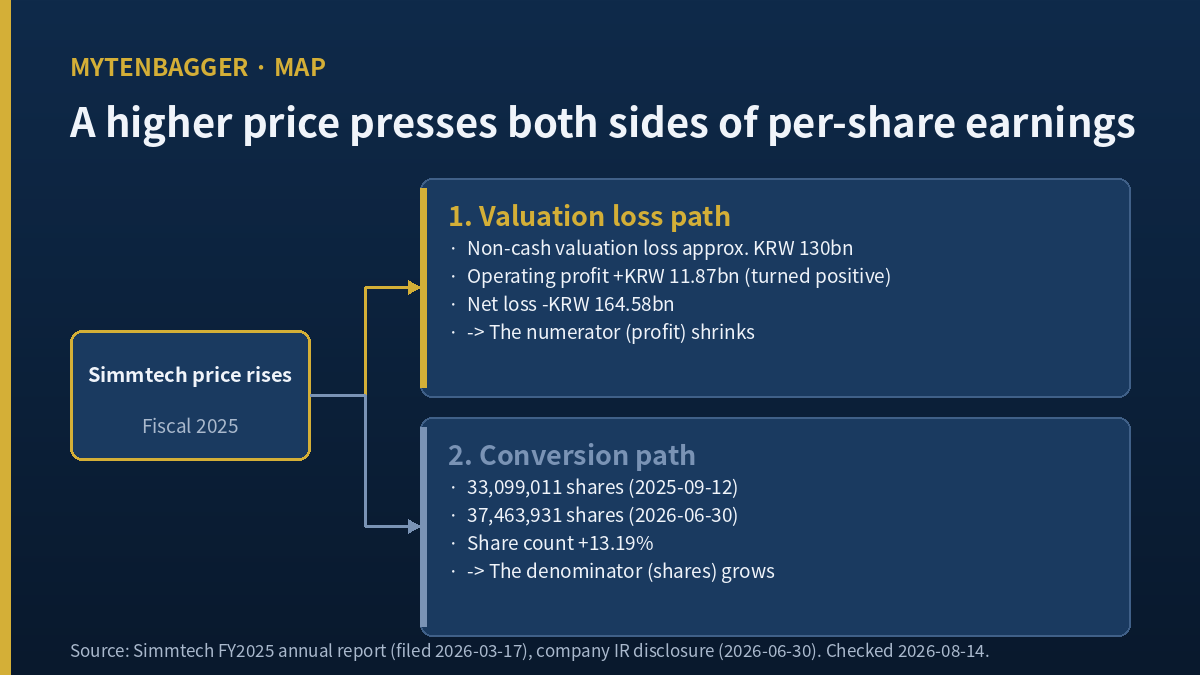
If I buy Simmtech stock today and the price doubles from here, this company will report a bigger loss because of it. That sentence describes an accounting mechanism, and in fiscal 2025 the mechanism ran at full strength. The company posted operating profit of ₩11.87 billion (about $8.4 million) and, on the same income statement, a net loss of ₩164.58 billion (about $116.0 million). The audited annual report filed on March 17, 2026 carries both figures. Between those two lines, ₩176.45 billion went missing, and management explained roughly ₩130 billion of it in a single disclosure sentence, which I am paraphrasing from Korean instead of presenting as an English quotation: the company said it had recognized a non-cash valuation loss of approximately ₩130 billion on its fourth-series convertible bond and fifth-series bond with warrants, caused by the rise in its own share price.
I am looking at it at the August 13, 2026 close of ₩105,800 (about $74.54). What follows is a record of why I have set aside the per-share earnings calculation entirely on this one.
Four dated events, in the order they happened
| When | What happened |
|---|---|
| Through 2025 | Share price climbs. Conversion rights on the outstanding bonds gain value, and the company books that gain as a loss. |
| Q4 2025 | Operating profit +₩10.26bn, net loss −₩116.76bn in the same three months (both derived). |
| Full-year 2025 | Net loss ₩164.58bn, yet total equity rises from ₩448.48bn to ₩576.37bn as the same bonds convert into shares. |
| Sep 2025 to Jun 2026 | Share count goes from 33,099,011 to 37,463,931, up 13.19% (my calculation). |
One security produced the loss on the income statement and the equity increase on the balance sheet in the same twelve months. That is the whole subject of this piece.
Contents
Why Simmtech Stock Rising Becomes a Line on the Income Statement
A convertible bond is debt when it is issued, but the conversion feature attached to it is carried separately as a derivative and remeasured every reporting period. The input to that remeasurement is the equity price. When the shares get more expensive, the party holding the conversion right is better off, and the issuer records that improvement as a loss. Nothing leaves the bank account. Management said so directly, describing the item as a valuation loss with no cash outflow.
So 2025 unfolded this way. The business turned its first positive operating year since 2022, and while it did, buyers pushed the equity up, the conversion feature inflated, and the inflation landed underneath the operating line as a charge. The ₩176.45 billion gap between operating profit and net loss works out to 14.87 times operating profit (my calculation). More than fourteen times what the business earned was erased below the line where the business ends.
Which quarter absorbed it
Split by quarter and the location is obvious. Discrete fourth-quarter 2025 operating profit came to +₩10.26 billion while the net line for the same three months read −₩116.76 billion. Both are derived by subtracting nine-month cumulative figures from the annual audited total. The net loss is 11.38 times the operating profit (my calculation), and 70.95% (my calculation) of the full-year net loss occurred in that one quarter. Korean sell-side research from Kyobo Securities dated February 25, 2026 put Q4 operating profit at ₩11.0 billion and attached the same explanation, a derivative valuation loss driven by the share price. I have used the ₩10.26 billion derived from audited annuals, and I am leaving the ₩0.74 billion discrepancy visible instead of smoothing it.
| Quarter | Revenue | Operating profit | Net |
|---|---|---|---|
| Q1 2025 | 303.60 | −16.32 | −35.80 |
| Q2 2025 | 340.77 | +5.54 | −18.72 |
| Q3 2025 | 372.84 | +12.39 | +6.70 |
| Q4 2025 (derived) | 393.36 | +10.26 | −116.76 |
| Q1 2026 | 422.37 | +13.71 | +14.45 |
| Q2 2026 | 514.57 | +62.89 | +44.95 |
Billions of won, consolidated, discrete quarters. Q1 to Q3 2025 and Q1 2026 come from Korean regulatory filings. Q4 2025 is derived. Q2 2026 comes from the fair-disclosure preliminary release of August 5, 2026 as carried in the Korean press. At ₩1,419.4 per dollar, Q2 2026 revenue is roughly $362.5 million and operating profit roughly $44.3 million.
The line that catches my eye is Q1 2026. Net income of ₩14.45 billion exceeds operating profit of ₩13.71 billion by ₩0.74 billion. Items below the operating line usually subtract, and in that quarter they added. Kyobo Securities, in a note dated May 7, 2026, credited the disappearance of the derivative valuation loss. What I could not do is open the quarterly footnotes and find the individual derivative figure for that period, or account precisely for the ₩0.74 billion by which net exceeded operating. I am not going to write that up as if I had verified it.
A Loss Year That Grew Equity by ₩127.89 Billion
Lose ₩164.58 billion in twelve months and equity normally falls by about that much. Here it went the other way. Total equity finished FY2024 at ₩448.48 billion (about $316.0 million) and FY2025 at ₩576.37 billion (about $406.1 million), an increase of ₩127.89 billion. Add back the loss and something delivered ₩292.47 billion (my calculation) into the equity account during the year.
The source of that inflow is the same security that created the charge. As the fourth-series convertible bond and fifth-series bond with warrants converted into common shares, amounts sitting in liabilities moved into equity. The company stated that roughly 97% of the issued amount had converted by the end of 2025. One security therefore showed up as a ₩130 billion charge on the income statement and a several-hundred-billion-won equity increase on the balance sheet, in the same twelve months.
This also explains the debt ratio. It read 250.22% at the end of Q1 2025 and 181.13% at the end of Q4 2025. Total liabilities did not shrink over that stretch. They grew from ₩994.80 billion to ₩1,043.96 billion, an increase of ₩49.16 billion. The ratio fell because the equity beneath it expanded faster, and that expansion came from bonds becoming shares instead of from retained operating profit.
Where this parts company with two earlier pieces
I have written about funding structure twice recently and this is a different question. In the Taihan Cable piece I counted who supplied the money for growth, placing two rights issues beside cumulative operating earnings. In the ISU Petasys piece I looked at how incoming capital got allocated once it arrived.
Neither of those is what I am doing here. This piece looks at one narrow thing, which is that the funding vehicle itself enters the income statement and moves the earnings figure. A rights issue increases the share count and leaves the income statement untouched. A convertible does not. Until it converts, it is remeasured at market each period and the remeasurement lands in earnings. In the Taihan piece I was counting money that had reached a bank account. Here I am counting a valuation that has reached nothing at all.
Simmtech Stock and the Share Count Move Together
The second path in this loop is the share count. When the market price sits above the conversion price, holders have a reason to convert. Shares outstanding went from 33,099,011 at the September 12, 2025 call-option exercise by the parent, Simmtech Holdings, to 37,463,931 as published by company investor relations for June 30, 2026. That is 4,364,920 shares, or 13.19% (my calculation).
Earnings per share divides profit by the number of shares. At this company, both halves of that division take the equity price as an input. When the price rises, profit above shrinks because of the valuation charge, and the share count below grows because of conversion. Two forces push the per-share figure the same direction. That is why the calculation is on hold. I can perform it. What I cannot do is explain what the answer says about the business.
Three screens, three share counts
Conversion being underway shows up in the data itself. I met three different values for shares outstanding while writing this. The indicator database gives 37,464,193. Company investor relations gives 37,463,931 as of June 30, 2026. FnGuide company data gave 37,974,228 when queried on August 12, 2026. The widest gap is 510,297 shares.
I pinned market capitalization to the won using the vendor’s own share count. ₩115,900 × 37,464,193 = ₩4,342,099,968,700, which matches the ₩4,342.1 billion the indicator screen reports, so that screen is priced off the August 10, 2026 close of ₩115,900. Recomputed at the August 13, 2026 close of ₩105,800, market capitalization becomes ₩3,963.71 billion (my calculation), roughly $2.79 billion. Every valuation figure below uses that number.
What 2026 Looks Like If the Loop Is Already Broken
Everything above is my argument. The strongest evidence against it sits in the same filings. In 2026 this reads like a different company. Second-quarter revenue was ₩514.57 billion and operating profit ₩62.89 billion, up 1,034.38% (my calculation) from the year-ago quarter and 358.68% (my calculation) from the previous one. The Q2 operating margin of 12.22% (my calculation) is the first double-digit reading since Q4 2022. First-half revenue reached ₩936.94 billion with operating profit of ₩76.60 billion, against an operating loss of ₩10.78 billion in the year-ago half.
On the same day as the results, August 5, 2026, the company issued its own second-half outlook through a fair-disclosure filing: revenue of ₩1,071.9 billion (range ₩1,061.9 billion to ₩1,081.9 billion) and operating profit of ₩163.1 billion (range ₩158.1 billion to ₩168.1 billion), roughly $755.2 million and $114.9 million. The stated drivers were continued System IC growth, SOCAMM volumes ramping in earnest, and margin gains from a richer AI product mix, with the usual caveat that conditions could change the outcome. Add that outlook to the reported first half and full-year 2026 operating profit comes to ₩239.70 billion (my calculation). Divide the ₩3,963.71 billion market capitalization by that figure and the multiple is 16.54 times (my calculation).
One more thing about that outlook. This company treats its own guidance as a floor it tends to clear. On February 24, 2026 it guided first-half operating profit to ₩50.1 billion (range ₩45.1 billion to ₩55.1 billion). The actual first half came in at ₩76.60 billion, exceeding the top of its own range by 39.02% (my calculation). Korean sell-side estimates run above the company’s number: Hana Securities analyst Kim Min-kyung modeled ₩258.5 billion of 2026 operating profit according to Korean press coverage dated August 8, 2026. I am keeping the company outlook and the sell-side estimates in separate sentences on purpose. The first is what the issuer published under its own name, and the second is what outsiders built after reading it.
Why I still cannot call the loop finished
A seventh-series convertible bond issued on June 20, 2025 is still outstanding. It totals ₩50.0 billion at a conversion price of ₩21,556, and its thirty-year maturity gives it perpetual-security treatment, so it counts toward equity. Simmtech Holdings exercised a purchase option disclosed on June 5, 2026, taking ₩16.5 billion of face value for a payment of ₩17.32 billion. ₩16.5 billion ÷ ₩21,556 corresponds to 765,448 shares. Whether that tranche was extinguished or is simply being held as bonds by the parent, still convertible later, is something I could not settle from the filings. The balance outside the parent is ₩33.5 billion, which divides into 1,554,092 shares (my calculation), or 4.15% (my calculation) of shares outstanding at June 30, 2026.
The August 13, 2026 close of ₩105,800 sits at 4.91 times (my calculation) that conversion price. For the incentive to convert to disappear, the price would have to fall below ₩21,556, about a fifth of where it trades. So the earnings figure and the share count remain inside a range where the market price is an input to both. That said, the remaining ₩33.5 billion is far smaller than the fourth and fifth series that produced the ₩130 billion charge, and its perpetual treatment may carry different accounting. I could not confirm that difference in the footnotes either.
Ibiden Had Its Customers Pay for the Same Build
The phrase “non-cash” is one I had been reading as a synonym for “ignore this.” Charges that never touched the bank account went into a mental bucket marked irrelevant, and I moved on to the operating line. This company is where that shortcut stopped working for me, because the non-cash charge here is not noise around the business. It is the arithmetic consequence of the same price move that lifts the shares, and pretending it does not exist would mean pretending the share count is not growing either.
Setting a peer beside it makes the funding choice legible. Japan’s Ibiden (TSE: 4062) is regarded as the global leader in FC-BGA substrates for AI servers. On February 5, 2026 it announced roughly ¥500 billion of capacity expansion across fiscal 2026 through fiscal 2028.
Where that money comes from is the comparison I wanted. According to Toyo Keizai’s reporting, the ¥500 billion arrives as customer prepayments, ¥220 billion from Intel and ¥280 billion from Nvidia. The two figures sum exactly to the announced program. Ibiden’s results presentation dated May 12, 2026 states the policy plainly, that growth investment is kept within operating cash flow including prepayments received, and the same material aims to shrink interest-bearing debt.
Ibiden has a convertible too, a ¥70 billion zero-coupon convertible bond with warrants due 2031, issued in February 2024. That is a separate transaction from this expansion, and the expansion itself is funded by customers. Two companies faced the same AI substrate demand at the same moment. One took the money from people who will be its future shareholders, and the other took it from the customers it already has. The cost of Simmtech’s choice appears below its operating line.
I did not put the two companies’ margins or multiples in a single table. The scale is different (Ibiden reported ¥416.2 billion of revenue for the fiscal year ended March 2026), the accounting standards differ, and Ibiden carries other segments such as ceramics, which contributed ¥24.37 billion of the ¥123.22 billion first-quarter revenue for its fiscal year ending March 2027, or 19.77% (my calculation). For reference only, Ibiden’s operating margin for the year ended March 2026 was 14.90% (my calculation) and its equity ratio 57.27% (my calculation), against Simmtech’s Q1 2026 debt ratio of 181.91%. Placing those two figures side by side is as far as I am willing to take it.
The Sell-Side Figures Attached to Simmtech Stock
Korean brokerages moved their published figures up sharply over five months, and the most recent one moved back down. Below is only what I could verify. I opened the original documents for the two Kyobo notes and reached the rest through secondary Korean press.
| House and analyst | Date | Figure attached then | 2026 operating profit estimate |
|---|---|---|---|
| DB Financial, Cho Hyun-ji | Feb 25, 2026 (Wed) | ₩65,000 | ₩130.6bn |
| Daishin, Park Kang-ho | May 7, 2026 (Thu) | ₩105,000 | ₩140.4bn |
| Kyobo, Park Hee-cheol | May 7, 2026 (Thu) | ₩135,000 | ₩182.4bn |
| Shinhan, Oh Kang-ho | May 28, 2026 (Thu) | ₩150,000 | not confirmed |
| iM Securities, Ko Eui-young | Jun 8, 2026 (Mon) | ₩185,000 | ₩241.0bn |
| Meritz | Reported Aug 6, 2026 (Thu) | ₩170,000 (pulled back) | ₩246.7bn |
Each row is the figure that house attached on that date, and the dates differ from one another. Sources are Newspim, Financial News and Korean coverage of the post-results revisions on August 6, 2026. I could not confirm Shinhan’s 2026 operating profit estimate or the name of the Meritz analyst.
The Meritz row is the one worth pausing on. It raised 2026 and 2027 operating profit estimates to ₩246.7 billion and ₩458.6 billion while pulling its published figure from ₩190,000 to ₩170,000. The reported reason was declining share prices at global substrate peers. Lifting the earnings model while trimming the top of the valuation range implies that a meaningful share of what this equity is worth depends less on its own results and more on where comparable companies trade. The shape of that disagreement differs across the same supply chain — KCTech carries two 2026 forecasts that differ by 2.3 times.
Numbers I Left Out of My Simmtech Stock Read
The two multiples
Price-to-earnings does not compute here. The indicator screen prints zero, and earnings per share reads −₩4,493 in the indicator database or −₩4,955 at FnGuide, so no positive multiple exists. Those two sources differ by ₩462 and I could not establish whether the difference is controlling-interest versus total consolidated. Since my argument is that the loss did not come from the business, I would have set the multiple aside even had it computed.
Price-to-book comes to 6.86 times (my calculation, against book value per share of ₩15,418) at the August 13, 2026 close. I left that out too. Equity, the quantity underneath the ratio, has just been enlarged by bond conversion, which makes it hard to separate a multiple that moved because the business improved from one that moved because the capital base grew. Equity rose 28.52% in a year, so the ratio falls on its own at an unchanged price.
Checks that did not close and fields with no meaning
The par-value check failed to reconcile. Paid-in capital of ₩19.884 billion per company investor relations, divided by 37,463,931 shares, gives ₩530.75 (my calculation) against a stated par value of ₩500. At ₩500 par and that share count, paid-in capital should be ₩18.732 billion (my calculation), which is roughly what the indicator database reports at ₩18.7 billion. I could not obtain the treasury-share quantity from the June 17, 2026 buyback decision and the June 25, 2026 completion report, so the difference stays unexplained and I did not use the item as evidence.
The indicator screen’s EBITDA field reads 13,711 in millions of won, identical to the won figure for Q1 2026 operating profit of ₩13.711 billion. I treated it as a copied value instead of an independent measure and dropped it. I also left the 0.37 interest-coverage figure alone. This company’s finance-cost account has derivative valuation items mixed into it, moving from ₩117.01 billion cumulative at Q2 2025 to ₩117.44 billion cumulative at Q3 2025, a change of ₩0.42 billion across a full quarter. Pure interest expense cannot behave that way, so a ratio built on it cannot mean anything either.
Operating cash flow I excluded for a different reason. It ran at −₩93.40 billion in FY2023, −₩161.26 billion in FY2024 and −₩198.61 billion in FY2025, negative three years running. That is real money leaving the company, and it has nothing to do with how an item is presented. I handled it in the case-against section below.
The Case Against How I Read Simmtech Stock
Here is everything I found that weakens or contradicts the argument above. A short list here would mean thin research, and not a strong view.
- What I called causation might be correlation. The price rose in 2025 and the valuation charge grew in 2025, and I have not matched quarterly derivative amounts against quarterly price moves one by one.
- Operating cash flow has been negative three years running, worst in FY2025 at −₩198.61 billion, the year operating profit turned positive. That has nothing to do with valuation charges and may matter more than my argument does.
- The Q4 2025 figures I used are derived by subtracting nine-month cumulative from annual. Kyobo’s ₩11.0 billion differs from my ₩10.26 billion by ₩0.74 billion.
- Assigning the Q4 net loss to derivatives rests on Kyobo research and company commentary. How much other one-time material sits inside that number is something I did not verify in the footnotes.
- Nvidia’s reported reduction in SOCAMM capacity, covered on June 8, 2026, is a demand-side issue that has nothing to do with accounting. iM Securities’ Ko Eui-young argued that standardization keeps area demand intact, but the capacity reduction itself was reported as fact.
- The trailing one-year return is 342.33% (August 13, 2025 to August 11, 2026, close to close). KOSDAQ returned 5.37% and the electronics-equipment sector 12.53% over the same window, so almost all of the excess is stock-specific. The market may already be filtering out the accounting item.
- Read the other way, that 342.33% is history. The price fell from a ₩157,300 close on July 1, 2026 to ₩63,800 on July 30, 2026, and the August 13, 2026 close sits −32.74% from that peak and +65.83% off that trough (both my calculation).
- Simmtech Holdings took ₩16.5 billion of face value through its call option. A parent reducing the free float can be read as a constructive signal.
- The seventh series carries perpetual-security treatment and does not burden the debt ratio. Its remaining 4.15% (my calculation) of dilution is not large.
- Equity created through conversion is real equity. Going from a 250.22% debt ratio to 181.13% cannot be dismissed as presentation. It is genuine balance-sheet repair.
- The company published second-half guidance in numbers. That is uncommon among Korean listed companies, and its previous first-half guidance proved conservative.
- Q2 2026 operating profit of ₩62.89 billion is 11.34 times the year-ago quarter. At that magnitude of change, one could argue the accounting discussion is secondary.
- Net income exceeded operating profit in Q1 2026. That can be read as the loop having already reversed.
- Roughly 97% of the fourth and fifth series had converted by the end of 2025. The portion generating charges is largely spent.
- Derivative valuation losses consume no cash. The company said as much in its filing, and dividend capacity and capital expenditure capacity are unaffected.
- The heaviest objection is this one. If the loop I described has already unwound during 2026, then this piece is holding on to a stale accounting artifact while missing the current results. I do not have the evidence to rule that out.
My Position on Simmtech Stock and What Would Change It
Judged on the operating numbers alone I think well of this company. Revenue has increased for five consecutive quarters, the operating margin reached 12.22% (my calculation) in Q2, and if the company’s own second-half outlook holds, full-year operating profit of ₩239.70 billion (my calculation) puts the market capitalization at 16.54 times (my calculation). AI server substrates are about as strong a demand backdrop as exists right now.
What I have not done is compute earnings per share. That was a choice and not an inability. While profit above and share count below both take the market price as an input, the result of that division reflects the price I am willing to pay more than it reflects what the business accomplished.
The condition under which I am wrong
If what I called causation turns out to be two trends that happened to overlap, the frame of this piece collapses. The test I will apply is this: match quarterly derivative valuation amounts against the direction of the share price in that quarter across at least six quarters, and if the direction disagrees in more than half of them, I drop the argument. A quarter where the price jumped and the valuation charge did not grow, or one where the price fell and the charge did grow, would settle it against me. Running that test means opening the derivative note in each quarterly filing, and I have not done that work yet.
Daeduck Electronics piece, LG Innotek piece
What Would Get Me to Run the Number
Three conditions release the calculation I have deferred. First, the Q3 2026 report in mid-November showing a third consecutive quarter in which derivative valuation does not determine the direction of net income, since Q1 and Q2 2026 already point that way. Second, the ₩33.5 billion seventh-series balance converting or being redeemed so that shares outstanding settle on one value. Third, annual operating cash flow turning positive. With those in hand I compute earnings per share and judge the company on whatever comes out.
Until then the calculator stays shut. What is keeping me out of this name is not the company, whose operating results have been improving in a straight line for five quarters. It is that my own arithmetic returns a figure I cannot interpret, because the inputs move when I move. In the Nexen Tire piece I wrote that I skip a multiple when the profit inside it was generated outside the business. This goes one level deeper. The profit figure here responds to my own act of buying, and a tool that changes when I pick it up is a tool I set down.
Prices and multiples reflect the August 13, 2026 close of ₩105,800 as checked at the time of writing. Market capitalization and derived ratios use that close with 37,464,193 shares outstanding unless stated otherwise, while the indicator database values come from a Kiwoom feed refreshed at 20:07 on August 10, 2026 and are therefore priced off ₩115,900. Drawdown and range-position figures were recalculated to the close used here. Financial figures are consolidated and drawn from Korean regulatory filings unless stated otherwise, with derived items labeled as my calculation. Korean won is the reference currency throughout, and USD conversions are approximate at ₩1,419.4 per dollar, the Seoul market close on August 13, 2026. Yen figures are left in yen.