SK Eternix KKR Deal: Why the Control Premium Was Negative
In March 2026, KKR agreed to buy 43.49 percent of a Korean renewable energy developer and paid 23,700 won a share for it. That figure is public. It is also, as far as I can tell, the only price in this entire file that somebody was contractually obliged to hand over. Every other number I looked at while reading SK Eternix stock is a quote, an estimate, or a print on a screen. One of them cost someone 347.9 billion won, or roughly 245 million dollars at the exchange rate I note at the end.
What kept me on it for an evening is that the distinction above almost never survives into public view. Usually the price a strategic buyer paid is buried, estimated, or simply absent, and I end up comparing quotes with quotes. Here the seller, the buyer, the share counts and the totals are all disclosed, and the multiplication closes to the won.
Five prices on one ordinary share, and who set each one
| Date | Price | Was anyone obliged to pay it? |
|---|---|---|
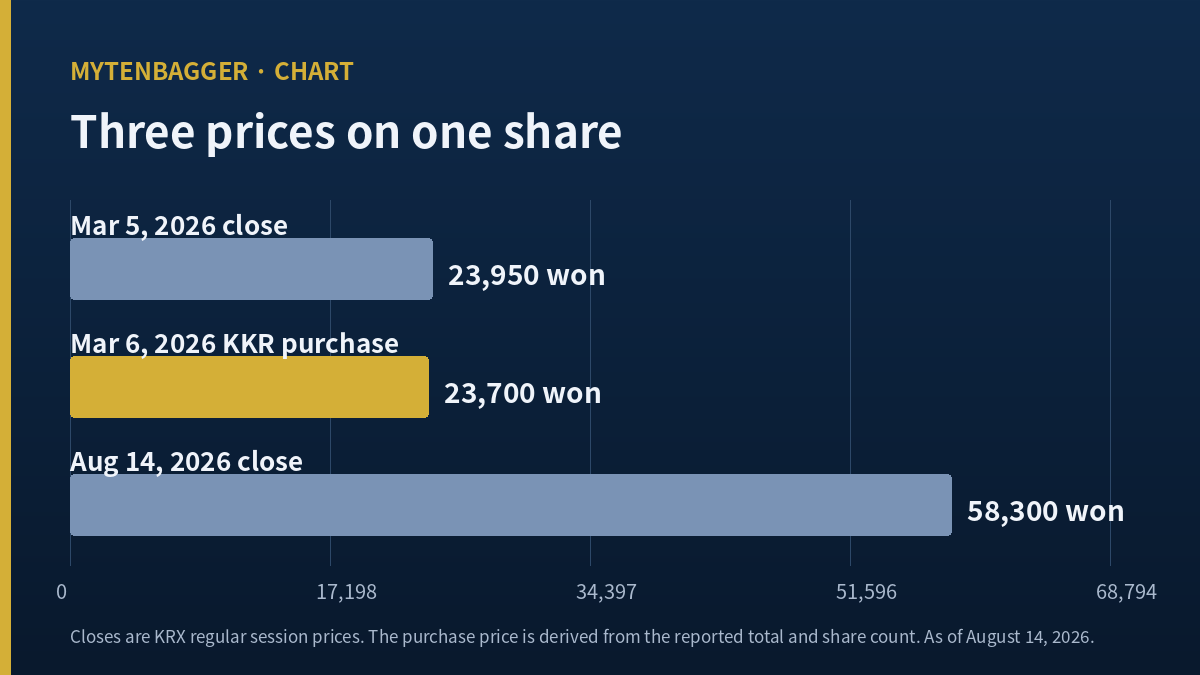
| March 5, 2026 (Thu) close | 23,950 won | No. The last print before the news. |
| March 6, 2026 (Fri) deal | 23,700 won | Yes. Contracted, for 14,681,280 shares. |
| May 15, 2026 (Fri) note | 60,000 won | No. A valuation Hana Securities wrote. |
| July 24, 2026 (Fri) close | 80,900 won | No. The highest close of the past year. |
| August 14, 2026 (Fri) close | 58,300 won | No. The market I checked while writing. |
All five are quoted in won, on the same ordinary share, so ratios between them are meaningful. Every multiple in this piece comes from inside this table and nowhere else.
Contents
What SK Eternix stock cost on the day I checked
A word on which day, because it matters here. I wrote this in the early hours of Saturday, August 15, 2026, which is Liberation Day in Korea and not a session. So my reference price is the previous business day, Friday, August 14, 2026. On that day the shares opened at 57,800 won, traded as high as 58,800 and as low as 55,900, and closed at 58,300 won on volume of 3,847,623 shares.
The company is listed on the KOSPI, the senior board of the Korea Exchange. For readers used to US market structure, the closest analogy is the NYSE; a growth board would be the wrong picture. KOSPI carries the large industrial and financial names, while the KOSDAQ carries smaller and more speculative issues. Daily moves on either board are limited to plus or minus 30 percent, which is why one session in this chart looks like a wall.
| Item | Value | Basis |
|---|---|---|
| Close | 58,300 won (about 41 dollars) | August 14, 2026, KRX regular session |
| Shares outstanding | 34,066,895 | Kiwoom data, refreshed August 14, 2026 |
| Market capitalization | 1,986.1 billion won (about 1.40 billion dollars) | Product of the two rows above, my calculation |
| PER / PBR | 64.04x / 7.20x | Kiwoom trailing, same closing price |
| Against the highest close of the year | −27.94% | Versus 80,900 won on July 24, 2026, my calculation |
| Off the low that followed | +39.47% | Versus 41,800 won on July 30, 2026, my calculation |
| Dividend yield | 0.00% | Dividend per share of zero |
| Foreign ownership / margin balance | 4.47% / 2.88% | Kiwoom data, same reference date |
Why I did not print two different highs
My data screen shows a 250-session high of 87,700 won, which would put the shares 33.52 percent below the peak. But 87,700 is an intraday high from July 24, 2026, and the close that same day was 80,900. The table above is built entirely from closing prices, so I use the 27.94 percent figure in the body. Measuring from the intraday high is a legitimate method; mixing it into a table of closes is what I wanted to avoid, because a reader would reasonably assume both were measured the same way. The 5.6 percentage point gap between the two comes from one day of range in this name, and it tells me nothing about the business.
Where the 23,700 won figure comes from
On Friday, March 6, 2026, the acquisition of control by KKR was announced. Two existing holders sold their entire blocks.
- SK Discovery sold 10,455,825 shares, or 30.98 percent, for 247.8 billion won
- Hahn & Company, a Korean private equity firm, sold 4,225,455 shares, or 12.52 percent, for 100.1 billion won, exercising a tag-along right
- Combined: 14,681,280 shares, or 43.49 percent, for 347.9 billion won
The per-share figure falls out of that. Multiply 10,455,825 by 23,700 and you get 247.803 billion won. Multiply 4,225,455 by the same figure and you get 100.143 billion. Add them and you land on 347.946 billion, which matches the reported total. I lean on this more than I normally would on a press figure, because the per-share price is written nowhere. It only emerges if both sellers were paid identically, and the sum only closes under that assumption. So 23,700 won is the price of the transaction, not the price one party happened to accept.
Korean press reported the total as roughly 235 million dollars, converted at their own rate on their own date. My 245 million above uses my rate, stated at the end of this piece. I am flagging the difference so nobody reconciles two conversions that were never meant to agree.
One thing that refuses to close
The percentages do not reconcile against today’s share count. Divide 14,681,280 by the current 34,066,895 shares and you get 43.0954 percent, which is not 43.49. Working backwards, 30.98 percent implies a base of 33,750,242 shares, some 316,653 fewer than today. That could be a voting-share base excluding treasury stock, or the count could have grown since. I could not settle it in this session, so no argument in this piece rests on those 316,653 shares. Market capitalization uses today’s count only, and every ratio compares per-share figures with per-share figures.
The control premium on SK Eternix stock was negative
The coverage I read reported the 347.9 billion won and the 43.49 percent. What I wanted to know was how that per-share price compared with the market on the day. Control blocks normally clear above the screen price. That difference is the control premium, and it is one of the few places where you can watch a professional buyer state what an asset is worth to them.
The announcement was Friday, March 6, 2026. The previous session, Thursday, March 5, closed at 23,950 won. The transaction price was 23,700. The ratio is 0.98956. The block moved at a 1.04 percent discount to the last close.
I sat with that longer than with anything else here. Over the following five months, a meaningful share of this company’s re-rating has been attributed to the identity of its new owner. The stock jumped to 27,300 won on the day of the announcement itself and rose almost 30 percent in a single session on Thursday, March 12. And the buyer everyone was pricing in had declined to pay one won of premium.
Two readings are available. Either the sellers wanted out on a timetable, or the parties to the deal held a more conservative view of the asset than the market did. I found no basis to pick between them, and I am not going to invent one. What survives is narrower and, to me, more useful: the 58,300 won on my screen was set by people watching the transaction, while the 23,700 was set by people inside it. The distance between those two positions is 2.4599 times.
Two things that happened in July
On Wednesday, July 1, 2026, SK Inc. announced an investment agreement with KKR to build a combined Korean renewable energy platform, with KKR holding 51 percent and SK Inc. 49 percent. Press reports put the enterprise value of the vehicle at roughly 1.8 trillion won, about 1.27 billion dollars at my rate. The solar and power purchase agreement business of SK Innovation E&S, the fuel cell business of SK Ecoplant, and this company’s solar, wind and battery storage operations are all described as moving into it. Operating capacity of about 1.7 gigawatts is targeted to reach 10 gigawatts by 2031, and the platform is scheduled to launch by the end of 2026.
On Thursday, July 23, 2026, the shares closed limit-up, opening at 64,500 won and finishing at 80,600. A month earlier, on Tuesday, June 23, the close was 37,700. The reasons attached by the market were an expected overhaul of Korea’s renewable portfolio standard, firmer oil prices making renewables look relatively better, and the platform above.
Here is a comparison I deliberately declined to make. It is tempting to set the 1.8 trillion won platform valuation beside this company’s 1,986.1 billion won market capitalization and let the reader draw a conclusion. Those are different measures. One counts debt, the other counts only equity, and this company alone carried 1,134.8 billion won of liabilities at the end of the first quarter of 2026, roughly 800 million dollars. Placing two figures of different construction side by side is itself an argument, and it would be one I cannot support.
The two lines behind SK Eternix stock that moved apart
So much for prices. Now the company they are attached to. Everything below is DART consolidated data, and the quarterly figures are single quarters, separated out of the cumulative filings.
| Period | Revenue | Operating profit | Interest expense | Net income |
|---|---|---|---|---|
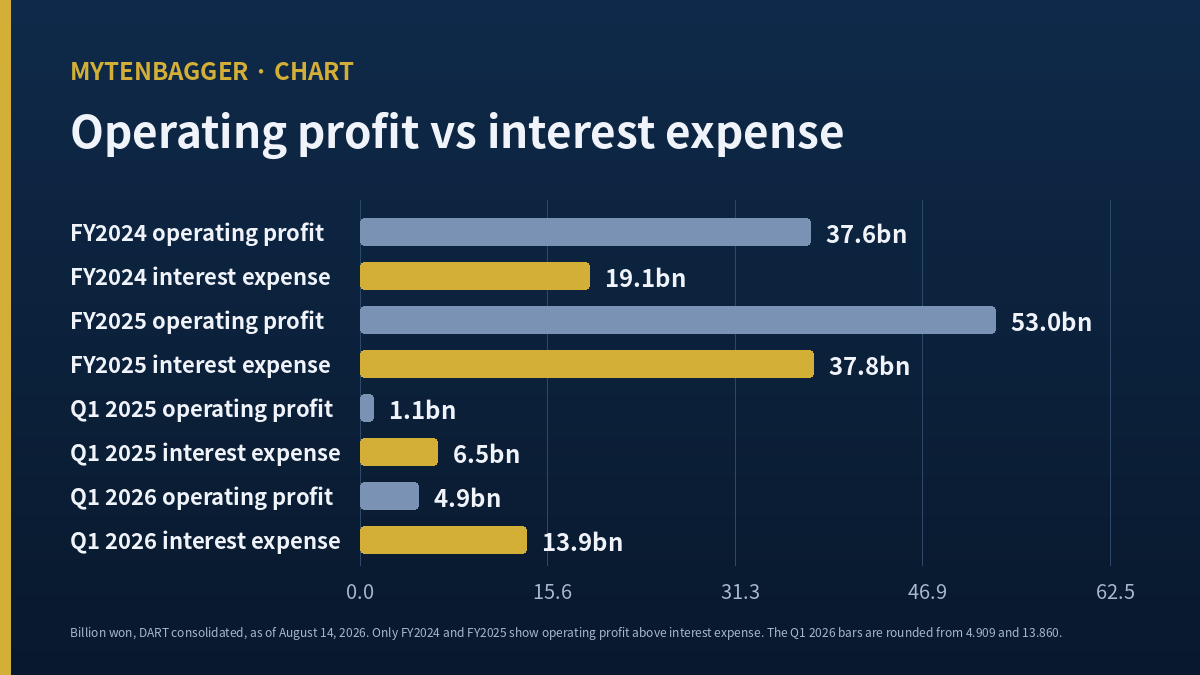
| FY2024 | 332.2bn won | 37.6bn | 19.1bn | 22.4bn |
| FY2025 | 385.6bn won | 53.0bn | 37.8bn | 30.7bn |
| Q1 2025 | 25.9bn won | 1.1bn | 6.5bn | 1.0bn |
| Q1 2026 | 27.5bn won | 4.909bn | 13.860bn | −5.1bn |
In the first quarter of 2026 the company earned 4.909 billion won at the operating line, about 3.5 million dollars, and paid 13.860 billion won of interest, about 9.8 million. The ratio is 0.3542. Operations covered a little over a third of the interest bill. The operating margin for that quarter was a respectable 17.84 percent, and the bottom line was a loss of 5.1 billion won.
One quarter can be seasonal, so I went to full years. In 2024 operating profit was 1.9702 times interest expense. In 2025 it was 1.4036 times. In the first quarter of 2026 it was 0.3542. Over that same stretch interest expense itself went from 19.1 billion won to 37.8 billion, a factor of 1.9765. Operating profit grew too, from 37.6 billion to 53.0 billion, a factor of 1.4082. Both lines rose. The interest line simply rose faster, and that is the whole of what I take from the table.
Why I only compared first quarters
Revenue at this company arrives in lumps. The fourth quarter of 2025 alone produced 248.0 billion won of revenue against 27.5 billion in the first quarter of 2026. Setting those two beside each other would show a decline of nearly 90 percent and would be a misreading of the business model. So I compared like quarters. Against the first quarter of 2025, revenue rose 6.13 percent and operating profit rose 362.24 percent. A quarter in which operating profit more than quadrupled still finished below zero at the bottom.
What I could not pin down about that line
The interest expense figure above is the account loaded under that label in my financial data. I did not open the notes to the first quarter 2026 filing to confirm whether it is a pure interest account or a bundled finance cost. If it is the latter, the coverage figure means something slightly different. So I used it only for direction, that coverage sits below one, and built no further derived measure on top of it.
The 400.8 billion won sitting in inventory
The other line that held me was inventory: 400.8 billion won at the end of the first quarter of 2026, about 282 million dollars. At the end of 2024 it was 59.2 billion. That is more than a sixfold increase, and it equals 14.56 times the revenue booked in that quarter.
Read as a manufacturer, those figures would be alarming. This business is closer to a developer that builds generation assets and sells them, and if projects under development are carried as inventory, a rising balance describes construction in progress. Unsold goods would be a different diagnosis. Operating cash flow in the quarter was negative 33.5 billion won while capital expenditure was 35 million won, which tells me money is leaving through something other than the fixed asset line.
I did not confirm the composition account by account. So the sentence stops at “this looks like project inventory” and does not extend to how many sites it covers or when it converts. That requires the notes in the half-year filing, and at my reference date the document does not exist yet.
What the sell side wrote down on SK Eternix stock
| Dated | Who published it | Level written down |
|---|---|---|
| May 15, 2026 (Fri) | Hana Securities | 60,000 won valuation |
| April 6, 2026 (Mon) | Alpha Distillery, Kang Ye-jin (independent research) | 65,000 won, opinion cut to Hold |
| July 23, 2026 (Thu) comments | DS Investment Securities, Ahn Ju-won / Shinyoung Securities, Park Se-ra | No level, directional comment only |
Measured against the August 14 close, the Hana level sits 2.92 percent above, and the Alpha Distillery level 11.49 percent above. Both were written three to four months ago, and in between the shares touched 80,900 won, fell to 41,800, and came back. What I actually read in this table is how stale these levels are, and how differently the same figure lands depending on when it was written. The 60,000 was set on a day the shares closed at 44,450. The 65,000 was published in a week the shares closed at 68,200, as part of an argument that the price had already run past it. The identical 65,000 was a caution then and looks like headroom now.
The weight of these sources differs and I want that on the record. Hana, DS and Shinyoung are named Korean brokerages. Alpha Distillery is an independent research platform, and I read a summary of that note and never opened the note itself. Its sharpest point, a comparison of about 30 times price to funds from operations against a global infrastructure peer average near 13 times, would strengthen my case considerably if it holds. Because I could not verify its construction, it supports nothing in the body of this piece and appears here only as a view that exists. Separately, I could not obtain the underlying 2026 revenue and operating profit estimates from any of the named brokerages. That entry is blank.
SK Eternix stock measured against the market and its sector
The window runs from August 14, 2025 to August 14, 2026, which is 244 trading sessions. The stock returned 149.68 percent. The KOSPI returned 116.33 percent. The energy equipment and services sector to which this name belongs, weighted equally with the stock itself removed, returned negative 9.77 percent. That is 33.35 percentage points ahead of the index and 159.45 percentage points ahead of the sector.
Decomposed, the sector effect was negative 126.10 percentage points and the stock effect positive 159.45. The two sum to the 33.35 points of excess over the market. The wind in this case was blowing backwards, and everything forward came from the name itself. It ranks third of 26 in its sector, where the median return was negative 32.56 percent, and it beat 23 of its peers.
The index itself had a violent year. The KOSPI fell from 9,114.55 on Monday, June 22 to 5,593.56 on Thursday, July 30, a decline of 38.63 percent, and recovered to 6,977.94 by August 14. This stock bottomed on the same July 30. That looks like shared weather until you check the statistics: beta of 0.618 and correlation of 0.281. These shares did not fall because the index fell. They moved on their own account and happened to bottom on the same day, which is the description the numbers actually support.
Eighteen things that weaken my own case on SK Eternix stock
The stronger my expectation, the longer this section gets. These are the items that argue against what I wrote above, and the first eight carry the most weight.
- The party that set my benchmark price owns 43.49 percent. KKR holds a block bought at 23,700 won that is now marked around 2.46 times higher. Any eventual exit puts that stock on the market. Once I use “the owner bought it cheaply” as support, the owner’s exit belongs in the same calculation.
- The 23,700 was not paid for the company as it stands today. The July 1 platform structure came after the March 6 deal, and how this company’s solar, wind and storage operations move into it has not been settled in a filing. A price set before the buyer redrew the board does not stay valid for long.
- There are no second quarter figures. The first quarter of 2026 was a net loss and the half-year results are not public at my reference date. Both of my anchor prices are historical and only earnings can fill the space between them.
- The 64.04 times earnings multiple contains a loss-making quarter. When a negative quarter enters trailing earnings, the multiple describes the measurement window more than the company.
- I never saw the composition of that 400.8 billion won of inventory. My reading of it as project development is unconfirmed at the account level.
- I could not fix the definition of the interest expense account. Pure interest or bundled finance cost changes what 0.3542 means.
- The 316,653 share discrepancy is unexplained. Treasury stock is one candidate, share issuance is another, and I tested neither.
- No forward estimates from the named brokerages. I have three houses, their names and their direction, and none of their 2026 numbers.
- My strongest counter-argument comes from my weakest source. The price to funds from operations point came from an independent summary whose derivation I could not check.
- The sector fell 9.77 percent while this name rose 149.68 percent. If 23 of 26 companies doing similar work did not participate, the move came from company events more than from the industry.
- The dividend is zero. Nothing accrues while waiting.
- Foreign ownership is 4.47 percent. That is low for a company whose controlling shareholder is a global private equity firm.
- The policy is not settled. Both the renewable portfolio standard revision and expanded power purchase agreements remain expectations.
- The volatility is extreme. From 80,900 won on Friday, July 24 to 41,800 won on Thursday, July 30 is four sessions.
- Liabilities dominate the balance sheet. Of 1,405.2 billion won of assets at the end of the first quarter of 2026, some 1,134.8 billion is debt, a ratio of 419.7 percent.
- My own finding is incomplete. I established that the block cleared below market, and I never established why. The fact holds and the cause does not.
- Revenue concentrates in the fourth quarter. A single quarter carried more than half of 2025 revenue, which makes quarterly ratios awkward.
- I did not open the primary filings. Every transaction figure here came from cross-checking secondary Korean coverage, and I read no ownership disclosure at source.
The comparison I made, and the one I refused
Readers of Korean industrial names usually want the global peer. For a renewable developer the reflex is to reach for NextEra Energy or Brookfield Renewable, and I did consider both. I am not putting their multiples beside this company’s, for the same reason as the last several pieces I have written: I could not establish that revenue recognition and asset carrying conventions are defined the same way across those filings, and a table that implies otherwise is worse than no table.
The comparison I did make is unusual, and it is the reason this piece exists. The relevant listed counterpart to this company is its own majority owner. KKR & Co. Inc. trades on the New York Stock Exchange. I raise it not to run numbers across them but because the ownership fact sets the terms of everything above.
Which leads to the access note. The unusual feature is the one above: the upstream owner is itself listed in New York, which means the only easily reachable exposure to this specific transaction runs through the buyer, and never through what was bought.
My position on SK Eternix stock and the two filings I will open
At 1,986.1 billion won of market capitalization this sits outside the largest hundred Korean listings, and outside that boundary my default is to watch. This piece is not a record of wanting to buy something. It is a record of measuring how far one disclosed price has drifted from the screen.
I am not hiding the expectation. An asset whose controlling stake changed hands without a premium, and which is marked 2.46 times higher five months later, holds my attention. For that interest to change my read, I need at least one quarter in which operating profit clears the interest bill. That quarter does not exist yet.
This piece also exposed something about my own routine. Until now I opened the financial statements first and treated ownership changes as background detail for the last paragraph. Putting the acquisition price at the front and the statements behind it made the same statements read differently, and for companies whose control has recently moved I intend to keep that order.
Two documents will move me:
- The 2026 half-year report. The line I want is interest expense. Whether the 13.860 billion won of the first quarter repeats, and whether that quarter’s operating profit clears it.
- Any filing on the combined platform. The moment there is a number attached to how this company’s solar, wind and storage operations are contributed, every multiple above needs rebuilding.
I will also write down what kills this comparison. If KKR or SK Inc. disclose a transaction that puts a fresh price on this asset, whether a contribution value, a further purchase or a partial sale, then 23,700 won becomes a stale figure. At that point I do not update the multiple. I discard the comparison entirely. A piece built on a single benchmark price stops being evidence and becomes a reflex the moment that price is superseded.
Prices, market capitalization and multiples reflect the August 14, 2026 close as checked at the time of writing. The Korean won is the reference currency throughout and dollar figures are approximate, converted at about 1,419.4 won per dollar, the Seoul close of August 13, 2026. I could not retrieve an August 14 rate in this session and chose to carry the previous confirmed one instead of delaying. Financial figures are DART consolidated; prices and ratios are Kiwoom data refreshed August 14, 2026; anything marked as my calculation was derived by me from two figures printed above.
Related reading and sources
Earlier entries from the same power and renewables cluster: whether Korea can actually build the 5 gigawatts of data center power it has announced covers the demand side this company is leaning on, while my journal on CS Wind and my entry on Doosan Fuel Cell are the two names in this space where I did take a view. My note on Samsung SDI was written in the same posture as this one, waiting on a quarter instead of a theme.
- Sisa Journal e, the structure and per-share price of KKR’s stake purchase (July 24, 2026)
- Global Economic, KKR’s acquisition announcement (covering the March 6, 2026 deal)
- Money Today, the SK and KKR renewable platform and its 10 gigawatt 2031 target (July 1, 2026)
- Financial News, how the shares doubled in a month during a falling market, with brokerage comments (July 23, 2026)
- Hana Securities report summary, on second-half earnings momentum (May 15, 2026)
- Korea Exchange disclosure system, first quarter 2026 report
- Alpha Distillery, summary of the Hold downgrade (April 6, 2026, independent research)
- SK Eternix corporate site
- KT Corp Q2 Earnings: Five Ways to Score One Korean Telco Quarter
- Korean Flex Circuit Maker BH Co: Profit Barely Covers Interest