Korea Line Earnings: Smallest Quarter, Best Operating Margin
I sorted seventeen quarters of Korea Line’s income statement twice before I formed any view on Korea Line stock. Once by revenue, smallest first. Once by operating margin, largest first. Both sorts put the same quarter at the top of the list.
That quarter is the first quarter of 2026. Revenue of KRW 277.80 billion (about $195.8 million) was the lowest of the seventeen. An operating margin of 26.80% was the highest of the seventeen. I did not expect one company to hold both records in one three-month window, so I went looking for what put them there.
Two sorts, seventeen quarters each (2022Q1 through 2026Q1)
| Rank | Smallest revenue | Highest operating margin |
|---|---|---|
| 1st | 2026Q1, KRW 277.80bn | 2026Q1, 26.80% |
| 2nd | 2025Q4, KRW 296.24bn | 2024Q1, 24.60% |
The second places sit in different quarters. Only the first places collide. Figures from the consolidated filings on Korea’s electronic disclosure system, single-quarter basis.
Contents
Korea Line stock, and where KOSPI puts it
Some housekeeping first, because this is a Korean listing and most readers of this journal are not looking at Seoul screens all day. Korea Line Corporation trades on the KOSPI under 005880. KOSPI is the senior board of the Korea Exchange, the one that carries Samsung Electronics and Hyundai Motor; the junior board, KOSDAQ, is where the smaller technology and biotech names sit. Korea Line closed at KRW 2,035 on Friday, 14 August 2026, which puts its market capitalization at KRW 656.8 billion, or roughly $463 million.
That is small. It is not, by Korean standards, a top-100 company by market value. I say that up front because it decides my posture before any of the numbers do, and I will come back to it at the end.
The company runs three lines. Liquefied natural gas carriers. Dry bulk. Tankers. Roughly 75% of revenue sits under long-term contracts, a figure that appears in the Sangsangin Investment and Securities note dated Thursday, 23 April 2026. Hold on to that 75%, because it explains both halves of this piece.
What actually sat inside Korea Line stock’s smallest quarter
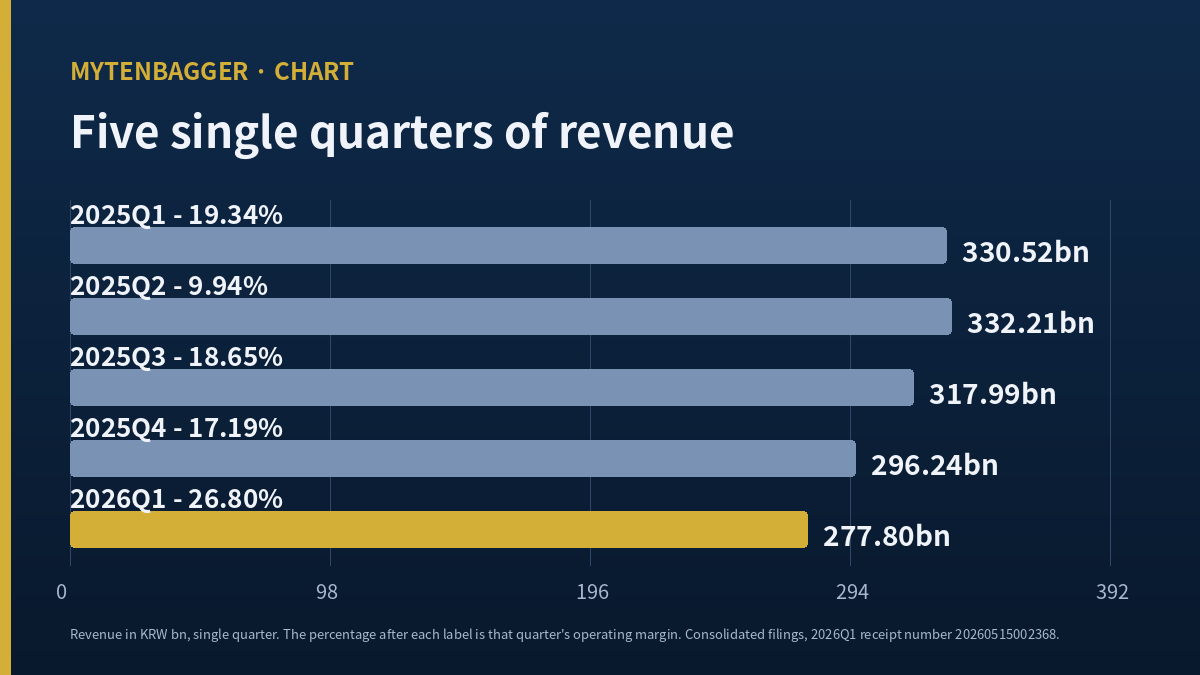
Set the quarter against the same quarter a year earlier and the shape gets clear.
| Single quarter | Revenue | Operating profit | Margin |
|---|---|---|---|
| 2025Q1 | KRW 330.52bn | KRW 63.91bn | 19.34% |
| 2025Q2 | KRW 332.21bn | KRW 33.04bn | 9.94% |
| 2025Q3 | KRW 317.99bn | KRW 59.31bn | 18.65% |
| 2025Q4 | KRW 296.24bn | KRW 50.91bn | 17.19% |
| 2026Q1 | KRW 277.80bn | KRW 74.45bn | 26.80% |
Revenue fell in three consecutive quarters. Operating profit went the other way in the fourth one. Against 2025Q1, revenue is down 15.95% and operating profit is up 16.49%, which moves the margin 7.46 percentage points.
One correction to my own framing, before anyone reads more into this than I do. KRW 74.45 billion of operating profit is the fourth largest of the seventeen quarters. It is not the largest. Third place, 2023Q3, sits KRW 0.09 billion above it. So the record here belongs to the margin and not to the profit. I want that separation on the page because a headline built on the profit figure would be wrong.
One third of revenue produced more than half the profit
Korean press covering the quarterly release on Monday, 18 May 2026 broke the segments out. The LNG line reported KRW 94.0 billion of revenue, up 12% on the year, and KRW 41.5 billion of operating profit, up 74%. Dry bulk reported KRW 129.4 billion of revenue. Tankers reported KRW 5.7 billion of operating profit.
33.84% of revenue delivered 55.75% of operating profit.
94.0 / 277.80 = 33.84%. 41.5 / 74.45 = 55.75%. Both derived. That segment carried a 44.15% operating margin on its own.
The second half of the answer comes from the balance sheet. Korean coverage summarised on Thursday, 9 April 2026 attributes the shrinking top line to sales of dry bulk vessels and a very large crude carrier. The company was not losing business. It was selling the assets that produced the lower-margin business. Take those out and what remains is weighted toward long-term LNG work, which is where the 44.15% came from.
I looked at the same containment-system economics from the other end when I wrote about the Korean supplier that builds LNG tank insulation under a French license. The conclusion rhymed: in this chain, the contract structure decides most of the margin, and the spot market moves only what the contract left uncovered.
Korea Line stock sits on a balance sheet that shrank on purpose
If the fleet was being sold, capital spending should show it. It does.
| Fiscal year | Revenue | Operating profit | Debt to equity | Capex | Free cash flow |
|---|---|---|---|---|---|
| 2022 | 1,612.0 | 267.7 | 151.68% | 546.2 | -153.9 |
| 2023 | 1,397.4 | 250.0 | 156.00% | 433.5 | -14.2 |
| 2024 | 1,747.2 | 328.6 | 100.04% | 48.5 | 518.7 |
| 2025 | 1,277.0 | 207.2 | 70.18% | 148.8 | 293.8 |
| 2026Q1 | 277.8 | 74.4 | 66.77% | 13.6 | 105.5 |
All amounts in KRW billion, consolidated, from the electronic disclosure system. The 2026Q1 filing receipt number is 20260515002368.
Read the capex column on its own. Across 2022 and 2023 the company spent KRW 979.7 billion, and free cash flow was negative in both years. Across 2024 and 2025 it spent KRW 197.3 billion, and free cash flow was strongly positive in both. The margin record arrived after the buying stopped.
Equity moved with it. Total equity went from KRW 1,630.4 billion at the end of 2022Q1 to KRW 2,602.9 billion at the end of 2026Q1, a rise of 59.65%. Total liabilities went the other way. The drop from 156.00% debt to equity in 2023 to 66.77% in 2026Q1 is both of those things happening at once, which is worth saying plainly because a falling ratio can also come from a shrinking denominator, and here it did not.
Because I once watched a company post steady profit while its operating cash went negative four times, I check the cash line separately now. In 2025 Korea Line generated KRW 442.6 billion of operating cash and KRW 293.8 billion of free cash flow. On 14 August 2026 the whole company was priced at KRW 656.8 billion. The market capitalization is 1.48 times one year of operating cash flow and 2.24 times one year of free cash flow.
The line that decides half of Korea Line stock’s target
Here is where the piece turns. Sangsangin Investment and Securities, in the note dated Thursday, 23 April 2026, prints its arithmetic instead of hiding it.
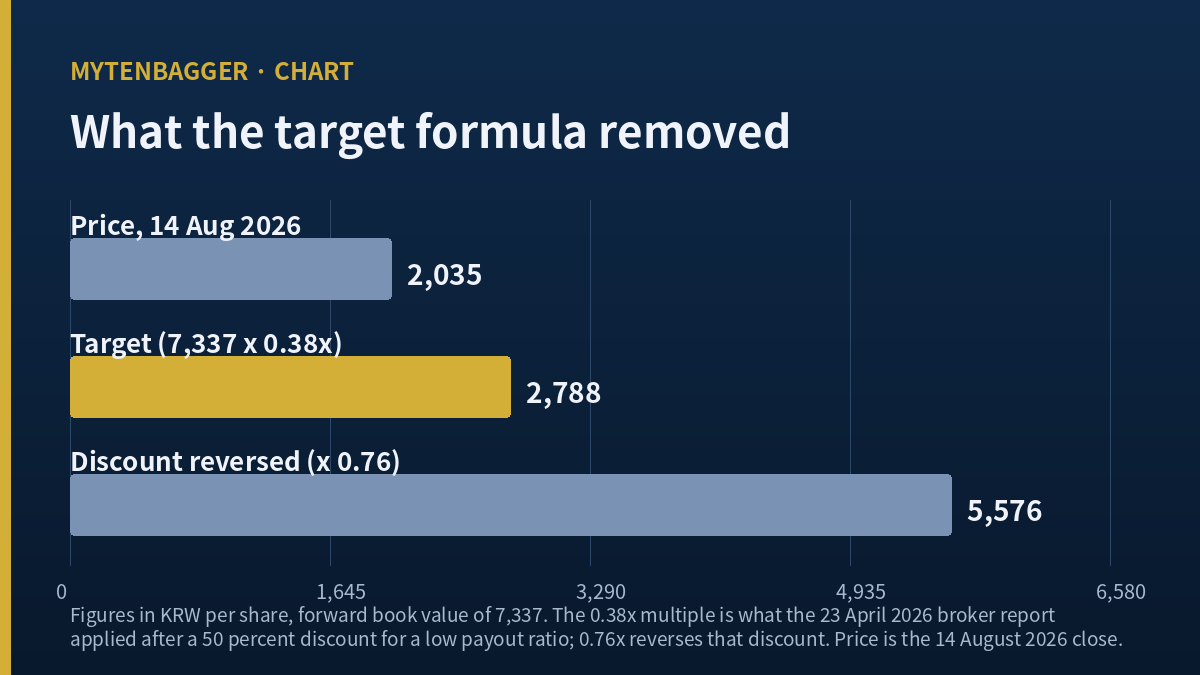
Twelve-month forward book value per share of KRW 7,337 multiplied by a target book multiple of 0.38x = KRW 2,788, published as KRW 2,800 (about $1.97).
The footnote beside the 0.38x reads, in the Korean original, as a 50% discount to global peers on account of a low payout ratio.
A 50% discount means half of some other multiple was used. Put the other half back and you get 0.76x. Against the same forward book value that produces KRW 5,576. The gap between the two is KRW 2,788.
Korea Line closed at KRW 2,035 on 14 August 2026. The amount that one payout line removed from the valuation is 37.01% larger than the entire share price. I have read a lot of Korean sell-side arithmetic and I do not remember another case where a single qualitative footnote outweighed the whole quote.
I want to be careful about what I am claiming. I am not adopting KRW 5,576 as a number I expect. The discount may be entirely correct; low payout is a real reason for a real haircut, and the company may never change its policy. What I am recording is narrower and, to me, more useful: the biggest single variable in this company’s valuation is not freight rates and not earnings. It is a policy document that has not been published.
Three places I looked for the payout ratio, and three blanks
- The market-data service I use returns no dividend per share, no yield, and no dividend history across the last three fiscal years. Its reason field says the item is undisclosed.
- The FnGuide-family company screen, checked on 14 August 2026, shows no dividend yield and no payout ratio.
- Korean coverage of a Hana Securities note dated Tuesday, 24 March 2026 was headlined, in effect, that earnings and balance-sheet health were fine and the dividend was the one item outstanding.
There is a raw payout figure of 51.2 sitting in one field of the data service, but with per-share dividend, yield and history all empty in the same response, I could not establish which fiscal year or which base it refers to. So I dropped it. That exclusion is routine for me. What is not routine is the consequence: in this company, the emptiness of that field is what sets the valuation multiple. Shinhan Securities and Investment made the same point from the other direction, describing the shares as priced such that even a modest shareholder-return measure could move them.
Four houses, four amounts, and the average I did not take
| Source | Amount | Versus KRW 2,035 |
|---|---|---|
| KB Securities, Kang Sung-jin (cited 9 April 2026) | KRW 2,200 | +8.11% |
| FnGuide-family screen, four contributing houses | KRW 2,650 | +30.22% |
| Sangsangin, Lee Seo-yeon (23 April 2026) | KRW 2,800 | +37.59% |
| Shinhan Securities and Investment, Choi Min-ki (cited 9 April 2026) | KRW 3,000 | +47.42% |
The spread between the highest and the lowest is KRW 800, which equals 39.31% of the closing price. The peer multiple each house started from is what splits them: Hana Securities described global dry bulk names trading up toward 0.9x book, Shinhan worked from a peer level of 0.75x, and Sangsangin applied 0.38x after its discount. The market, meanwhile, is paying 0.30x. The market is more conservative than the most conservative model on the list.
I deleted it. Two of the four are cited from an early-April summary, one is late April, and the screen figure carries an August date; averaging amounts published under different rate environments produces a number that describes nothing. So the table stays a table. I have made this mistake before in a piece where two forecasts for the same fiscal year differed by more than a factor of two, and the lesson there was the same one: when estimates disagree, the disagreement is the information, and flattening it throws the information away.
One screen I excluded outright. A Korean business daily’s quote page showed KRW 2,800 and a sell rating on 14 August 2026 but did not display how many houses contributed or when they last updated. An average with an unknown sample size cannot be checked, so it is not in my table, and I would rather say that than quietly use it.
Where the screen and the closing prices disagree
A short technical section, because the drawdown figure in this piece will not match the one on most screens and I would rather explain than have it look like sloppiness.
My data service reports a 250-session high of KRW 3,385, a low of KRW 1,639, and a drawdown from that high of 39.9%. Its own basis field describes those as adjusted closing extremes. I pulled 260 sessions of daily bars and counted.
| Measure | Amount | Session |
|---|---|---|
| Highest close | KRW 3,090 | Friday, 10 April 2026 |
| Highest intraday print | KRW 3,385 | Monday, 13 April 2026 |
| Lowest close | KRW 1,654 | Monday, 20 October 2025 |
| Lowest intraday print | KRW 1,639 | Monday, 13 October 2025 |
The two figures the screen publishes are intraday prints. The label says closing basis. Every derived percentage on that screen inherits the mismatch: 2,035 divided by 3,385 gives 60.12%, and the drawdown of 39.88% is what the screen rounds to 39.9%.
Computed on the same closing basis as the price in my tables, this stock is 34.14% below its closing high of KRW 3,090 and 21.13% above the closing low of KRW 1,680 recorded on Wednesday, 29 July 2026 after that high. A gap of 5.74 percentage points. I use the second set, because a drawdown a reader cannot recompute from the price I printed is worth nothing to them.
The label is the part I want to flag for myself as much as anyone. I read that basis field, believed it, and nearly published the 39.9% straight through. The mismatch only surfaced because I pulled the raw series and computed the closing maximum and the intraday maximum separately. Documentation described the fix; the data had not received it. I do not have a general rule to draw from that yet, other than the uncomfortable one: a field that describes its own method is still a claim, and claims get checked.
Korea Line stock against a peer that already writes the cheque
For the global comparison I used one screen only, and I picked it on a single criterion: a listed dry bulk operator that already does the thing whose absence is discounting this stock. That is Star Bulk Carriers, the Greece-based bulk owner listed on Nasdaq.
| Item | Korea Line | Star Bulk Carriers |
|---|---|---|
| Market capitalization | $463M | $3.24B |
| Revenue | $900M FY2025 |
$1.20B trailing twelve months |
| Dividend | none disclosed | $0.58 a year, 2.00% yield ex-date Friday, 21 August 2026 |
The line I keep coming back to is the ratio between the first two rows. Korea Line’s revenue is 75.01% of Star Bulk’s. Its market value is 14.29% of Star Bulk’s. The revenue ratio is 5.25 times the market-value ratio.
Now the part that cuts the other way, because a comparison with only one direction in it is advocacy. Star Bulk’s trailing net margin works out to 23.64%, derived from trailing earnings per share of $2.54 across 111.67 million shares against $1.20 billion of revenue. Korea Line’s 2025 net margin was 13.57%. Star Bulk also trades on a trailing price-to-earnings ratio of 11.43 while Korea Line screens at 3.64, though I explain below why I will not use that 3.64. The businesses are not the same shape either: one is a bulk pure-play, the other runs LNG, bulk and tankers together, and I did not open the notes to either set of accounts. So I capped the comparison at three items and built no multiple table. All Star Bulk figures were read at 4:00 PM US Eastern time on Friday, 14 August 2026, the same session as the Korean close used throughout this piece.
Numbers I left out of the bull case
- The 0.30x price-to-book. Book value per share of KRW 6,684 multiplied by the share count gives KRW 2,157.3 billion, while the 2026Q1 consolidated equity in the filings is KRW 2,602.9 billion. The KRW 445.6 billion difference could be minority interests or a different reference date, and I did not open the notes to settle it. I quote 0.30x above only to line it up beside the sell-side multiples, and I do not use it as an asset-value judgement.
- The 3.64x price-to-earnings. The data service states that its earnings per share was itself derived by dividing price by the ratio. Pairing the two would be circular, so I do not.
- A 16.06% free cash flow yield. It reproduces exactly, but the numerator is a single quarter of free cash flow over the full market capitalization. On a full-year basis the 2025 figure gives 44.73%, derived. Two different things wearing one label.
- Relative performance. Over the 244 sessions from 14 August 2025 to 14 August 2026 the stock returned 15.62% while the KOSPI returned 116.33% and the equal-weighted shipping sector, excluding this stock, returned -2.56%. It ranks third of eleven in that sector against a sector median of -3.85%. Losing badly to the index while beating the sector is a shape I have written about several times lately, so I record it and leave it out of the argument. One caveat worth knowing: a single constituent carries 80.63% of that sector by market value, which is why I use the equal-weighted, self-excluded version.
- A three-year revenue compound growth rate of -7.47%. The window contains vessel disposals, so it does not measure the operating business.
- Share count. My data service says 322,751,843 shares; the FnGuide-family screen says 322,747,340. A difference of 4,503 shares, or 0.0014%. The market-capitalization reconciliation matches the first to the won, so I used it, but I did not establish the cause.
Who is actually on the register
Foreign holders sit at 12.59% of the shares as of the 14 August 2026 screen. For a company this size that figure is the one ownership number I could verify against the register itself rather than infer, and it is the outcome rather than the mechanism, which is why I use it instead of the fund lookups that would only tell me how a holding could be wrapped.
Where I stand on Korea Line stock, and what breaks the case
At KRW 656.8 billion this sits outside the top 100 Korean companies by market value, and outside that band I watch. That is a line I drew for myself, and it applies here regardless of how the numbers read.
On top of the default, this company earns one addition to my rules.
When half of a company’s valuation rests on a policy that has not been published, I wait for the publication before I price it.
I am not waiting on earnings here. Earnings are out and they are fine. I am waiting on a document.
Two checkpoints, both dated.
- The 2026 half-year report. The statutory filing deadline fell on Friday, 14 August 2026, and I am writing on Sunday, 16 August 2026 without having confirmed whether it landed, since Saturday was both a weekend and Korea’s Liberation Day holiday. Two things in it matter: whether the first-half operating margin held near the 26.80% of 2026Q1, and whether capital spending started rising again. If capex is climbing, one of the two explanations I gave for the margin record stops working.
- A shareholder-return disclosure. The moment a payout ratio becomes a published number, the stated basis for that 0.38x changes. I cannot forecast where the multiple lands. I can confirm, from a single filing, whether the reason for halving it still exists.
And the falsifier, stated so I cannot wriggle out of it later. If the LNG segment’s share of operating profit falls from 55.75% while the total operating margin stays near 26.80%, my causal story is wrong. In that case the margin was built by something I have not identified, the fleet-mix explanation goes in the bin, and the middle of this piece needs rewriting and not merely updating.
Twenty-two on the other side
Everything below is either a fact that cuts against the case above or a gap I did not close. I split them in two: what has already happened, and what I failed to check. A piece with only one side is not a position, it is missing research.
Already happened (1 to 12)
- Full-year 2025 revenue fell 26.91% against 2024 and operating profit fell 36.96%. On an annual view this is contraction.
- Single-quarter revenue has now fallen three quarters running with no rebound quarter yet.
- 2026Q1 operating profit ranks fourth of seventeen quarters and does not rank first.
- Vessel disposals are a one-time source of the margin improvement. They cannot be repeated indefinitely.
- KB Securities moved from buy to hold in the April coverage, saying the price already reflected the oil and currency tailwinds.
- Sangsangin also cut its rating in the same month, citing a roughly 25% short-run run-up.
- A Korean business daily’s quote page displayed a sell rating on 14 August 2026.
- The 75% long-term-contract share limits the downside and limits the upside equally. Sangsangin said plainly that rising freight cannot be fully captured.
- No dividend policy has been disclosed as of this writing. Whether one arrives is not something I can predict.
- Over one year the stock trailed the KOSPI by 100.7 percentage points during a period when the index roughly doubled.
- The shares sit 34.14% below their closing high. Nothing in the data tells me this is the start of a recovery leg.
- Shipping is cyclical. A low debt ratio is not evidence of a cycle bottom, and the two are frequently unrelated.
Gaps I did not close (13 to 22)
- The raw payout figure of 51.2 in one data field remains unexplained.
- Book value per share multiplied by shares differs from consolidated equity by KRW 445.6 billion, cause unresolved.
- Earnings per share is derived from the price-to-earnings ratio, so the headline 3.64x cannot be read at face value.
- Korean outlets differed on whether the bulk and tanker segment changes were year-on-year or sequential, so I gave a year-on-year figure only for LNG and directions for the rest.
- The freight index moves cited by Sangsangin are first-quarter figures. I did not check where rates stand as of this writing.
- I did not review individual filings from the last ninety days. I worked from results coverage and broker notes.
- I did not confirm through individual filings whether any share-count event occurred in the last six months. I verified only that the split flag is off and that paid-in capital of KRW 161.4 billion divided by the KRW 500 par value reconciles to the share count.
- I did not establish whether any convertible or warrant-linked debt remains outstanding.
- I did not open the accounting notes for either company in the peer comparison, which is why it stops at three items.
- I did not examine the group ownership structure or related-party arrangements, so I cannot say how much of the contracted margin depends on affiliated counterparties.
Sources
- Korea’s electronic disclosure system, consolidated statements (2026Q1 receipt 20260515002368; FY2025 receipt 20260320001138)
- Korean logistics trade press, 2026Q1 segment results and the consensus comparison, Monday 18 May 2026
- Herald Business, LNG segment results and company comment, Monday 18 May 2026
- Daily Invest, Shinhan, KB and Hana positions summarised, Thursday 9 April 2026
- Newsquest, Sangsangin note and freight index moves, Thursday 23 April 2026
- Sangsangin Investment and Securities company report, the target build-up and discount footnote, Thursday 23 April 2026
- FnGuide-family company screen, contributing-house count, consensus amount and dividend fields, 14 August 2026
- Star Bulk Carriers quote page, peer figures read 4:00 PM US Eastern, Friday 14 August 2026
- Korea Line corporate site, business lines
Prices and multiples in this piece are taken from the Friday, 14 August 2026 close. I wrote it in the early hours of Sunday, 16 August 2026; Saturday was both a weekend and Korea’s Liberation Day holiday, so Friday is the most recent session. Publication may come later than writing, so live quotes can differ. The Korean won is the reference currency throughout and dollar figures are approximate, converted at KRW 1,418.6 to the dollar, which was the Seoul close on Thursday, 13 August 2026 per the KB foreign-exchange daily published 14 August. Note that the publication date, the rate’s own reference date and the price reference date are three consecutive days and not one. Figures I calculated myself, as opposed to figures read off a screen, are marked as derived.
- Pan Ocean Tanker Orders Ahead of a 2028 Delivery Wave
- POSCO Future M Forecast: Strong 2026 Estimates, Thin 2027 Data