Korean Chip Designer LX Semicon: Earnings and Its Product Mix
I opened LX Semicon stock expecting a cheap Korean chip designer and left with a product-mix problem instead. The company sells display driver chips, the parts that tell a panel which pixel to light. Forty-five percent of what it sells is large-panel drivers. In the June 2026 quarter, the two listed peers whose numbers I can read both grew somewhere else.
The same quarter, three designers, one shared line
| Company | Quarter ended | Where the quarter grew | Large panel drivers |
|---|---|---|---|
| Himax (Nasdaq: HIMX) | Jun 30, 2026 | Small and medium drivers +19.6%, non-driver +17.7% | $19.2m, down 21.0% in one quarter |
| Novatek (Taipei: 3034) | Jun 30, 2026 | System-on-chip past 50% of revenue for the first time | Not broken out separately |
| LX Semicon (KOSPI: 108320) | Jun 30, 2026 | Revenue $282.8m, up 6.0% on the year | 45% of total revenue |
Himax and Novatek figures come from each company’s own quarterly release. The LX Semicon mix figure comes from Korean press coverage of the July 24, 2026 (Friday) results. Won amounts are converted at roughly 1,418.3 won per dollar, the Seoul close on August 14, 2026 (Friday).
Contents
The screen I opened first, and what it cost me
My first pass at this company was a valuation screen. Price to book of 0.60 on the first screen I opened, a dividend yield of 3.61%, six of seven boxes ticked on the checklist I use, and a share price 36.83% below its own closing high from April 2026. I wrote “cheap” in my notes and moved on to the income statement to confirm it.
That order was the mistake. By starting from the multiple I spent an hour trying to work out which earnings number belonged underneath it, and only afterwards asked what the company actually sells and to whom. When I finally looked at the product mix, the mix answered the question the multiple had been raising. I have run screens before writing for long enough that I should have known the sequence matters. This time the cost was an hour and a first draft I threw away.
LX Semicon stock sits on five quarters that barely moved
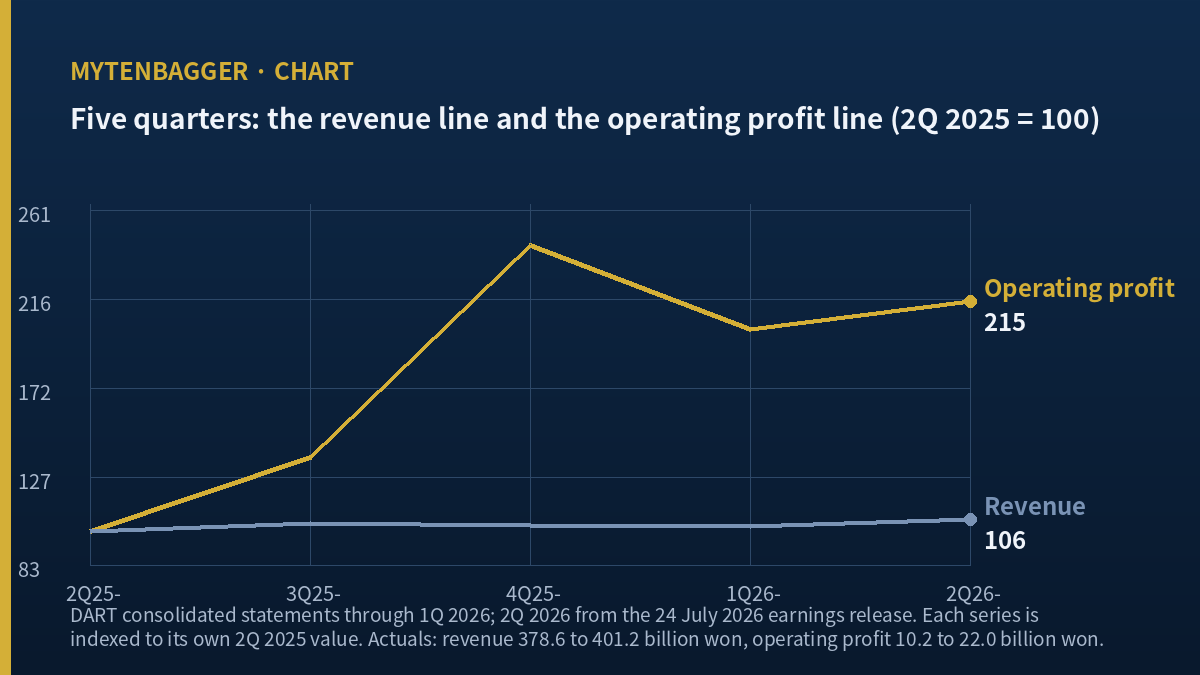
Before the mix, the outline. Korean listings report in won, and this company files consolidated statements with the Financial Supervisory Service. Over the five quarters from April 2025 through June 2026, quarterly revenue ran 378.6, 394.4, 389.8, 388.8 and 401.2 billion won. In dollars that is roughly $266.9m to $282.8m. The largest quarter divided by the smallest gives 1.0595.
Five straight quarters inside a 5.77% band around the average is unusual for a company whose customers are panel makers. Smartphone and television panel shipments swing hard by season. Whatever this company sells, the total keeps landing in the same place.
Zoom out and the picture changes sign. Fiscal 2022 revenue was 2,119.3 billion won, about $1.49bn at today’s rate. Fiscal 2025 was 1,639.1 billion won, roughly $1.156bn. That is 22.66% lower across those two fiscal years by my calculation. The recent flatness is not a recovery. It is the bottom of a slide, lying on its side.
The profit above that line moved 2.43 times
Operating profit over the same five quarters ran 10.2, 14.0, 24.9, 20.6 and 22.0 billion won, or about $7.2m to $17.6m. Best quarter divided by worst gives 2.4348 by my calculation. Set that beside the 1.0595 on the revenue line and the contrast is the entire company.
As margins: 2.70%, 3.56%, 6.39%, 5.30% and 5.49%. A spread of 3.69 percentage points on sales that hardly moved. Something other than volume is setting the outcome, and the candidates are product mix, foundry pricing and the won-dollar rate. I cannot separate them without the notes to the half-year report, which I have not read. The financial database I use listed the statutory filing deadline as August 15, 2026 (Saturday). I am writing before I have the document in hand and I am saying so instead of guessing at the split.
The half-year totals show the same asymmetry from the other direction. First-half 2026 revenue of 789.9 billion won was 7.59% below the prior-year half, while first-half operating profit of 42.6 billion won was 39.07% below it, both by my calculation. Revenue slips 7.6% and profit slips 39.1%. In the June quarter alone the signs flip: revenue up 6.0%, operating profit up 115.1%.
LX Semicon stock’s largest line is the one its peers shrank
Korean coverage of the July 24, 2026 (Friday) results put the end-market split at mobile 39%, television 28% and IT 27%, with large display drivers accounting for 45% of total revenue. That 45% is the number I kept coming back to.
Himax Technologies closed the same quarter on June 30, 2026 (Tuesday) with revenue of $227.4m. Inside that, small and medium display drivers came to $162.3m and rose 19.6% from the prior quarter, non-driver products came to $45.9m and rose 17.7%, and large display drivers came to $19.2m and fell 21.0%. One line down, everything else up.
Novatek Microelectronics closed the same quarter with consolidated revenue of NT$28.66bn and operating profit of NT$6.47bn, and told investors that system-on-chip products had passed half of revenue for the first time on artificial-intelligence demand. Novatek does not break out a large-panel driver line the way Himax does, so I am reading its growth by what it put first in its own release: the part of the business that is no longer a display driver.
Neither peer grew where LX Semicon is heaviest. Himax grew in automotive and in products that are not drivers at all. Novatek grew in system-on-chip. The one line that shrank at Himax by 21.0% in a single quarter is the line carrying 45% of this company’s sales. I think that is the most useful outside evidence for why five quarters of revenue keep landing in the same place, and it is also the reason I do not read the flatness as stability.
The LX Semicon stock comparison I decided not to build
I have three operating margins for the same June quarter sitting in my notes. I am not going to line them up in a table, for two reasons.
The first is that the three companies are not measuring the same thing. Himax reports under US GAAP and consolidates a business with a large non-driver segment. Novatek reports under Taiwanese standards with a system-on-chip business that is now the majority of revenue. LX Semicon reports consolidated Korean IFRS figures and the 45% mix number comes from press coverage instead of a segment table I have read. Putting three margins in one row implies a shared basis of measurement that does not exist.
The second reason is simpler. The piece I published immediately before this one was built on exactly that structure, a same-quarter margin table across three companies in one industry. Having the ingredients twice in a row is not a reason to serve the same dish twice in a row. So the peers appear here as a mix comparison and nothing else, and the margin I do quote is only this company’s own: 5.49% in the June quarter.
Two multiples on one LX Semicon stock close
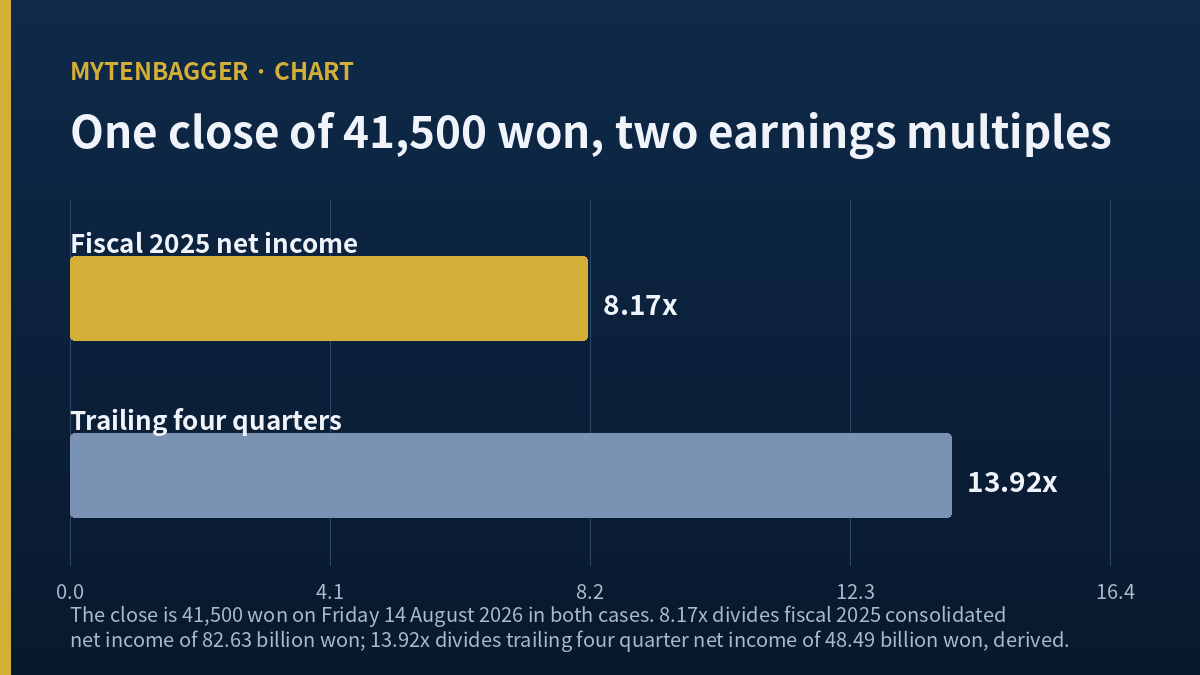
Here is where the flat revenue and the swinging profit collide with the valuation screen I started from. On the August 14, 2026 (Friday) close of 41,500 won, about $29.26, two data vendors show two different earnings multiples.
The first shows 8.17 with earnings per share of 5,081 won. Multiply 5,081 by the 16,265,060 shares outstanding and you get 82.6 billion won, which matches consolidated fiscal 2025 net income of 82.63 billion won, roughly $58.3m. So that 8.17 divides by one completed fiscal year of profit.
The second shows 13.92, alongside price to book of 0.61 and return on equity of 4.35%. Divide 41,500 by 13.92 and you get 2,981 won a share, which across the same share count implies net income of 48.49 billion won, about $34.2m, by my calculation. Divide that 48.49 billion by first-quarter 2026 equity of 1,113.8 billion won and you get 4.354%, which matches the 4.35% on the same screen. Two derived fields on one page point at the same profit figure, so I read that multiple as dividing by the trailing four quarters.
Both vendors are right. The gap between 8.17 and 13.92 is 5.75, a ratio of 1.7038 by my calculation, and it comes from the choice of window and nothing else. A company with flat sales and a 2.43 times profit swing produces a multiple that moves 70% when you slide the window by two quarters. That is the practical consequence of everything above.
One derived figure falls out of this. Subtract the third and fourth quarters of 2025 and the first quarter of 2026, at 10.1, 18.9 and 11.2 billion won of net income, from that 48.49 billion and the June quarter comes to roughly 8.3 billion won, about $5.9m. I could not find the company publishing that number, so I am marking it for what it is: a figure I reverse-engineered from two screens.
What the sell side wrote down for LX Semicon stock
Analyst Kim Jong-bae at Hyundai Motor Securities put a buy opinion and a 62,000 won valuation, about $43.71, into a March 20, 2026 (Friday) note. The same note carried 2026 estimates of 1,614.6 billion won in consolidated revenue, 2% lower than the prior year, and 100 billion won in operating profit, 8% lower. I did not read that note directly. I am working from Korean press coverage of it, and I am flagging that instead of presenting it as a document I opened.
By August 13, 2026 (Thursday), the consensus screen at the Korea Economic Daily showed an aggregate figure of 51,500 won, roughly $36.31, with expected earnings per share of 4,247 won. Between March and August the aggregate came down by 10,500 won, or 16.9% by my calculation. I do not adopt either figure as my own. I use the movement between them as a record of how the market re-rated this company over five months.
The expected earnings per share is the interesting part. Across 16,265,060 shares it implies net income of 69.08 billion won, about $48.7m. That sits below fiscal 2025 at 82.63 billion and above my reverse-engineered trailing figure of 48.49 billion. The sell side is putting this year somewhere between my two screens, which is a reasonable place to put it and also an admission that the window problem is real.
Cash held up while capital spending fell by two thirds
Operating cash flow in fiscal 2025 was 137.1 billion won, about $96.7m, or 1.66 times that year’s net income by my calculation. Capital spending was 19.6 billion won and free cash flow was 117.5 billion won.
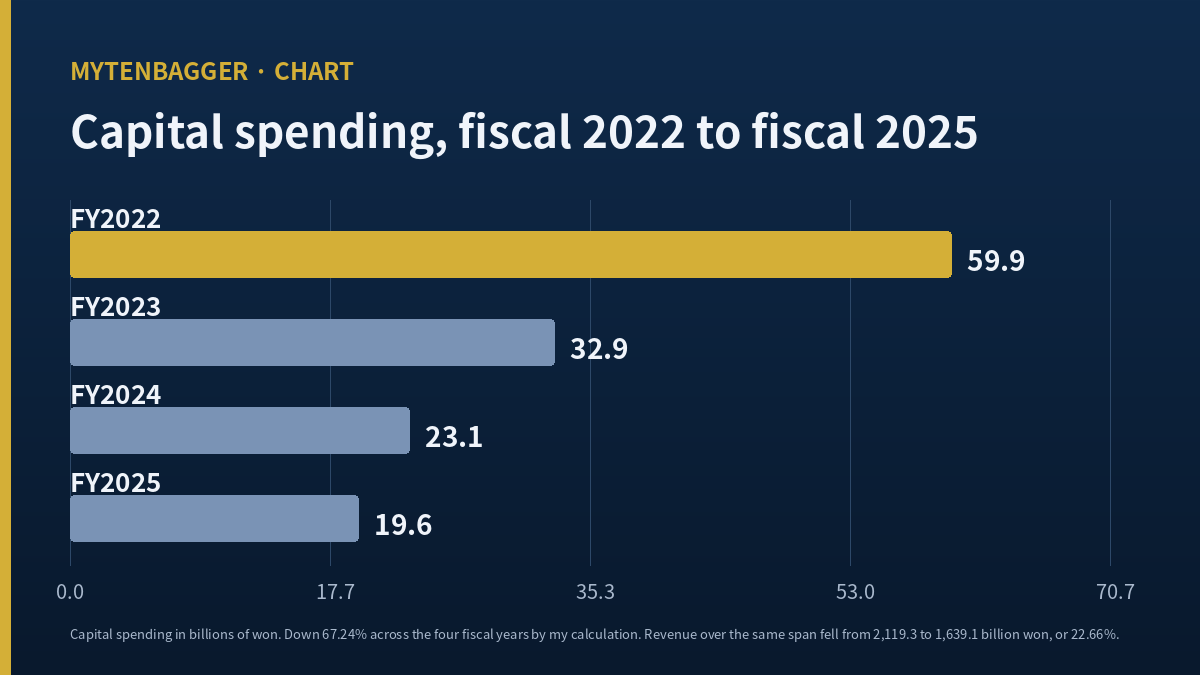
The capital spending trail is the part worth sitting with. Fiscal 2022 was 59.9 billion won, then 32.9, then 23.1, then 19.6 billion in fiscal 2025. That is 67.24% lower across those two fiscal years by my calculation. A fabless designer does not need fabs, so the number was never going to be large, but cutting it by two thirds while revenue falls 22.66% describes a company managing a decline where another would be funding a pivot. Novatek has already moved the bulk of its revenue somewhere else. This one has not, at least not by way of the capital account.
Four fiscal years of free cash flow add to 191.1 billion won, about $134.8m, against a market value of 675 billion won, roughly $475.9m. Equity at the end of the first quarter of 2026 was 1,113.8 billion won and total liabilities were 387.8 billion won, giving a debt ratio of 34.82%. The market value sits 438.8 billion won below the equity figure. Against that, interest expense of 12.2 billion won in the first quarter of 2026 covers only 1.69 times into that quarter’s 20.6 billion won of operating profit, which is low for a balance sheet this light, and I could not establish whether that line is borrowing cost alone or something broader.
The dividend is a good deal smaller than it was. Per-share payments were 5,400 won for fiscal 2021, then 4,500, 1,800, 2,400 and 1,500 won for fiscal 2025, so the path down has a step back up in it. That last payment is about $1.06, a 3.61% yield at the current price, and 29.53% of fiscal 2025 net income by my calculation. The yield is real cash. It is also 72.2% lower per share than the fiscal 2021 payment.
Twelve arguments against my reading of LX Semicon stock
Against the swing and the mix
- June-quarter operating profit of 22.0 billion won was 115.1% above the same quarter of 2025. Someone could call that a recovery instead of a swing.
- The worst of my five quarters is the first one. Drop it and the best-to-worst ratio falls to 1.775 by my calculation.
- There has not been an operating loss in the last seventeen quarters. The profit moves, but the sign does not.
- Quarterly profit variation in a seasonal supply chain is normal, and calling it a defect assumes a smoothness this industry does not offer.
- Himax’s 21.0% decline in large display drivers is one quarter against the prior quarter, at one company, and a single sequential move is thin evidence for a structural claim.
- The 45% mix figure comes from press coverage of an earnings briefing. I have not read it in a segment table filed by the company.
Against my own arithmetic and my conclusion
- The trailing net income of 48.49 billion won is reverse-engineered from two vendor fields. If either field uses an equity base different from mine, the match that supports it is a coincidence.
- The June-quarter operating profit is a press figure from the results release. I have not reconciled it to a filed statement.
- The five quarterly margins are mine, computed by dividing two reported lines, and the company may present the ratio on a different basis.
- I quoted an interest coverage of 1.69 without establishing what is inside the interest line.
- Price to book of 0.61 with three consecutive years of positive free cash flow from fiscal 2023 is a genuine argument that the price already carries this problem.
- Six of seven boxes pass on the checklist I use, for a score of 86. The one that failed was return on equity at 7.5%.
Number seven is the one that would hurt most. The core of this piece is a profit figure no company ever published, held up by the fact that two derived fields on one page agree with each other. A company whose reported loss grew for accounting reasons and not for trading ones taught me to spend more time on screens that agree, never less.
Figures I left out, and where this leaves me
The one-year benchmark decomposition
Over 244 sessions to August 14, 2026 (Friday) the shares fell 26.68% while the Korean market index rose 116.33% and the display equipment and components sector index rose 6.32%. My tool splits that gap into a sector part and a company part. I published a piece built on that split recently, so this one stops at the raw numbers.
The three-year revenue growth rate
A negative 8.21% figure sits on the screen, anchored to a 2022 base that was an abnormal year for this industry.
Two payout ratios
The same screen carries 29.5% and 66.9%. The first matches my own calculation. I could not establish what the second divides by, so I dropped both from the argument.
One check that did hold
41,500 won times 16,265,060 shares is 674,999,990,000 won, which lands within 10,000 won of the 675 billion market value on the screen. Share count and price share a reference date, so I hung the rest of the arithmetic on that.
Where all of this leaves me
A market value of $475.9m puts the company outside the top hundred Korean listings, and outside that hundred my default posture is to watch. Here the size is beside the point. The reason I am watching is that 45% of the revenue sits in the one product line that two comparable designers grew away from in the same three months.
Here is the condition that would tell me I read it wrong. If operating profit in both the third and fourth quarters of 2026 comes in above 20 billion won, with both quarterly margins at or above 5% and within one percentage point of each other, then treating this profit stream as a swing was a mistake. A level test alone could be cleared by one good quarter, so I attached an evenness test to it. Two quarters standing at the same height would turn flat revenue from a symptom into a base.
Until then this is a company I am waiting on a document for. The segment disclosure and the finance-cost notes in the half-year report would settle most of what I could not settle today. Having recently looked at a business with steady profit and unsteady cash, one that traded per-share profit for a lighter balance sheet, and one where a single quarter outran an entire prior year, I have stopped building a view on the profit line by itself. The line above it and the line beneath it keep turning out to matter more.
The last comparison I will make is with a food company whose input costs arrive on a delay. There the lag was the whole explanation and it was knowable from the outside. Here the equivalent lag would be the mix shift, and from the outside I can see only that peers have already moved and this one has not said whether it is moving.
Prices and multiples reflect the August 14, 2026 (Friday) close as checked at the time of writing. Korean markets were shut for Liberation Day on August 15, 2026 (Saturday) and for the substitute holiday on August 17, 2026 (Monday), so the last trading session before this piece was August 14. This article publishes on a schedule, so the figures can differ from live quotes. Korean won is the reference currency throughout and dollar amounts are approximate, converted at roughly 1,418.3 won per dollar on that same date. Taiwan dollar and US dollar figures from Himax and Novatek are quoted in the currency each company reported. Financial statement figures come from consolidated filings with the Financial Supervisory Service; price and ratio data come from Kiwoom Securities data as of August 14, 2026.
Sources: Himax second quarter 2026 results · Novatek second quarter 2026 results summary · Seoul Economic Daily on the June quarter · CBC News results bulletin · Korea Economic Daily consensus screen · Korean press coverage of the Hyundai Motor Securities note · Korean electronic disclosure system · Valueline company summary