YC 232140 Memory Wafer Tester: Why Shares Fell With the Sector
On July 30, 2026, a Thursday, three things I track hit their twelve-month low on the same date. One was YC stock (KOSDAQ: 232140), a Korean maker of memory wafer testers. The second was the KOSDAQ index itself. The third was the synthetic index for the semiconductor and semiconductor equipment sector that this company sits inside.
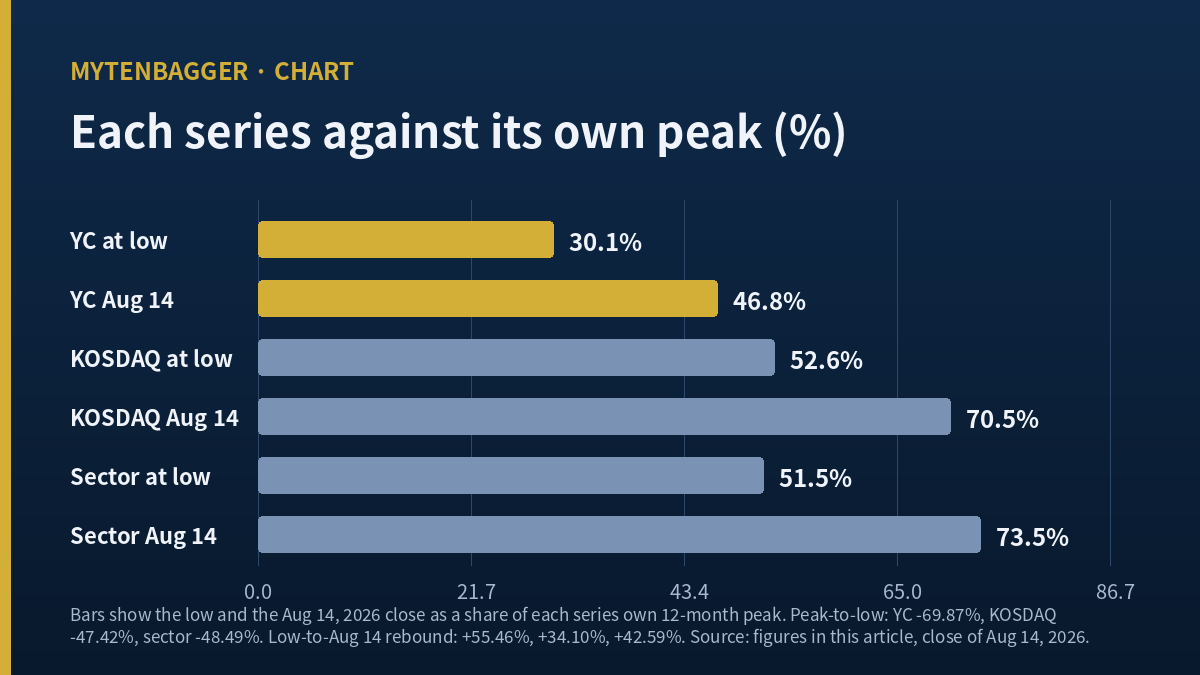
They fell together and they bottomed together. What separated afterward was how far each climbed back. By the August 14 close, the index had returned to 70.5 percent of its own peak and the sector to 73.5 percent. This company sat at 46.8 percent of its peak, the only one of the three still under half.
Here is the part I had to sit with. Measured from the low instead of the peak, this stock rose 55.46 percent while the index rose 34.10 percent and the sector 42.59 percent. It bounced the hardest and it recovered the least, and both of those sentences are true because of the same fact.
Contents
Where YC stock trades, and what the sector line is made of
KOSDAQ is South Korea’s secondary exchange, the venue for smaller and technology-weighted listings, and it sits alongside the larger KOSPI board where Samsung Electronics and the other household names trade. A Korean semiconductor supplier of this size almost always lists on KOSDAQ instead of KOSPI, so the relevant benchmark for a company like this is the KOSDAQ index and not the headline Korean market number an American reader is more likely to see quoted.
The sector line I use is not an exchange product. The tool I pull from builds it by equal-weighting the 159 semiconductor and semiconductor equipment names that traded the full window, and it removes the subject company from its own group so the comparison is not partly against itself. That construction matters for what follows, and I come back to it when I list what could make me wrong.
YC stock and two benchmarks, on the same 244 trading days
| Series | Peak | Low | Peak to low | Low to Aug 14 | Aug 14 as % of peak |
|---|---|---|---|---|---|
| YC | May 6, 2026 | Jul 30, 2026 | −69.87% | +55.46% | 46.8% |
| KOSDAQ index | Apr 27, 2026 | Jul 30, 2026 | −47.42% | +34.10% | 70.5% |
| Semiconductor sector | May 26, 2026 | Jul 30, 2026 | −48.49% | +42.59% | 73.5% |
Closing prices, Kiwoom daily bars adjusted for corporate actions, 244 trading days ending August 14, 2026. The low is searched only in the span after each series set its own peak, which is why the peak dates differ while the low date does not. The last column is my own division of the August 14 level by the peak level.
The share price itself: a peak of 23,700 won (about $16.71), a low of 7,140 won (about $5.03), and an August 14 close of 11,100 won (about $7.83). At that close the company carries a market value near 910.7 billion won, roughly $642 million, which puts it well outside Korea’s hundred largest listings.
The falling part of YC stock was not about this company
Three separate series printing their low on one identical date is not a coincidence I can attribute to anything company-specific. The KOSDAQ index lost 47.42 percent from its own April peak to that July 30 close. When the whole board halves, a single name going down with it is telling me about the board.
The twelve-month picture is where the company’s own contribution shows up. Over the year to August 14, this stock returned negative 3.98 percent. The KOSDAQ index returned positive 6.06 percent. The equal-weighted sector returned positive 68.40 percent. Against that sector, the stock underperformed by 72.38 percentage points, which the tool grades as a decisive loss.
Ranked inside its own sector list, it placed 113th of the 159 names that traded the full window. The median name in that group returned 27.73 percent. Forty-six names finished below it. This is a semiconductor equipment company that spent a year in the bottom third of semiconductor equipment.
YC stock has been leading the sector for a month
Then the short window points the other way. Over the last five trading days the stock rose 20.65 percent against the sector’s 13.61 percent. Over twenty trading days it rose 11.22 percent against 5.85 percent. The close sits 18.39 percent above its own twenty-day moving average and 32.07 percent below the 120-day one.
The tool flags the five-day and twenty-day gaps as idiosyncratic, meaning the stock is moving on something other than the sector’s weather. Its beta against the market measures 1.395 with a correlation of 0.817, so it is a high-amplitude name in both directions and I should expect it to overshoot on the way back as it did on the way down.
Two windows, two directions. That is the honest state of it, and I would rather write that down than pick the window that suits a conclusion. When I looked at Hanon Systems and the way two brokerages read the same quarter 27 percent apart, the lesson was the same one from a different angle.
What the company sells, and to whom
YC makes memory wafer testers. These are the machines that check every die on a finished wafer before it is cut, a step the Korean industry calls EDS test. The company was named Y.I.K. until it rebranded, and it has co-developed inspection equipment with Samsung Electronics since 2001.
Customer concentration here is not a risk factor buried in a filing. It is the business. On July 13, 2026, ZDNet Korea reported that this company disclosed three wafer tester supply contracts with Samsung Electronics in the first half of 2026, totaling 174.6 billion won, roughly $123 million. Set against 2025 consolidated revenue of 272.6 billion won, about $192 million, those six months of orders equal 64.04 percent of a full prior year.
I verified two of the three contracts against individual disclosure coverage. A 40.3 billion won contract ($28.4 million) was disclosed on March 4, 2026, running from March 3 to June 30. A 42.16 billion won contract ($29.7 million) was disclosed on April 13, 2026, running from April 10 to December 31, described as an MT6133 LPE-B upgrade. Those two total 82.46 billion won, or 47.23 percent of the reported half-year figure. I did not locate individual coverage of the third contract, so I am not going to describe its terms.
The same demand, arriving at different times
The obvious American comparison is Teradyne (NASDAQ: TER), which builds test equipment for the same industry. In its second quarter of 2026 Teradyne reported revenue of $1.33 billion, up 104 percent year on year, with the semiconductor test segment up 128 percent on DRAM strength and a return of NAND final test demand. Its first quarter was up 87 percent. Both companies are describing the same underlying demand.
I am not going to put the two in a comparison table, and the reason is the quarter. Teradyne’s most recent reported period is its second quarter of 2026. This company’s most recent reported period is its first quarter, because its Korean half-year filing deadline fell on Saturday, August 15, was pushed by the Liberation Day holiday and the substitute holiday that followed, and lands on Tuesday, August 18. I have not read that document. Comparing a US second quarter against a Korean first quarter would look like a finding and would only be an artifact of the reporting cycle.
What I will say is the direction. In its first quarter of 2026 this company’s revenue fell 14.50 percent from the same quarter a year earlier. Teradyne’s revenue in its own first quarter rose 87 percent. Whatever wave the American company is riding, this one had not caught it as of the last period either of them has published in common.
YC stock rests on a quarter that is hard to read
| Standalone quarter | Revenue | Operating profit | Operating margin | Operating cash flow | Inventory |
|---|---|---|---|---|---|
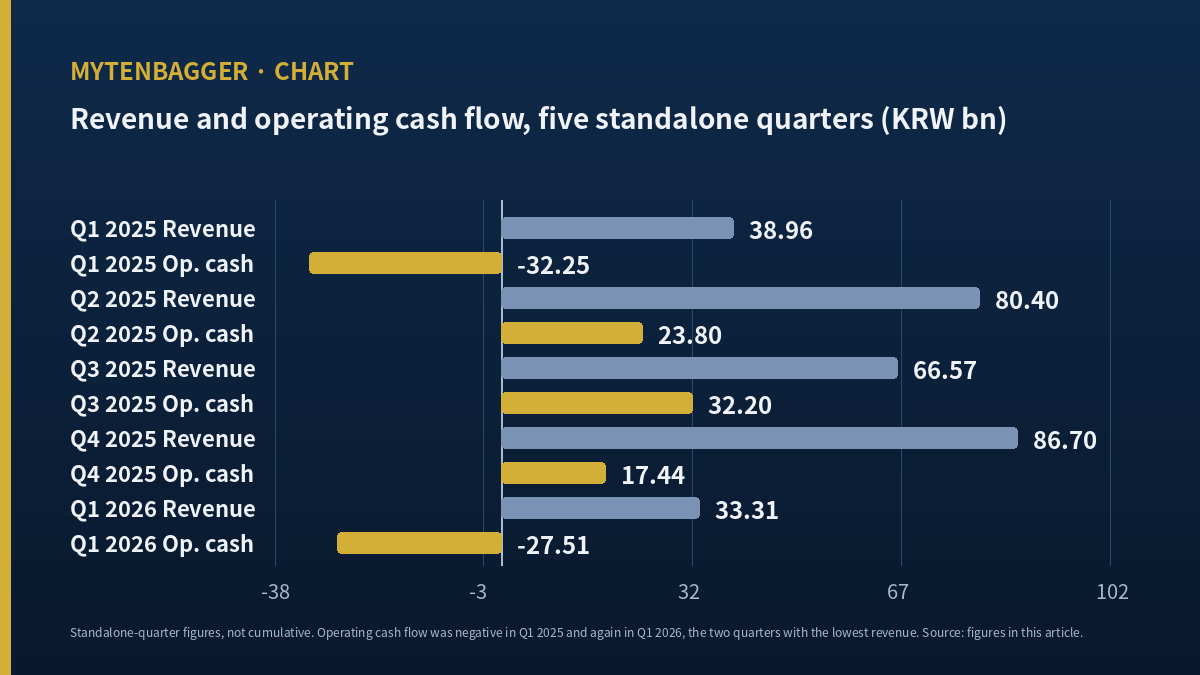
| Q1 2025 | 38.96bn | −1.51bn | −3.87% | −32.25bn | 170.01bn |
| Q2 2025 | 80.40bn | 4.37bn | 5.43% | +23.80bn | 141.49bn |
| Q3 2025 | 66.57bn | 4.89bn | 7.34% | +32.20bn | 117.25bn |
| Q4 2025 | 86.70bn | 9.24bn | 10.66% | +17.44bn | 83.88bn |
| Q1 2026 | 33.31bn | 3.99bn | 11.99% | −27.51bn | 139.27bn |
Korean won, billions, consolidated, from the electronic disclosure system. Korean quarterly flow items are filed cumulatively, so I reversed them into standalone quarters; the fourth quarter is the annual figure less the nine-month cumulative. Inventory is a period-end balance and needs no reversal. Margins are my own division of each row’s operating profit by the same row’s revenue. At 1,418.3 won per dollar, Q1 2026 revenue is about $23.5 million and the operating cash outflow about $19.4 million.
Lowest revenue of nine quarters, second-highest margin
First quarter revenue of 33.31 billion won is the smallest of the nine standalone quarters I can reconstruct, running from the first quarter of 2024 through the first quarter of 2026. The operating margin of 11.99 percent is the second highest of those same nine. The highest was 15.37 percent in the second quarter of 2024. A year earlier this quarter had been a 3.87 percent operating loss, so it also marks a return to profit.
Less shipped, better margin on what shipped. On its own that combination is not a warning. The warning, if there is one, is on the cash line.
Profit positive, cash negative, inventory large
Operating cash flow was negative 27.51 billion won in a quarter that produced 6.46 billion won of consolidated net income. Subtract 4.85 billion won of capital expenditure and free cash flow lands at negative 32.37 billion won. Period-end inventory stood at 139.27 billion won, about $98 million, which is 380.4 days of that quarter’s revenue by my own calculation.
Two rankings keep me from calling either figure extreme. That 380.4 days is the second longest of the nine quarters, behind 397.1 days in the first quarter of 2025. The inventory balance itself is only the third largest. The first and second quarters of 2025 both carried more.
The tempting reading is that first-half orders are sitting in that inventory line waiting to convert. It is plausible and I cannot confirm it, because I did not open the inventory breakdown that splits raw materials from work in progress from finished goods. What I confirmed is the size of the balance and the direction of the cash. Everything past that is inference and I am labeling it as such. I ran into the same wall from the opposite side with KEPCO KPS, which earned an operating profit in every one of seventeen quarters while its cash went negative four times.
The first quarter looks like this every year
Widen the table and a pattern appears. First quarter 2024 produced 33.95 billion won of revenue and 0.34 billion won of operating cash. First quarter 2025 produced 38.96 billion and negative 32.25 billion. First quarter 2026 produced 33.31 billion and negative 27.51 billion. In all three years the first quarter carried the year’s weakest revenue and the year’s worst operating cash.
So reading this quarter as an event instead of a season would be my mistake to make. I am writing it down here and not in the counterarguments section because it changes how the two paragraphs above should be read, and not only whether they convince.
What four houses wrote about YC stock, and when
Four named Korean brokerages carry a valuation on this company, and the screen consensus is 22,750 won, about $16.04. I checked where that came from. Hanwha Investment opened coverage at 25,000 won on May 15, Shinhan Investment carried 24,000 won on June 9, Hyundai Motor Securities carried 19,000 won on June 19, and Korea Investment carried 23,000 won on July 14. Those four sum to 91,000 and divide to exactly 22,750, so the consensus is a plain average of the four and nothing else.
Every one of those four dates precedes July 30. The most recent of them is sixteen days ahead of the low. I searched two Korean consensus screens for anything carrying a later date and found none, which is not proof that none exists, only that the public screens I can reach had not been updated as of August 14.
I read the full text of one of the four. Hanwha’s May 15 note describes the company as the main vendor of wafer testers for HBM, DRAM and NAND, with a long-held dominant position at its domestic customer, and models 2026 revenue of 354.0 billion won with 54.1 billion won of operating profit and earnings of 494 won per share. The same note discloses its own risk: two previously announced order tranches, 29.45 billion won from June 2025 and 38.75 billion won from December 2025, each slipped by a quarter. For the other three I have the house name, the figure, the rating and the date from a screen, and nothing more.
I am reporting these four as facts about what other people published. I am not adopting any of them, and the gap between 22,750 won and 11,100 won is not something I am treating as room to run, because a valuation written before a 69.87 percent decline and a price measured after it are not observations from the same moment.
Three ways this reading fails
Ordered with the one I find hardest to answer first.
One. The sector index I leaned on is something the tool built and something the market does not trade. My central observation is that this stock sits at 46.8 percent of its peak while its sector sits at 73.5 percent. That sector number comes from equal-weighting 159 names and excluding this one. Change the weighting to market capitalization and the sector return over the year reads 327.32 percent instead of 68.40 percent, which would make the underperformance look four times worse. Change the constituent list and both numbers move again. The percentile rank of 113th out of 159 survives any weighting scheme, so that is the piece of this I would keep if I had to throw the rest away.
Two. The recovery may already be underway. Five-day and twenty-day returns both beat the sector, and the close sits 18.39 percent above its twenty-day average. If that continues, the phrase “46.8 percent of peak” ages within a session. Tuesday, August 18 is the first trading day after a three-session market closure in Korea, which makes a large single-day move more likely than usual.
Three. The quarter I built this on is the company’s weakest season, and the orders have not landed yet. Three consecutive years show the same first-quarter profile, so treating this one as a signal is exactly the error the pattern warns against. Meanwhile 174.6 billion won of first-half orders exist and have not yet appeared as revenue. If they convert across the second half, the four valuations written before the low will look early instead of stale, and this entire piece will read as a note written one quarter too soon.
Where I stand on YC stock and what would break it
On the seven-metric checklist I run, this scores five of seven, or 71 points. Revenue scale, operating margin of 6.24 percent, positive earnings per share of 235 won, a price-to-book ratio of 2.47 against the 3.0 threshold I use for semiconductor names, and a positive operating profit all clear. Return on equity of 5.6 percent and a price-to-earnings ratio of 47.22 do not. Debt to equity is a comfortable 30.73 percent.
One detail worth flagging on those per-share figures. Earnings of 235 won multiplied by the 82,045,045 shares outstanding gives 19.28 billion won, which matches the 19.29 billion won of 2025 net income attributable to owners of the parent, and not the 28.98 billion won consolidated total. So 33.45 percent of the 2025 consolidated profit belongs to minority holders, and in the first quarter of 2026 that share rose to 80.82 percent, leaving 1.24 billion won attributable to the parent’s owners out of 6.46 billion won consolidated. Any screen ratio here is a parent-only ratio sitting on top of a consolidated business.
What would break this reading: if one sector name of comparable size publishes a first-half report showing the same order-to-revenue lag and the same negative first-quarter cash, then the pattern I am attributing to this company is an industry timing effect and my comparison against the sector was measuring the wrong thing all along. In that case the 46.8 percent figure is not evidence about this business, and I would need to rebuild the argument from the order book instead of the price series. I would rather find that out from someone else’s filing than from my own position.
KCTech’s two 2026 forecasts, which differed by a factor of 2.3
The date on my own numbers
I spent this piece pointing at the dates attached to other people’s figures. The same test applies here. Every price in this article is the August 14, 2026 close, checked in the early hours of August 18 with the Korean market not yet open. The 46.8 percent, the 55.46 percent, the 380.4 days: each one is a photograph of a single session, and the first tick on Tuesday starts making them wrong.
That is not a caveat I am adding to be safe. It is the same observation the article is built on, turned around to face me. If a valuation written on May 15 stopped being usable by July 30, then a drawdown measured on August 14 has a shelf life too, and the honest thing is to stamp the date on it instead of hoping nobody checks.
Prices and multiples reflect the August 14, 2026 close, checked at the time of writing on August 18, 2026 before the Korean open; August 15, 16 and 17 were market holidays, so August 14 remains the prior trading session. The Korean won is the reference currency throughout and dollar figures are approximate conversions at roughly 1,418.3 won per dollar on the same date. Financial statements are consolidated, from the Korean electronic disclosure system; index and sector comparisons use Kiwoom daily bars and a synthetic equal-weighted sector index.
Sources consulted: WiseReport company profile · WiseReport shareholder register · Hankyung consensus screen · ZDNet Korea on test equipment orders, July 13, 2026 · DigitalToday on the April contract · Asia Economy on the March contract · TheElec on wafer tester supply · Futurum on Teradyne’s second quarter
- Korea’s ISTE Earnings Came In at Half Its IPO Forecast Twice
- Why SK Hynix Fell 12.5% After Becoming Korea’s Largest Company