Korea’s ISTE Earnings Came In at Half Its IPO Forecast Twice
I keep a rule for small companies that nobody covers, and it is a plain one. Before I judge whether the market has this wrong, I go looking for whatever forward numbers exist, and I check who wrote them. For ISTE stock, a Korean semiconductor equipment maker listed as 212710, the search ended in an odd place. The only forward projections I could find anywhere were written by the company itself, inside the filing it submitted to get listed in the first place. Nobody has published a competing set since.
Three numbers and one ratio each
| 2025 revenue: filed projection vs actual | KRW 68.8bn vs KRW 32.22bn, or 46.83% |
| 2026 operating profit: filed vs broker estimate | KRW 18.9bn vs KRW 9.0bn, or 47.62% |
| Share price vs offer price | KRW 8,200 vs KRW 11,400, or 71.93% |
Prices as of the August 18, 2026 close. Won figures are the primary ones here and the dollar equivalents are approximate.
Contents
The only forward numbers for ISTE stock were written to get the company listed
The company came to market on the KOSDAQ on February 12, 2025. KOSDAQ is the smaller of South Korea’s two main boards, the venue where technology and component suppliers list when they are too small for the KOSPI, and it is the board where most of the country’s chip equipment supply chain sits. The offer was priced at KRW 11,400 per share, at the top of the indicated band, raising roughly KRW 12.61bn (about USD 8.9m) on 1.3 million new shares. Korean business daily IB Tomato carried the pricing detail on January 2, 2025, ahead of the listing, and I have leaned on that account for the offer mechanics (IB Tomato, Korean-language coverage). The stock closed its first session at KRW 22,500, roughly double the offer.
Filings submitted for a Korean listing routinely carry the issuer’s own multi-year projections, and this one did. Korean financial outlet DealSite, writing in November 2024 while the offering was still being arranged, set out what the filing carried: revenue of KRW 68.8bn and operating profit of KRW 10.8bn for 2025, then revenue of KRW 90.0bn and operating profit of KRW 18.9bn for 2026 (DealSite, Korean-language IPO coverage). In dollars at the August 18, 2026 rate, that is roughly USD 48.7m and USD 7.6m for 2025, then USD 63.7m and USD 13.4m for 2026.
I want to be precise about what those numbers are and what they are not. They are the company’s own forward view, filed under its own name. They are not a broker estimate, they are not a consensus, and they carry all of the optimism that a document written to sell shares tends to carry. I use them here for one reason only. In the twenty months since that filing, nobody published a full replacement.
What the company actually makes
The product is a FOUP Cleaner. A FOUP is the sealed pod that carries wafers between tools inside a fab, and it has to be cleaned, because particles that ride on the pod end up on the wafer. The company has supplied SK Hynix since 2016 and, according to Korean semiconductor trade publication TheElec on June 17, 2026, it was the first domestic supplier to commercialize a version built for HBM lines in 2024. The same report carried news of a first order from Samsung Electronics for an HBM-dedicated unit, with the amount undisclosed (TheElec, Korean-language trade press). There is a second business in hydrogen energy equipment. First quarter 2026 revenue split roughly 88.71% semiconductor equipment and 11.13% energy, per Korean outlet Daily Invest on July 1, 2026.
What the filing projected for 2025 and what arrived instead
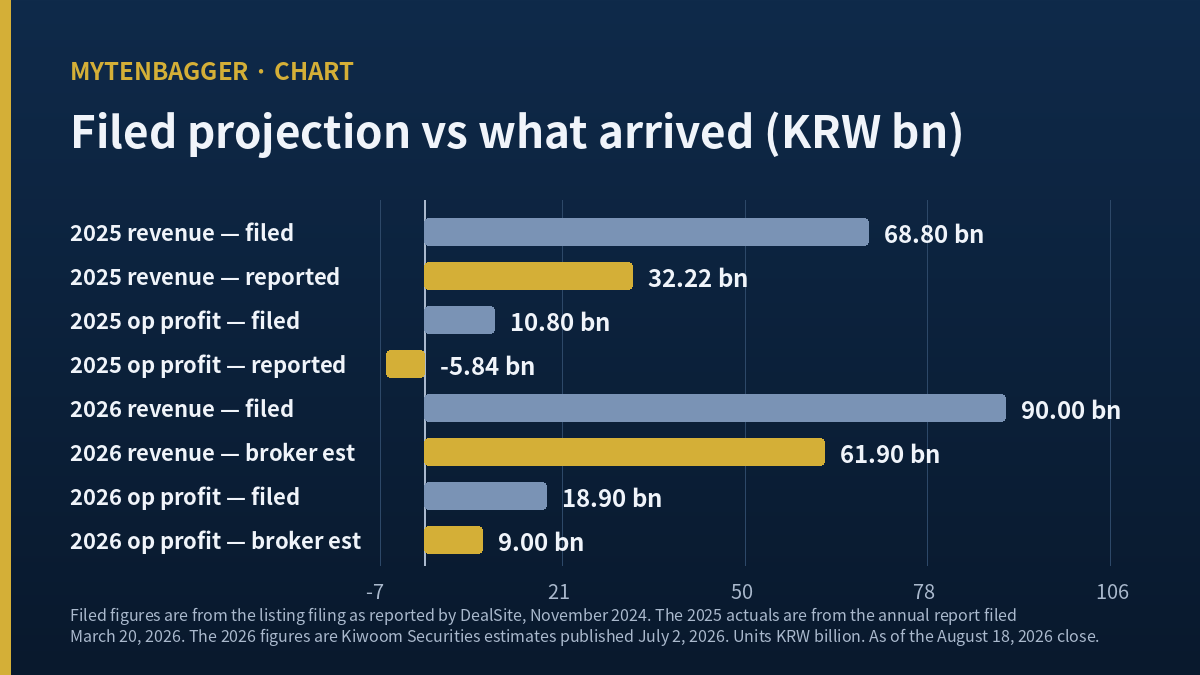
The 2025 fiscal year is closed and audited, so this comparison needs no estimating on my part. Consolidated revenue came in at KRW 32.22bn, about USD 22.8m. Operating profit came in at negative KRW 5.841bn, about negative USD 4.1m. Net loss was KRW 4.53bn. Those figures sit in the annual report filed with Korea’s Financial Supervisory Service on March 20, 2026, receipt number 20260320000831.
| 2025 fiscal year | Filed projection | Reported | Reported over projected |
|---|---|---|---|
| Revenue | KRW 68.80bn | KRW 32.22bn | 46.83% |
| Operating profit | KRW 10.80bn | KRW -5.84bn | sign reversed |
The revenue line came in slightly under half. The profit line did something a percentage cannot describe, since it crossed zero. I have written the ratio for revenue and left the profit cell as a description, because dividing a negative by a positive here would produce a number that reads like a measurement and means very little.
The 2026 line is still open, and one broker has replaced it
For the current year there is exactly one outside estimate. Kiwoom Securities analyst Oh Hyun-jin published a Not Rated note on July 2, 2026, projecting 2026 revenue of KRW 61.9bn, up 92% year on year, and operating profit of KRW 9.0bn at a 14.5% margin. Korean financial wire Newspim summarized the note the same day (Newspim, Korean-language report summary). No valuation figure accompanies it. The note rests on the order book. Backlog for the FOUP Cleaner line stood at KRW 15.4bn at the end of the first quarter of 2026, up 1,764% from a year earlier, against KRW 5.35bn at the end of 2025, with KRW 29.6bn available for revenue recognition from the second quarter onward.
Put that estimate next to the same rows in the filing and a second pair of ratios appears. Revenue of KRW 61.9bn against a filed KRW 90.0bn is 68.78%. Operating profit of KRW 9.0bn against a filed KRW 18.9bn is 47.62%.
Four ratios, two clusters, and where ISTE stock sits
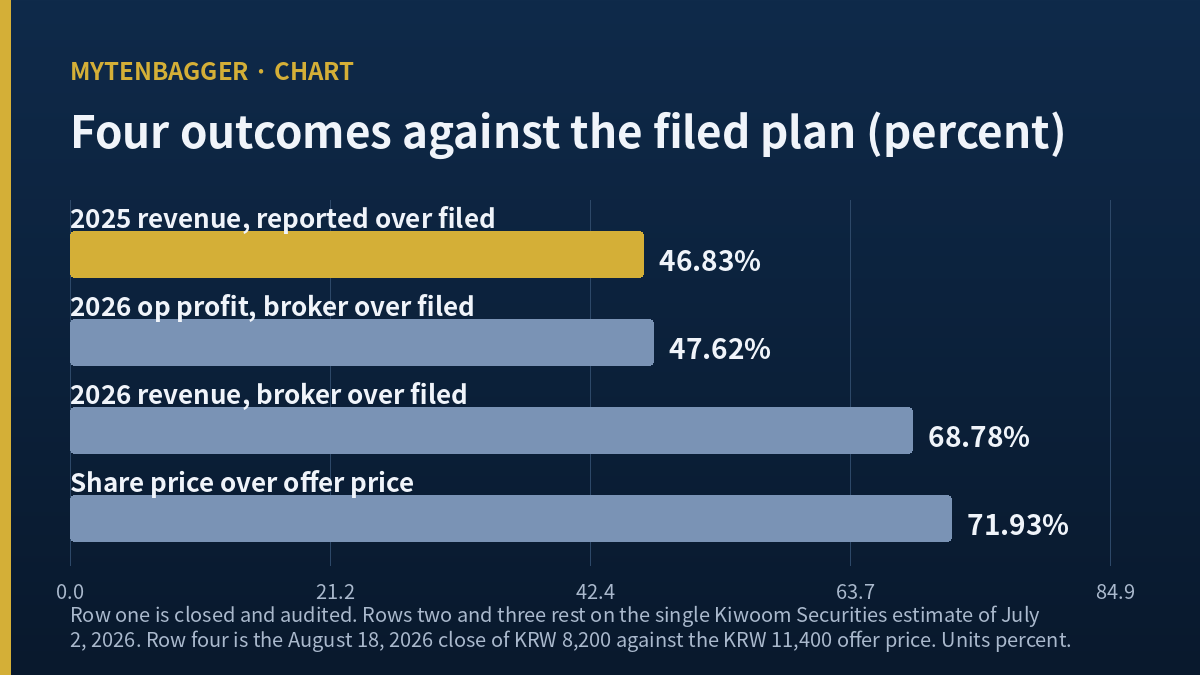
I lined the four ratios up because I wanted to see whether they scattered. They did not.
| Comparison | Ratio | Line |
|---|---|---|
| 2025 revenue, reported over filed | 46.83% | closed and audited |
| 2026 operating profit, broker over filed | 47.62% | estimate |
| 2026 revenue, broker over filed | 68.78% | estimate |
| Share price over offer price | 71.93% | market, August 18, 2026 close |
Two of the four land within eight tenths of a percentage point of each other, at roughly 47%. The other two land within about three points of each other, at roughly 70%. What separates the pairs is the line, not the date. Both profit comparisons are in the lower group, and both of the wider measures, revenue and price, are in the upper group.
The reading I take from that is modest and I will state it as such. The market has marked ISTE stock down to roughly the same fraction of the offer price that the current revenue estimate represents of the filed revenue plan, while the profit plan has been cut roughly twice as hard. A price of KRW 8,200, about USD 5.80, against an offer price of KRW 11,400, about USD 8.07, is not a collapse. It is a haircut of about the size that the revenue plan took. Whether the profit line eventually pulls the price down to match it, or the price is already looking past the profit gap, is the open question, and I do not claim to know.
The single broker following ISTE stock, and what that costs a reader
I looked for a second house and did not find one that publishes numbers. KB Securities analyst Sung Hyun-dong put out a document dated January 12, 2026, but it describes 2025 third quarter cumulative results and carries no estimate and no valuation. The Korean consensus service WiseReport displays a line on this company reading, in translation, that no opinion has been offered within the past three months. There is no consensus valuation. The same screen shows a 2026 estimated EPS of KRW 755, an estimated P/E of 10.86 times and an estimated 2026 book value per share of KRW 2,872, with no institution count attached, so I cannot confirm whether those are one house or several. I have left them out of the argument here and mention them only so a reader knows they exist.
Thin coverage has a specific consequence for a company in this position. Screens keep showing the trailing year for a long time, because no forward set arrives to sit beside it. On a Korean market data screen at the August 18, 2026 close, this company shows a P/E of zero, which means the calculation cannot be performed, and does not mean the multiple is low, a price to book of 3.76 times, a return on equity of negative 30.7%, and revenue of KRW 32.22bn. Every one of those except price to book is the 2025 fiscal year. The market capitalization is KRW 79.7bn, about USD 56.4m, which I checked by multiplying the KRW 8,200 close by 9,719,512 shares outstanding to get KRW 79,699,998,400. I have written before about a Korean equipment maker where two 2026 forecasts differed by more than double, and the contrast is worth stating plainly. There, competing estimates disagreed. Here there is no second estimate to disagree with.
The quarter that put the 2026 estimate within reach
The second quarter of 2026 was the company’s largest by revenue since it was founded. Korean industrial trade outlet HelloT reported on August 13, 2026 that revenue reached KRW 16.9bn, about USD 12.0m, with operating profit of KRW 2.1bn and net profit of KRW 1.8bn, and that order backlog stood at KRW 41.4bn at quarter end (HelloT, Korean-language trade report). I found no second outlet carrying those figures and I was unable to open the half-year filing itself, so the numbers rest on a single source. What I could do was check them against filed data from adjacent quarters. First quarter 2026 revenue was KRW 6.382bn in the quarterly report, and the reported sequential gain of 164% applied to that gives KRW 16.85bn. Second quarter 2025 revenue was KRW 3.361bn, and the reported year on year gain of 401% applied to that gives KRW 16.84bn. Two arithmetic paths from unrelated starting points arrive at the same place.
Against the Kiwoom estimate, the first half now stands at KRW 23.28bn by my addition, or 37.61% of the KRW 61.9bn full year figure. Reaching that figure requires KRW 38.62bn in the second half, which is more than the whole of 2025. I do not treat one quarter as a trend, and the size of what remains is the reason.
The global peers leave the ISTE stock column empty
My usual practice is to put a Korean small cap next to a large listed peer and set the multiples side by side. Here I cannot, and the reason is worth showing plainly instead of hiding it.
| Company | Market value | P/E |
|---|---|---|
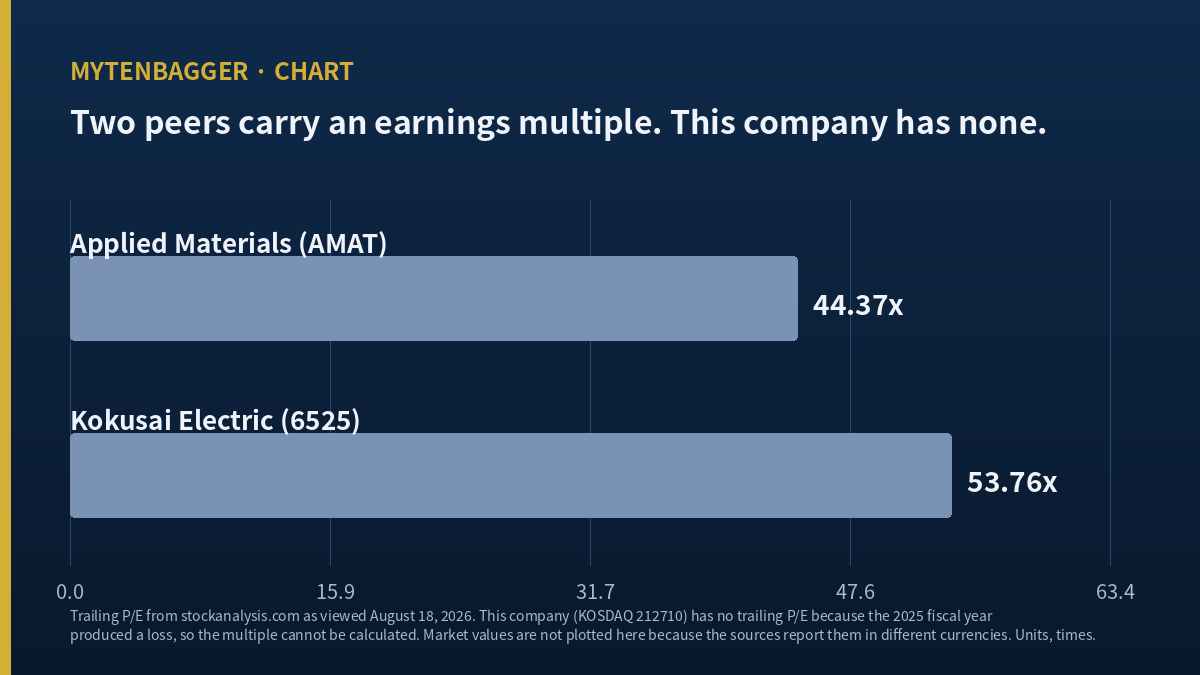
| Applied Materials (NASDAQ: AMAT) | USD 408.36bn | 44.37x |
| Kokusai Electric (TSE: 6525) | JPY 1.87tn | 53.76x |
| This company (KOSDAQ: 212710) | USD 56.4m | none exists |
Peer figures from stockanalysis.com as viewed on August 18, 2026. Applied Materials trailing twelve month revenue was USD 30.84bn, up 7.8%, with a forward P/E of 29.22 times. Kokusai Electric reported fiscal 2026 revenue of JPY 235.08bn, down 1.61% year on year.
The empty cell is the point. A trailing P/E requires trailing earnings, and the 2025 fiscal year produced a loss, so there is no multiple to place beside 44.37 times or 53.76 times. I have skipped peer multiples before when the definitions did not line up. This is a different situation. The number does not exist on my side of the table at all, and any comparison I built would have to be manufactured from an estimate that one house published.
The size gap deserves a line of its own too. At USD 56.4m this company is roughly one seven thousandth of Applied Materials by market value. Applied Materials sells process equipment that a fab orders across many steps of a line. This company cleans the pods that move wafers between them. Both live off the same capital expenditure decisions at Samsung Electronics and SK Hynix, and both would feel a cut, but only one of them has a quarter that a single purchase order can remake.
Every source behind this piece is in Korean
The problem I want to raise here is informational. Every source I leaned on for this piece is Korean language. The filings I could not open were Korean filings. The trade report carrying the second quarter numbers is Korean. The one broker note is Korean, and I read a Korean wire summary of it instead of the note itself. A reader working only in English has a thinner version of this company available than a reader working in Korean, and that gap is wider here than it is for a KOSPI large cap where English coverage exists in parallel. If somebody wants to check my work instead of taking it, the honest instruction is to read Korean sources, not English ones.
Six arguments against what I have written about ISTE stock
- A listing projection is a marketing document. Comparing outcomes to it flatters nothing and proves nothing. Issuers routinely file optimistic plans, and missing one by half may say more about the genre than about this company.
- The clustering may be coincidence. Four ratios drawn from three different kinds of source, one audited, two estimated, one a market price, are not four samples of the same thing. I noticed a pattern in a very small set of numbers and I have no test that separates it from chance.
- The second quarter rests on one outlet. My arithmetic cross-check confirms internal consistency, but consistency with a reported growth rate does not confirm the underlying figure.
- Customer concentration is severe. DealSite reported in November 2024 that SK Hynix accounted for 53.1% and SK Siltron for 35% of FOUP Cleaner revenue in the first half of 2024. One group’s capital expenditure timetable sets this company’s quarters.
- The equipment cycle has credible skeptics. NH Investment and Securities argued in a second half 2026 outlook dated May 26, 2026 that DRAM investment would stay limited and that, excluding space for HBM, there is little room for new line investment. Goldman Sachs has been reported as seeing HBM oversupply pushing 2026 prices down about 10%, per Korean outlet Global Economic on January 1, 2026.
- Price to book of 3.76 times is not a bargain. Korean screens flag anything above 3.0 times in this sector, and unlike the earnings figures this multiple is built from today’s price. Nothing about it is stale.
Where I stand on ISTE stock and what would break this reading
I should admit something about my own procedure first. I have treated an issuer’s filed projection as promotional material to be discounted and then ignored, and I have never once used one as a comparison point in a piece like this. I used it here because the alternative was to have nothing, and having used it, I noticed that it does a job I did not expect. It is dated, it is public, it is specific to the line item, and it was written before anybody knew how the cycle would turn. Those are the properties I usually want from an outside estimate. That it happens to come from the company is a weakness I am carrying knowingly, and it is the first thing a reader should push on.
At a market value of USD 56.4m this is a small company, and this piece is a record of watching, and no part of it is a case for buying.
Here is what would end this reading. The frame rests on outcomes arriving at some fraction of the filed plan. If the second half of 2026 delivers the KRW 38.62bn needed to reach the Kiwoom full year estimate of KRW 61.9bn, the 2026 revenue ratio stops being a fraction of anything interesting, and the story becomes a company running about a year behind its own listing plan and closing the distance. That is a different piece with a different conclusion, and I would rather write it than defend this one. The half-year filing already submitted on August 13, 2026, and the third quarter report expected in mid November 2026, are where that gets settled.
Prices and multiples reflect the August 18, 2026 close, checked at the time of writing. August 15 and August 17 were Korean public holidays, so August 18 was the first trading day after a three day break. Korean won is the reference currency throughout, and dollar conversions are approximate at roughly KRW 1,413.0 per dollar, the Seoul close on the same date as published by KB Financial Group.
a Korean substrate maker whose rising share price was itself the reason its reported loss , a Korean chip designer whose position depends on a product line its larger peers walked aw
- Intops Valuation: Shares Trade Below Its Cash and Real Estate
- ENF Technology Stock Beat the KOSDAQ but Lagged Its Chip Peers