POSCO M-Tech Dividend Paid Out 1.47 Times Its 2024 Profit
POSCO M-Tech stock carries a dividend history I could not read correctly on the first pass. In fiscal 2024 this company handed its shareholders 1.47 times the profit it made that year. Not 1.47 times the prior year’s profit, and not a special payout on top of a normal one. The ordinary annual dividend, measured against the net income of the same twelve months, came to 146.90 percent. The reason I am only watching sits one step under that number.
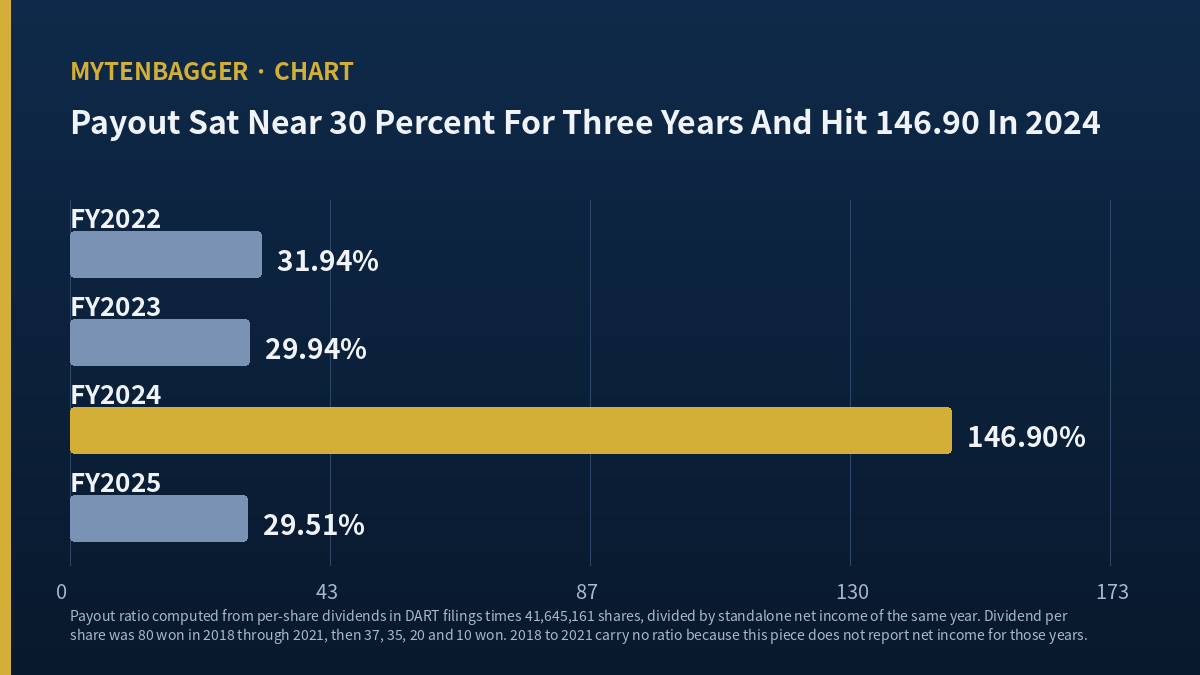
Four years of dividend against four years of profit
| Fiscal year | Dividend paid out | Payout ratio |
|---|---|---|
| 2022 (₩37 per share) | ₩1.54bn / about $1.09m | 31.94% |
| 2023 (₩35 per share) | ₩1.46bn / about $1.03m | 29.94% |
| 2024 (₩20 per share) | ₩833m / about $587,000 | 146.90% |
| 2025 (₩10 per share) | ₩416m / about $294,000 | 29.51% |
Dividend totals and payout ratios are mine, computed from the per-share amounts in the company’s DART filings times 41,645,161 shares, then divided by standalone net income for the same year. The company does not print a payout ratio in these terms.
Contents
What POSCO M-Tech stock is, for a US reader seeing the name first time
POSCO M-Tech trades on KOSDAQ under 009520. KOSDAQ is South Korea’s junior board, the venue that sits beside the main KOSPI market the way Nasdaq once sat beside the NYSE, and it is where most Korean industrial suppliers of this size list. Market value at the August 14, 2026 close of ₩12,400 per share is about $364 million across 41,645,161 shares. That is a genuinely small company by US screening standards, and it files in Korean only.
The business has two halves that do not behave alike. One half packages finished steel products for POSCO’s Pohang and Gwangyang mills. The other half makes an aluminum deoxidizer, a consumable that steelmakers add during refining to pull oxygen out of molten steel. The first half is a volume service. The second half is a commodity spread. I will come back to why that split matters for the dividend.
The company joined the POSCO group in 2005. The group’s battery-materials arm sits on a different kind of uncertainty — POSCO Future M’s anode line was about 2.0 per cent of first-quarter 2026 revenue and yet carries the furthest-dated assumption in the coverage, a 2035 North American share. POSCO and one related party together hold 50.65 percent, or 21,093,340 shares of the 41,645,161 outstanding. Treasury holdings are 5,290 shares, which is 0.01 percent. Free float is 20,540,929 shares, or 49.33 percent. So the largest customer and the controlling owner are the same entity, and I did not find a way to separate those two relationships in the disclosures I read.
The dividend did not lead the profit, it trailed it
My first reading of this company was wrong in a way worth writing down. I opened the dividend series and saw a straight decline. Eighty won per share in each of fiscal 2018, 2019, 2020 and 2021, then 37, then 35, then 20, then 10. Eight years, one eighth of the starting amount. That looks like a company managing itself down, and I treated the dividend as the thing doing the telling.
Then I put net income beside it. Fiscal 2023 net income was ₩4.87bn, about $3.43 million. Fiscal 2024 net income was ₩567 million, about $400,000. Profit fell by a factor of 8.59 in a single year. Against that collapse, the dividend went from 35 won to 20 won, a cut of only 42.86 percent. The dividend was not managing anything. It was holding still while the earnings underneath it fell out, and the 146.90 percent payout ratio is what that mismatch looks like when you write it as a fraction.
The next year is what convinced me it was a lag and not a policy
In fiscal 2025 net income recovered to ₩1.41bn, about $995,000, and the company cut the dividend again, to 10 won. Payout ratio: 29.51 percent. That is inside the band where 2022 sat at 31.94 percent and 2023 sat at 29.94 percent.
Three of these four years cluster near 30 percent. One of them sits at 146.90 percent. If I were looking at a company that had decided to sustain a payout through a bad patch, I would expect the ratio to stay high while earnings stayed low. It did not. Earnings recovered a little and the dividend was cut anyway, which put the ratio back where it had been. My reading is that this company runs to a payout ratio in the region of thirty percent, and 2024 is the year the ratio got away from it because the profit moved faster than the dividend decision could.
I want to be careful about how much that claim carries. The company has not published a payout ratio target that I have read, and I am inferring the roughly thirty percent from four observations. Three points near a number and one far from it is a pattern I can describe, and it is not a policy I can quote.
Why POSCO M-Tech stock has profit that moves faster than a dividend decision
The reason the profit can fall by a factor of 8.59 in one year, while revenue barely moves, is in a research note I found through the Korean steel trade press. The Korea IR Council’s corporate research center, analyst Lee Won-jae, wrote in a March 2025 note that the steel-raw-materials segment’s operating result is set by the LME aluminum price, by the exchange rate, and by a premium negotiated with POSCO. The Korean steel outlet FerroTimes quoted that sentence directly, and I am working from the quotation because I did not open the note itself.
Count where those three sit. The London Metal Exchange sets the first. The Seoul foreign exchange market sets the second. POSCO, which owns half the company, negotiates the third, and I found no disclosure that puts a number on it. That is three inputs to the profit line and none of them is a figure I can look up and plug in.
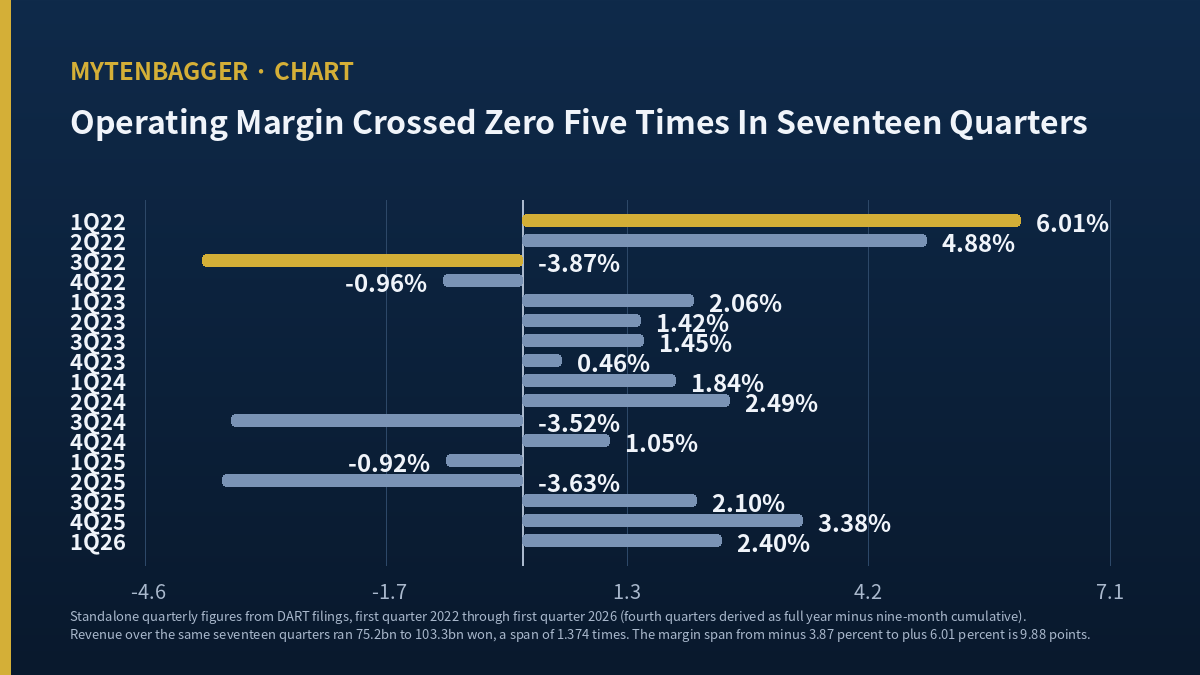
Revenue behaves nothing like that, and the contrast is what I built this reading on. Across the seventeen standalone quarters from the first quarter of 2022 through the first quarter of 2026, revenue ran from ₩75.2bn at the low to ₩103.3bn at the high, a span of 1.374 times. In those same seventeen quarters the operating margin ran from minus 3.87 percent to plus 6.01 percent, a span of 9.88 points, and it crossed zero five times. The top line sits in a corridor set by how much steel POSCO ships. The profit line does not.
Half the revenue is one contract, renewed every twelve months
On July 2, 2026 the company signed the packaging outsourcing contract for POSCO’s two mills. The amount is ₩178.1bn, about $125.6 million, excluding value-added tax, split ₩41.0bn for Pohang and ₩137.1bn for Gwangyang. The two parts add to the total exactly. The term runs one year, to July 1, 2027.
Divide that by fiscal 2025 revenue of ₩357.4bn, about $252.0 million, and the contract is 49.83 percent of a full year of sales. FerroTimes put it at 49.8 percent of the prior year, which agrees with my arithmetic to the first decimal. The same report notes the contract is built on estimated volumes and adjusts to volumes actually shipped, so the number on the page is neither a floor nor a limit on what finally gets booked as revenue.
That is how this business is put together. Roughly half the revenue arrives through a twelve-month contract with the controlling shareholder, sized to somebody else’s shipping plan. The profit arrives through a metal price, a currency, and a negotiation. A dividend decided once a year is being asked to track the second of those, and in 2024 it did not manage it.
What this looks like against the aluminum names listed abroad
The obvious comparison abroad is Kaiser Aluminum (NASDAQ: KALU), which sits in the same metal and files in English every quarter. I did not build a multiples table against it, and the reason is not laziness. The two companies stand on opposite sides of the aluminum they touch. Kaiser buys primary metal and sells fabricated aluminum products, so its margin is a conversion spread. POSCO M-Tech buys aluminum and sells it into steel refining as a consumable, at a premium its steelmaking parent negotiates. Putting an operating margin from one beside an operating margin from the other would look like a comparison and would only be two unlike spreads in adjacent cells.
The comparison that does hold is a disclosure comparison, and it runs against the Korean company. US filers in the aluminum chain describe their metal-price exposure and any hedging program in their own annual filings, in a section a reader can go find. I did not open Kaiser’s filings in this session, so I am not quoting anything from them. What I can say from the Korean side is that the premium in the sentence I quoted above is not disclosed anywhere I looked, and the fiscal-year statements I read are standalone and not consolidated, which removes another place a reader might have gone looking.
The odd thing about this listing
POSCO Holdings, the controlling shareholder and the counterparty on half the revenue, is listed in New York as PKX, with each depositary share representing a quarter of a common share. So the entity that sets this company’s volumes, and negotiates the premium on its margin, carries a New York listing, while the company itself trades only in Seoul. The side of the relationship that does the setting is priced on two exchanges and the side that gets set is priced on one. I have not seen that particular asymmetry in the names I have written up before.
The multiple on POSCO M-Tech stock is a small number in disguise
At ₩12,400 the shares trade at 365.78 times earnings and 4.52 times book. I checked both against the underlying so I would know what I was quoting. Earnings per share of ₩33.9 times 41,645,161 shares gives ₩1.412bn, against fiscal 2025 standalone net income of ₩1.411bn. Book value per share of ₩2,745 times the same share count gives ₩114.3bn, against standalone equity of ₩114.3bn. Both close.
So the 365.78 is not a statement about a rich business. It is ₩12,400 divided by ₩33.9, and the ₩33.9 comes from a year in which the company lost ₩4.04bn in operating terms over the first six months and made ₩5.08bn over the second six to finish barely positive. Divide by a profit made that way and the multiple comes out large. If earnings double, the multiple halves, and I say so because a reader who takes 365 as a verdict on price will misread this company in the opposite direction from a reader who ignores it.
One number I checked and set aside: a Korean data screen shows 374.98 times earnings and 4.63 times book on a ₩12,710 quoted price from July 1, 2026. Those two recompute cleanly from that quote, and they are not the August 14 close, so nothing in this piece uses them.
What POSCO M-Tech stock did while the market and its sector moved
Over the trailing year to August 14, 2026, the shares returned minus 15.36 percent. KOSDAQ returned plus 6.06 percent. The steel sector index, equal-weighted with this company removed from it, returned minus 1.49 percent. That leaves the stock 21.42 points behind the market and 13.87 points behind its sector, and the tool splits that gap into 7.55 points of sector effect and 13.87 points of stock effect.
The drawdown numbers on the same window: a peak of ₩21,450 on April 28, 2026, a trough of ₩9,180 on July 29, 2026, and ₩12,400 on August 14, 2026. That is 42.19 percent below the peak, 35.08 percent above the trough, and a peak-to-trough fall of 57.20 percent. KOSDAQ fell 29.48 percent from its own peak over the same window and the sector index fell 21.69 percent, so this name went down considerably harder than either.
The short window points the other way, which is why I am putting it here instead of burying it further down. Over twenty trading sessions the stock is up 16.65 percent against a sector up 7.23 percent and a market up 9.20 percent, a gap of 9.42 points that the tool flags as stock-specific. Whatever has been happening in the last month is not the same thing that happened over the year.
The first quarter of 2026 was the best revenue quarter in the series
Reported on April 30, 2026: revenue of ₩103.3bn, about $72.9 million, up 19.7 percent from ₩86.3bn a year earlier. Operating profit of ₩2.48bn, about $1.75 million, against a loss of ₩796 million a year earlier. Net income of ₩2.24bn, about $1.58 million, against a loss of ₩765 million. A Korean business outlet, CBC News, carried those figures and they match what I pulled from the filings to the won.
Two things about that quarter deserve to sit next to each other. It is the only quarter in seventeen to clear ₩100bn of revenue. And the operating profit in it, ₩2.48bn, is 2.40 times the whole of fiscal 2025’s operating profit of ₩1.03bn. One quarter earned more than twice what the preceding twelve months earned in total.
I am deliberately not treating that as a turn. A quarter divided by a year is two different lengths of time in one fraction, and the half-year table in this company’s history shows how often the front of a year has failed to predict the back of it. Fiscal 2024 made ₩3.52bn in the first half and lost ₩2.10bn in the second. Fiscal 2025 lost ₩4.04bn in the first half and made ₩5.08bn in the second. Two consecutive years, opposite internal signs, similar annual totals.
On the day those results landed the stock fell 5.82 percent
A Korean market outlet reported that the shares closed April 30, 2026 at ₩19,920, down ₩1,230 from ₩21,150, on volume of 484,516 shares. The reasons it gave were profit-taking after a run and general weakness in the steel complex. I am not adopting that explanation, because pinning one session’s move on a cause after the fact is not something I can check. The fact I am keeping is narrower: earnings turned positive and revenue hit a seventeen-quarter high, and the shares went down that day.
Numbers I checked and left out of the case
Analyst coverage, and a screen that says so itself
A Korean research aggregator lists ten notes on this company from two houses, Hyundai Motor Securities and the Korea IR Council research center, with an average posted valuation of ₩7,975. A second Korean screen carries the line that no opinion has been issued in the last three months. The forward earnings, forward multiple and peer multiple fields in the indicator database I use are all empty.
I recorded that as the result of my coverage check and left the ₩7,975 out of the argument. There is no sentence in this piece that sets that figure beside the ₩12,400 close.
Two outlets quoting the same forecast differently
The 2025 forecast in that research note was ₩359.3bn of revenue and ₩2.1bn of operating profit. One Korean outlet described the operating profit forecast as up 50.5 percent, another as up 47.6 percent. Applied to fiscal 2024’s actual ₩1.42bn, those give ₩2.14bn and ₩2.10bn. The arithmetic favors the second, since ₩2.1bn over ₩1.42bn is 47.68 percent, and I used the ₩2.1bn both outlets printed. Which figure the note itself carries I do not know, because I did not read it.
For the record of what that forecast did: actual fiscal 2025 revenue came in at ₩357.4bn, 0.52 percent below the forecast. Actual operating profit came in at ₩1.03bn, 50.76 percent below it. The revenue call was close and the profit call was half out, which is the same asymmetry the three-input sentence predicts.
A share count that differs between two screens
One source gives 41,645,161 shares and another gives 41,642,703, a difference of 2,458 shares or 0.0059 percent. I used the first throughout, because it is the one that reconciles the ownership percentages: 21,093,340 over 41,645,161 is 50.6503 percent against a posted 50.65, and 20,540,929 over the same base is 49.3237 against a posted 49.33.
One thing I checked that held
The four standalone quarterly operating results for fiscal 2025, minus ₩796m, minus ₩3.245bn, plus ₩1.737bn and plus ₩3.338bn, sum to ₩1.034bn and match the annual figure. The net income series sums to ₩1.411bn and matches as well. The fourth quarter in each series is a computed figure and not a filed one, so I ran that reconciliation before using either.
Twelve arguments against the way I read POSCO M-Tech stock
Grouped by what each one attacks, and inside each group the strongest objection comes first.
Against the dividend reading
- I computed every payout ratio here from standalone net income. Whether this company decides its dividend against standalone net income, against distributable earnings, or against something else, I did not confirm.
- The roughly thirty percent I describe is inferred from three observations. A company with no stated target may simply have had three years that happened to land there.
- Fiscal 2024’s payout may have been a deliberate defense of the dividend through one weak year, which is a normal and defensible choice, and would make my word for it wrong even if the arithmetic is right.
- I have no 2018 to 2021 net income in front of me, so the four years at 80 won have no payout ratio attached. The series I am reading is shorter than the series I am showing.
Against the three-inputs reading
- The sentence I quoted describes the steel-raw-materials segment. Roughly half the revenue is packaging, so applying those three inputs to the whole company’s profit is my extension. The analyst did not write it that way.
- The note is from March 2025. Cost structure or contract terms may have changed since, and I did not open a document that would tell me.
- The first quarter of 2026 turned positive with the best revenue in the series, and the fourth quarter of 2025 was positive too. Two consecutive positive margin quarters is most of the way to the condition I set for being wrong.
- An unquantified negotiated premium is not the same as an unknowable one. A reader with the annual report’s related-party note in front of them may be able to bound it, and I did not read that note.
Against my measurements
- The steel sector index I leaned on is a synthetic the tool builds. Switching it from equal weight to market-cap weight moves the sector return from minus 1.49 percent to plus 2.42 percent, which widens my underperformance from 13.87 points to 17.78 points. One constituent is 65.91 percent of that sector by value. What survives either weighting is only the rank, 33rd of 53.
- The 1.374 times revenue span and the 9.88 point margin span come from seventeen observations. That is a description of a period, and I have not tested whether it holds outside it.
- The contract at ₩178.1bn reads as stability just as easily as it reads as dependence. Half a year’s revenue committed twelve months forward is a fact that supports either sentence.
- An exchange rate is where this objection started, and it is the one I want on the record last. I wrote the conversions in this piece against a single rate from one date, and while I was writing that footnote I noticed I had been treating my own measuring marks the same careless way I had treated the dividend series at the start. I had read a declining series as an actor when it was a consequence. The rate in these brackets is not a fact about this company either. It is a fact about the day I looked, doing the work of a fact about the company, and this whole piece rests on how well I kept those two apart.
Where I stand on POSCO M-Tech stock and what would move me
At about $364 million of market value this sits well outside the top hundred Korean companies by size, which is where my default is to watch. The seven-metric checklist I run scores it 3 of 7, at 43 points: revenue scale, positive earnings per share and a positive operating result pass, while operating margin, return on equity, the earnings multiple and the book multiple do not.
Those four failures are not the reason. The reason is that the three things which set this company’s profit are a metal price I can see but cannot translate into its margin, an exchange rate in the same position, and a premium negotiated by the shareholder who owns half the company and discloses none of it. I can put numbers into a model of the revenue. I cannot put numbers into a model of the profit, and 365.78 times a profit I cannot model is not a price I was willing to pay.
Here is what would tell me I read this wrong. If the 2026 half-year report, or a later filing, shows the steel-raw-materials segment holding a quarterly margin at or above 3 percent for two consecutive quarters, I withdraw the claim that this profit is unmodellable from outside. Two in a row would not be a metal price happening to cooperate. It would mean the premium or the cost base moved, and in that case what was unobservable was my access to the documents. The economics were doing something I could not see.
the holding company whose Argentine lithium unit turned a first monthly profit while the s, the blast-furnace maker whose second-quarter profit came from a different mill than its th, the smelter posting record profits into a governance discount
The sentence I am leaving on POSCO M-Tech stock
The dividend on this company told me the truth and told it late. One eighth of what it was, and the year it said the most was the year it barely moved. I spent the first part of this work treating that series as the company describing itself, and it turned out to be the company being described by something it does not control.
That is the same thing I concluded about the profit line, arrived at from a different direction, and it is why I am watching. A revenue number set by somebody else’s shipping plan and a margin set by a metal, a currency and a private negotiation is a business I can narrate and cannot forecast. Narration is worth writing down. It is not worth 365.78 times a year’s earnings to me.
And a dividend that reports a year late is a fair warning about the shelf life of anything else written about this company, including this. The 2026 half-year report was due August 15, 2026, a Saturday, and moves to August 18, 2026, a Tuesday, because of the holiday. Whatever it says about the second quarter’s margin arrives after the last sentence of this piece, and I would rather point at the date than pretend I got in front of it.
Prices and multiples here reflect the August 14, 2026 close, checked while writing. The Korean market was shut August 15 through 17 for Liberation Day and a substitute holiday, so August 14 was the preceding session and August 18 is the next one; this piece may publish after that, so live quotes can differ. Korean won is the reference currency throughout and dollar figures are approximate, converted at roughly ₩1,418.3 per dollar, the Seoul market close on the same August 14 date. Financials are from the company’s DART standalone filings, the fiscal 2025 annual report filed March 18, 2026 and the first-quarter 2026 report filed May 15, 2026. Dividend totals, payout ratios, error rates and span figures are my own calculations from the source amounts named in the text.
- PharmaResearch Q2 2026 Earnings: Profit Grew Slower Than Sales
- Hanil Cement Dividend: A 99% Payout as Profit Halved
- POSCO International Dividend: Eight Straight Years Without a Cut