Sanil Electric Q2 Results: Orders Rose 163%, Sales 28%
KRW 164.2bn
up 28.0% year on year
KRW 243.5bn
up 163.4% year on year
KRW 556.7bn
up 32.7% year on year
1.48x
my calculation
The orders are real and they are piling up faster than the plant ships, but sales growth slowed from the first three months to the next, and I want one more report before I decide whether that was a pause or a trend.
Sanil Electric Q2 results put three numbers side by side that do not sit comfortably together. Sales for April through June rose 28.0% from a year earlier to KRW 164.2bn (about $120.9m). New orders in the same three months rose 163.4% to KRW 243.5bn (about $179.3m). And three months before that, in January through March, sales had grown 52.1%. So orders accelerated hard while sales growth fell from 52.1% to 28.0%. I spent most of this session trying to work out which of those two movements tells me more about the next year.
Some context for readers who do not follow Korean industrials, since the name rarely shows up in US coverage. Sanil Electric (KRX: 062040) makes specialty transformers, the units that sit between solar farms, battery storage sites or on-site fuel cells and the grid. It listed in July 2024, moved to KOSPI, the main board of the Korea Exchange, and more than 90% of its sales go abroad, mostly to the US. At the October 1, 2026 close of KRW 212,500 it is worth about KRW 6.51tn, or roughly $4.79bn.
Contents
Sanil Electric Q2 results in three numbers
I started with the company’s own disclosure. On August 7, 2026 Sanil Electric reported consolidated April-June sales of KRW 164.18bn and operating profit of KRW 62.04bn, up 28.0% and 34.3% from a year earlier, according to Korea Economic TV’s report on the release. Operating profit came to 37.8% of sales, up from 36.0% a year earlier (my calculation from the same figures). Few companies in electrical equipment run anywhere near that level of profitability.
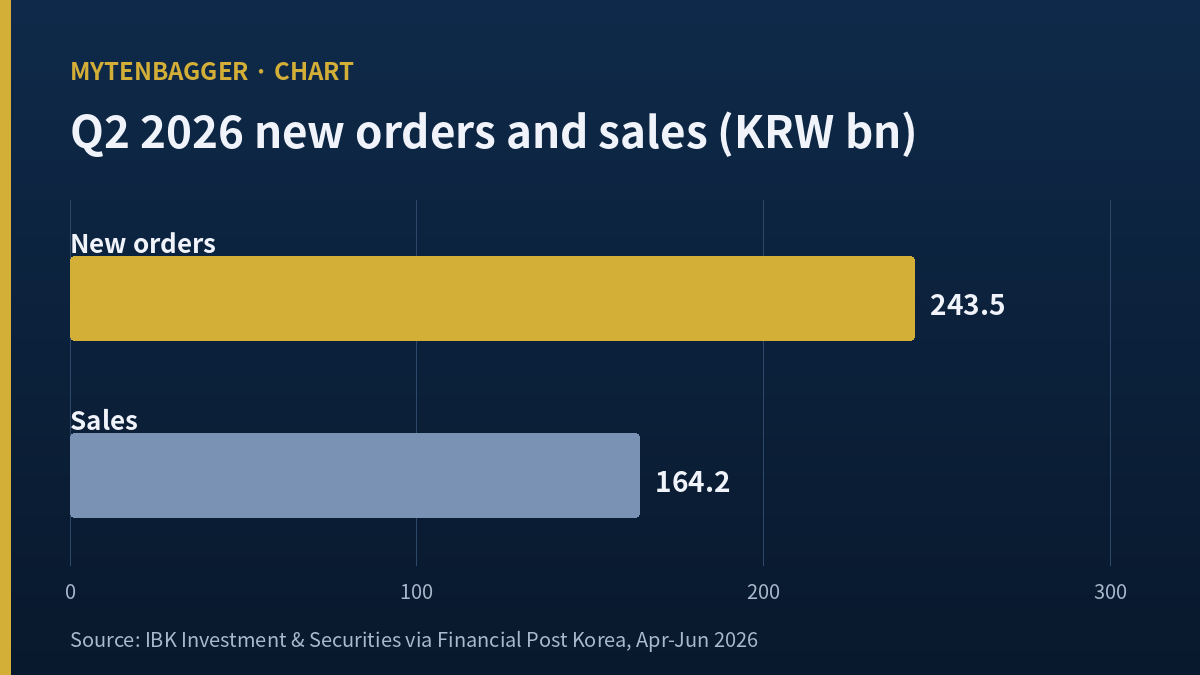
The order side came from the sell-side. IBK Investment & Securities analyst Kim Tae-hyun put April-June new orders at KRW 243.5bn, up 163.4%, and the June-end backlog at KRW 556.7bn, up 32.7% year on year, as described by the Korean outlet Financial Post Korea. Seoul Economic Daily added that the order figure was 36% higher than in January-March, which puts first-quarter orders near KRW 179.0bn by my calculation.
Put together: the company took in about 1.48 won of new work for every won it shipped in April-June. Backlog at the end of 2025 was KRW 448.9bn, according to an SK Securities note from February. Add roughly KRW 179bn and KRW 243.5bn of new work, subtract January-June sales, and you arrive within about KRW 0.2bn of the KRW 556.7bn IBK reported. The order story holds together arithmetically. That matters to me because order figures from secondary sources are where I most often find mismatches.
Before going further, I lined up the last four reported three-month periods on one table, because a single quarter on its own told me very little. The figures below are consolidated, taken from Sanil Electric’s DART disclosures, with the October-December line derived as the full-year figure minus the nine-month cumulative figure.
| Period | Sales (KRW bn) | Operating profit (KRW bn) | Operating profit / sales |
|---|---|---|---|
| Jul-Sep 2025 | 132.7 | 42.6 | 32.1% |
| Oct-Dec 2025 (derived) | 142.1 | 52.4 | 36.8% |
| Jan-Mar 2026 | 150.3 | 55.5 | 36.9% |
| Apr-Jun 2026 | 164.2 | 62.0 | 37.8% |
Source: Sanil Electric DART reports, consolidated. Ratios are my calculation.
Two points stand out. First, sales have risen in every one of the four periods, from KRW 132.7bn to KRW 164.2bn, a 23.7% climb in nine months. The slowdown people talk about is a slowdown in year-on-year growth, against a strong April-June 2025. In sequence, the company keeps setting new records: April-June was 9.2% above January-March. Second, the profitability line has moved up step by step, from 32.1% to 37.8%. That tells me the extra volume is coming in at better returns than the existing business, which is the opposite of what I would expect if the company were buying orders with price cuts.
I also checked how much of the extra sales dropped through to operating profit. Comparing April-June with the same months a year earlier, operating profit rose by about KRW 15.8bn on about KRW 35.9bn of extra sales, roughly 44 won of profit for every 100 won of new revenue (my calculation). For a manufacturer, that is a high figure, and it is the strongest argument that the plant still has room before costs catch up.
Backlog grew 24.0% in six months (my calculation from the two sell-side figures) even though April-June was the company’s biggest three months of sales on record. For now, output looks like the limit on growth, and demand does not.
Sanil Electric Q2 results: where the growth slowed
Here is the part I misread on my first pass. I saw the slowdown from 52.1% to 28.0% and assumed it was a timing issue with US projects, the kind of slip that happens when a customer delays a site. The January-March figures come from the company’s April 30 release, as headlined by Korean wire services: sales of KRW 150.32bn, up 52.1%. Operating profit for those three months was KRW 55.48bn in the quarterly report. Then I went back to the product split IBK published, and the story changed.
According to IBK, specialty transformer sales in April-June rose 51.7% to KRW 132.4bn. That leaves KRW 31.8bn for everything else the company sells, against about KRW 41.0bn a year earlier if I work the same 51.7% back to last year’s figure. In other words, the core product did not slow at all. It grew about as fast as total sales had in January-March. The rest of the business shrank by about 22% (my calculation, built on IBK’s product figures and not on anything the company itself split out in the release). The headline slowdown is a mix effect.
That changed how I feel about the number. A slowing core would worry me. A shrinking side business, while the main line keeps compounding, worries me much less, because the side business is the part the company is least likely to prioritize when the plant is full. I would still like the company’s own segment table before I lean on this, and I have not seen it yet. The January-June report is where that table would sit, and so far I have worked only from the headline figures and the sell-side split.
Orders are running ahead of the plant
The order mix matters as much as the size. KB Securities analyst Kim Sun-bong wrote on August 31 that orders tied to Bloom Energy, the US fuel-cell company that supplies on-site power to data centers, made up roughly 30% of the April-June order total. Seoul Economic Daily also reported a KRW 42.6bn order from a European battery maker in the same three months. Both are new customer types for a company whose backlog at the end of 2025 was, per SK Securities, 75% renewables, 20% grid and 5% industrial.
KB’s reasoning on the Bloom Energy link is worth spelling out, because it is the part of the story most US readers will recognize. As KB framed it in its August 31 note, US data center builders are increasingly turning to on-site generation because connecting a new campus to the grid can take years, and solid oxide fuel cells win many of those projects because they make little noise and emit less carbon than gas turbines. Every fuel-cell installation still needs transformers to step the power up or down. Sanil Electric does not need Bloom Energy to win every project; it needs the on-site power model to keep spreading. KB described the Bloom orders as a starting point for a wider group of data center customers and not a one-off, and that is the claim the next two reports will test.
This pattern, where the order backlog changes character before the sales line does, is something I tracked at Iljin Electric, where unfilled orders had already swung toward heavy electrical equipment while sales were still mostly cable. Sanil Electric is earlier in that process. Its sales are still dominated by renewables projects, and the data center orders will only start showing up in deliveries over the coming year.
The inventory line points the same way. Inventory stood at KRW 110.0bn on June 30, up 20.3% from KRW 91.4bn at the end of 2025, and equal to about 61 days of April-June sales. A plant that is building ahead of deliveries holds more units in progress. I read that as a sign of a full factory and not of slow-moving stock, though I cannot rule out the second without the company’s breakdown of raw materials against finished goods.
Capacity is the obvious limit. The company has said it is adding a 154-kilovolt high-voltage line, and NH Investment & Securities analyst Lee Min-jae, writing in May, put the extra annual sales from that expansion at about KRW 25bn. The bigger plant purchase in Ansan was disclosed in August, with production expected in 2028. Until then, orders can grow faster than sales for a long time. NH also tied the new line to a North American supply question: after GE Vernova took over Prolec GE, a large transformer supplier in the region, some developers began worrying about access to equipment, and NH argued that a 154-kilovolt line lets Sanil Electric cover every voltage class a solar project needs. That is a reasonable argument, though it describes an opportunity and not an order that has been signed. The question of how a Korean transformer maker lifts profitability by moving up the voltage ladder is the one I worked through at LS Electric. Sanil Electric starts from the opposite end: it already earns high returns on a narrow set of products and needs volume.
Three exposures the order total does not show
The order number is impressive, but it is a single total, and a single total hides concentration. The first exposure is geography. Korean business outlet BizWatch, in a February 2026 profile, put exports above 95% of sales and the US alone at roughly two-thirds or more. That is the reason the company exists in its current form, and also the reason a change in US policy toward renewables or imported grid equipment would hit it harder than a domestic Korean supplier.
The second exposure is trade policy itself. The SK Securities note from February mentioned that tariffs had already caused the company to adjust delivery timing for some US-bound units, and that sales to Europe had dipped temporarily. Neither of those showed up as a large hit in the reported numbers, but they explain part of why quarterly sales do not follow orders in a straight line.
The third exposure is currency. With nearly all sales abroad, a weaker won lifts reported sales and profit in Korean won terms without any change in volume. I have not separated the currency effect from the volume effect in the April-June figures, because the company’s release did not split it out and I did not want to invent a split. For a reader who measures returns in dollars the effect runs the other way when the won weakens, which is worth keeping in mind when comparing the KRW growth rates above with any dollar return.
A detail that stuck with me while reading the SK note: the analysts wrote that data center orders were expected to take time, likely into the first six months of 2026. They did arrive in April-June, roughly on that timeline. Sell-side timing calls on Korean industrials are often too early, so I give that note a little more credit than I would otherwise.
A Canadian peer grew faster in the same three months
To check whether 28.0% was slow or fast for this niche, I looked at Hammond Power Solutions (TSX: HPS.A), a Canadian maker of dry-type and specialty transformers that names data centers as its main US demand driver. In its second-quarter release for the period ended June 27, 2026, Hammond reported sales of C$324.8m, up 44.7%, and said the growth came from higher data center deliveries. Its backlog was 96.9% higher than a year earlier but 6.9% lower than at the end of the first quarter.
I am deliberately using only two things from Hammond: the growth rate of quarterly sales and the direction of its backlog. I am not comparing profitability or valuation, because Hammond reports in Canadian dollars under a different reporting framework and its product mix is wider. The contrast is still useful. Hammond’s sales grew faster, but its backlog started shrinking from one quarter to the next. Sanil Electric’s sales grew slower, while its backlog kept rising. One company is shipping out of its backlog. The other is still filling it.
What Sanil Electric Q2 results mean for full-year expectations
The consensus I could find, reported by The Korea Economic Daily in early July, had 2026 sales at KRW 671.4bn and operating profit at KRW 249.6bn, with 2027 sales of KRW 873.8bn and operating profit at 38.2% of sales. That last figure is the one I care about. April-June came in at 37.8%, so the sell-side is assuming the current level of profitability simply holds while sales grow another 30% or so.
Valuations on the stock vary widely. Korean press reports put recent brokerage valuations between KRW 220,000 (IBK) and KRW 360,000 (Yuanta), with NH at KRW 332,000 after its May revision. The October 1 close of KRW 212,500 sits below every one of them. I treat that spread as a sign that analysts agree on the order story and disagree on what multiple it deserves, which is exactly the point where my own view has to come from the numbers and not from the median.
For a US reader, it helps to see the price path. The stock peaked in early May after the Bloom Energy supply news, lost well over half of its value by the end of July, and has since recovered most of the way back to where it stood in June. Those swings happened while orders were rising every quarter. The share price has been reacting to sentiment about the whole transformer group far more than to anything in Sanil Electric’s own reports.
Where my read on Sanil Electric Q2 results could be wrong
Here is the strongest case against my decision to wait.
- The mix explanation cuts in favor of buying now. If the core product grew about 52% in April-June, the slowdown is noise, and waiting for the July-September report only means paying more once the headline growth recovers.
- Orders are a better leading indicator than sales for a company that is capacity-bound. A 163.4% jump in new work, with almost a third from a data center supplier, says more about 2027 than one soft quarter of deliveries.
- Profitability is still rising. Operating profit as a share of sales went from 36.0% to 37.8% year on year in April-June. A business whose returns improve while it grows is rarely the one to avoid.
- Hammond’s shrinking backlog may be a sign that North American buyers are spreading orders across more suppliers, and Sanil Electric could be one of the beneficiaries of that shift.
- Seoul Economic Daily noted that Shinhan raised its operating profit estimate for the year in August, even while cutting its valuation. The earnings direction from the sell-side points up.
And here are the conditions under which I would admit my caution was misplaced.
- July-September sales growth of 30% or more year on year in the Q3 report due by November 16, 2026, which would show the April-June figure was a dip.
- New orders of KRW 150bn or more in July-September, which would show that the April-June jump was not a single lumpy quarter.
- Operating profit staying at or above 37% of sales while the order mix shifts toward data center customers, which would answer my worry that new customer types come at lower returns.
What I am watching before November 16
The orders are excellent and the core product is still compounding, but I want to see the company confirm the product split in its own report, and I want to know whether July-September sales growth returns above 30%. If both happen, the stock at its October 1 price starts to look like a business priced for its current pace and not for the pace the order backlog implies.
The most useful number in this whole set, for me, turned out to be one I had to build: the KRW 31.8bn of non-core sales. It is small, it shrank, and it explains most of the headline slowdown. If the Q3 report shows that figure stabilizing while the specialty transformer line keeps growing at 50%, I will have to revisit my caution quickly. If instead the core line slows too, I will be glad I waited.
One more note on timing. My first instinct after seeing the 163.4% figure was to look for a reason to turn positive before the next report, because large order numbers tend to pull the share price ahead of the sales they eventually produce. The table of four periods talked me out of rushing. The company has been growing steadily for a year; nothing in the April-June numbers suggests the next report has to be the moment it re-rates. Missing a few percent of upside costs less than misreading a slowdown.
The dates I have written down are October 20, 2026, when the company is due to make the next payment on its new plant site, and November 16, 2026, the deadline for its Q3 report. Those two will tell me whether the plant is moving on time and whether deliveries are catching up with the orders.
Prices reflect the October 1, 2026 regular-session close of KRW 212,500 (Kiwoom daily data and a Topstar News after-hours report agree; Jaegyeong Ilbo printed KRW 213,000). USD figures are approximate, at roughly ₩1,358 per dollar, the Seoul foreign exchange market close on the same date. Company figures are consolidated, from Korean disclosures; sell-side figures are credited to the brokerage and outlet that published them.