Why Dentium Fell 40% After Cancelling Its Treasury Shares
Dentium stock carries a share cancellation plan that fits in one line: the company would cancel 2,444,939 treasury shares in three equal steps between 2026 and 2028. In a cancellation the number I care about is the lower half of the division, because a smaller share count lifts per-share earnings by arithmetic and does not need anyone to agree with me.
Twelve months later the company has done it. On the August 25, 2026 close the shares finished at KRW 36,900 (USD 26.69), down 40.58% over those twelve months. The arithmetic in my note worked exactly as written and the outcome went the other way. This entry is my attempt to count what sat on the other side of it.
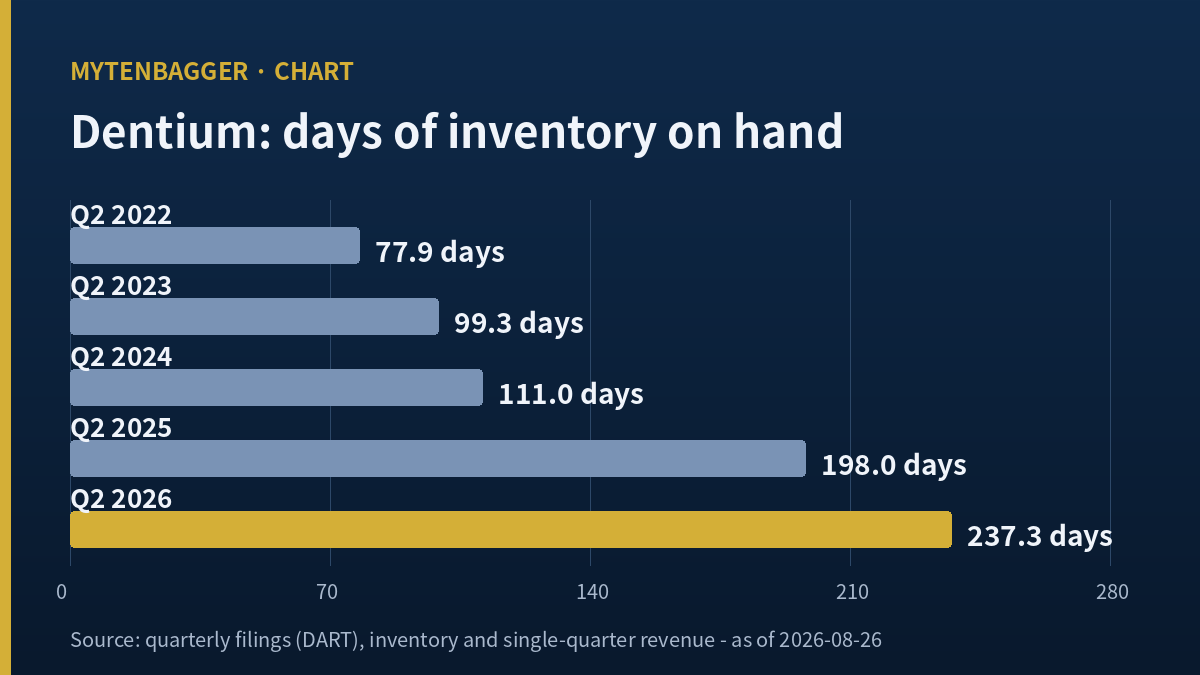
The one series I counted myself: days of inventory on hand
Q2 2022 77.9 days → Q2 2023 99.3 → Q2 2024 111.0 → Q2 2025 198.0 → Q2 2026 237.3
Across those same four years annual revenue moved from KRW 355.87bn (USD 257.4m) to KRW 346.45bn (USD 250.6m), a decline of 2.65%. The company sells about what it sold four years ago and the goods wait roughly three times as long. My position is watching.
Contents
What Dentium stock is, in one paragraph
Dentium Co Ltd trades on the KOSPI under 145720. The KOSPI is Korea’s senior board, the one that carries Samsung Electronics and Hyundai Motor, and it sits alongside the KOSDAQ, a separate venture-tier board run by the same exchange operator. The company makes dental implant fixtures and the surrounding digital dentistry equipment. Korean investment coverage from March 2026 put overseas sales at roughly 80% of the total and China at 42.2% in the third quarter of 2025, the largest single destination. Market capitalization on the August 25, 2026 close is KRW 318.22bn (USD 230.2m), which I get from 8,623,891 shares at KRW 36,900 and which matches the KRW 318.2bn shown on the Korean company-data screen I use.
The quarter under Dentium stock where the largest operating profit met a net loss
The single strangest line in this company’s recent filings is the fourth quarter of 2025. Discrete operating profit for that quarter was KRW 26.51bn (USD 19.2m), the largest of the four quarters in 2025 by a wide margin. The other three were KRW 9.58bn, KRW 15.54bn and KRW 12.47bn. And the same quarter closed with a net loss of KRW 5.04bn (USD 3.6m). Between the operating line and the bottom line, KRW 31.55bn (USD 22.8m) went away.
Korean business press reporting from March 2026 puts KRW 22.0bn (USD 15.9m) of that into non-operating losses and names the cause: an impairment assessment on the Shanghai manufacturing subsidiary. The same report gives the quarter’s revenue split, with Korea at KRW 18.5bn and China at KRW 32.4bn against total revenue of KRW 109.1bn. Rebuilt from the filed statements the same quarter comes to KRW 109.15bn, and set against discrete revenue of KRW 118.73bn in the fourth quarter of 2024 that is 8.07% lower (109.15 divided by 118.73, minus one).
The write-down landed on the plant, not the sales arm
This is where I stopped for a while. A company facing weak Chinese demand could impair a distribution entity, a receivable book, or goodwill attached to a sales channel. What this company marked down was the entity that makes the product. I read that as management conceding something about capacity, not about customers, and the next two sections are what that capacity produced.
The cancellation that shrank the share count by 15.9%
Korean coverage from March 2026 reports the retirement of 1,629,959 shares, described as 15.9% of shares outstanding, at KRW 79.38bn (USD 57.4m) measured on the close before the board resolution. Adding that to the current count of 8,623,891 gives a pre-cancellation count of 10,253,850 (my own arithmetic), and 1,629,959 divided by 10,253,850 is 15.90%, which agrees with the reported figure.
The effect on per-share figures is mechanical. A count at 0.841 times its old size multiplies per-share earnings by 1.189 (10,253,850 divided by 8,623,891, my calculation). Earnings could stand perfectly still and earnings per share would rise 18.9%.
The program is not finished. The August 2025 announcement covered 2,444,939 shares over three years; subtracting what has already gone leaves 814,980 shares, or 9.45% of the current count. Two thirds of a three-year plan was executed at once, and the remaining third would take the count down again. In my ledger this is the only item on the bullish side that does not depend on a forecast.
One thing I could not close. The February 2, 2026 cancellation filing on the Korean exchange disclosure system returned a 403 to me, so I never read the primary document, and the pre- and post-cancellation share counts above are reconstructed from press reporting and a company-data screen, not lifted from the filing. I would rather say that than present a reconstruction as a filing.
Earnings fell faster than the share count did
If the arithmetic moved 18.9% in the holder’s favor and the shares still fell 40.58%, something larger moved the other way. Here is the fiscal record, consolidated, as filed.
| Period | Revenue (KRW bn) | Operating profit (KRW bn) | Operating margin | Profit to owners (KRW bn) |
| FY2022 | 355.87 | 125.70 | 35.32% | 86.07 |
| FY2023 | 393.19 | 138.28 | 35.17% | 96.52 |
| FY2024 | 407.81 | 98.50 | 24.15% | 72.71 |
| FY2025 | 346.45 | 64.11 | 18.50% | 16.41 |
| H1 2026 | 160.73 | 30.54 | 19.00% | 31.11 |
Revenue went from KRW 355.87bn in 2022 to KRW 346.45bn in 2025, down 2.65%. Operating margin went from 35.32% to 18.50%, a fall of 16.82 percentage points. Profit attributable to owners went from KRW 86.07bn to KRW 16.41bn, down 80.93% (16.41 divided by 86.07, minus one). An 18.9% lift on the lower half of that division does not cover a top half that does this.
Inventory behind Dentium stock now sits three times as long
The balance first. Inventory closed 2022 at KRW 100.76bn (USD 72.9m) and closed 2025 at KRW 204.45bn (USD 147.9m), a rise of 102.91% (204.45 divided by 100.76, minus one). At the end of June 2026 it stands at KRW 233.01bn (USD 168.6m). Revenue fell 2.65% over the period that doubled the stockpile.
The measure I actually use is time, not size. Days of inventory on hand, taken second quarter against second quarter so that seasonality cannot explain it, runs 77.9, 99.3, 111.0, 198.0 and 237.3 from 2022 to 2026. Implant fixtures are a stocked product; distributors hold reference inventory in many sizes, so a rising balance is not automatically a problem. A tripling of holding time against flat revenue is a trend, not a season.
Where the money for that inventory went
Capital expenditure in 2025 was KRW 53.00bn (USD 38.3m), 2.9 times the KRW 18.28bn spent in 2024. The company raised capital spending by that much in a year when annual revenue fell 15.05% and operating profit fell 34.91% against 2024. Free cash flow for 2025 came to negative KRW 39.76bn (USD 28.8m), which is operating cash flow of KRW 13.24bn less capital expenditure of KRW 53.00bn.
Operating cash flow as a share of operating profit ran 37.4% in 2022, 47.0% in 2023, 37.0% in 2024 and 20.7% in 2025. One fifth of the accounting profit arrived as cash in 2025. I read the cash line and the inventory line as two views of one event.
The one line that changed in the first half of 2026
This is the section I spent longest on. Operating cash flow for the first half of 2026 was KRW 30.43bn (USD 22.0m) against operating profit of KRW 30.54bn for the same period. That ratio is 99.63%. In the first half of 2025 the same ratio was 8.84%, which is KRW 2.22bn against KRW 25.12bn. Of the five periods I laid out above, the first half of 2026 is the only one where the cash line and the profit line effectively met.
Capital expenditure of KRW 25.27bn still left free cash flow positive at KRW 5.15bn (USD 3.7m), against negative KRW 17.72bn in the first half of 2025. Taken alone this line argues that the stockpile has begun converting.
What holds me back is that it is two quarters long and the four years before it point the other way. I do not let one half-year overwrite four years. I stopped at the same place reading Daejoo Electronic Materials, where half a year of genuine revenue growth did nothing to the multiple the screen was showing.
A global peer trading at three times the forward multiple
For scale outside Korea I use Envista Holdings, the American dental group listed on the New York Stock Exchange under NVST. On the August 25, 2026 close Envista finished at USD 27.47 with a market capitalization of USD 4.41bn on 160.62m shares, which multiplies back to USD 4,412m and confirms the two figures against each other. Trailing twelve-month revenue is USD 2.86bn, trailing net income USD 95.00m, trailing earnings per share USD 0.57, trailing price to earnings 47.85 and forward price to earnings 17.48. Dividing that net income by the share count above gives USD 0.5915 against the published USD 0.57, a gap of 3.77% (0.5915 divided by 0.57, minus one), which is the ordinary distance between a basic count and a diluted one. I use the published USD 0.57.
I picked Envista on one criterion only: it is the closest listed comparison whose earnings are also recovering from a trough, which lets the forward multiples be set side by side. The Korean consensus screen puts Dentium’s 2026 earnings per share at KRW 6,417 (USD 4.64) from five contributing houses, which on the same close is a forward multiple of 5.75 (36,900 divided by 6,417, matching the figure printed on that screen). Envista’s forward multiple is 3.04 times that. I am not claiming the gap should close, and the two companies differ in scale by roughly nineteen times on market value. The gap is the observation, not the conclusion.
The other side of the Dentium stock case, in five places
My reading can be stale, and the case against it is not weak.
One: the half-year numbers have already turned
First-half operating profit of KRW 30.54bn is 21.55% above the KRW 25.12bn of a year earlier. Consolidated net income of KRW 30.95bn is 77.70% above KRW 17.41bn. Revenue grew 1.03% over the same comparison, from KRW 159.09bn to KRW 160.73bn, so the improvement came from margin, not from volume.
Two: four named Korean houses all model a recovery
Korean investment coverage collected in March 2026 lists Kiwoom Securities analyst Shin Min-su at KRW 404.5bn of 2026 revenue and KRW 78.1bn of operating profit, Samsung Securities analyst Jung Dong-hee at KRW 411.0bn and KRW 88.6bn, and LS Securities analyst Cho Eun-ae at KRW 380.8bn and KRW 69.9bn. Daishin Securities analyst Han Song-hyup published KRW 405.0bn and KRW 85.3bn in December 2025. The range for 2026 operating profit runs KRW 69.9bn to KRW 88.6bn, and every one of them sits above the KRW 64.11bn actually earned in 2025.
Three: on forward figures the shares are already cheap
The 5.75 forward multiple above is the shortest form of this argument. The same consensus screen carries an average valuation of KRW 66,800 (USD 48.32), which sits 81.0% above the KRW 36,900 close I am using (66,800 divided by 36,900, minus one). I do not adopt that valuation as my own. I record that five contributing houses hold it.
Four: my own measure has already turned
Days of inventory on hand fell from 290.6 in the first quarter of 2026 to 237.3 in the second. Read across those two quarters alone, the stockpile is clearing.
Five: the share count has one more step to go
The remaining 814,980 shares would cut the count another 9.45%, lifting per-share earnings 10.4% on unchanged profit (8,623,891 divided by 7,808,911, my arithmetic).
What the screen does not tell you about Dentium stock
Copied straight off the data screen, this is a company on 24.89 times earnings with a 2.9% return on equity. But the revenue, operating profit and net income behind that multiple carry a trailing-twelve-month label while matching the 2025 full-year filing to the last unit: KRW 346,451m, KRW 64,110m and KRW 16,327m. Adding the four most recent discrete quarters myself gives revenue of KRW 348.09bn, operating profit of KRW 69.53bn and profit to owners of KRW 30.12bn. Dividing the same close by the resulting KRW 3,493 of earnings per share gives a trailing multiple of 10.56.
I am not arguing for one of those over the other. The screen’s earnings per share of KRW 1,482.52 is flagged as computed from price divided by the multiple, which makes it circular, and I have seen the same construction before while writing up Woori Technology. So I kept every screen multiple out of the judgment above and reached my position on inventory, cash and the impairment alone. The payout ratio has the same defect: the 40.5% shown is KRW 600 of dividend divided by that circular earnings figure (600 divided by 1,482.52 is 40.47%), while dividing the dividend by profit actually attributable to owners gives 31.53%. The screen also describes five consecutive years of dividend growth when the filed history shows KRW 600 in both 2024 and 2025.
Two book-value figures that do not agree
The same screen carries a price-to-book of 0.70 built on book value per share of KRW 52,533, which multiplies out to KRW 453.04bn of equity. Equity attributable to owners at the end of June 2026 is KRW 596.09bn (USD 431.2m) as filed, which on 8,623,891 shares is KRW 69,121 per share and a price-to-book of 0.534 on the close I am using. I could not reconstruct the screen’s figure from any equity balance in the filings, so I use the filed one and flag the gap here.
Two other lines do reproduce and are worth keeping. Interest cover of 2.70 is first-half operating profit of KRW 30.54bn over first-half interest expense of KRW 11.31bn, which checks out; the composition of that expense account is not something I could confirm, so I treat the ratio as directional. And the interest line itself grew: KRW 26.40bn for 2025 against KRW 14.54bn for 2024, a rise of 81.6% (26.40 divided by 14.54, minus one) in a year when revenue fell. A company funding both a doubled stockpile and its heaviest capital expenditure in four years is the shape that produces that.
Where I stand on Dentium stock and what would end it
Watching. Four conditions would retire that position. First, nine-month 2026 operating cash flow back above 80% of nine-month operating profit. Second, days of inventory on hand below 198.0, the second-quarter 2025 reading, by the end of the third quarter. Third, no further impairment recognized against the Shanghai manufacturing entity in the third-quarter report. Fourth, the remaining 814,980 shares confirmed canceled by filing. The Q3 2026 report is legally due November 15, 2026, which falls on a Sunday, so it will arrive after that date.
One more piece of the price record, because it is the part I found hardest to argue away. The shares closed at KRW 43,850 on August 11, 2026 and at KRW 36,900 on August 25, a fall of 15.85% across nine sessions. The half-year report was filed on August 14, when the close was KRW 40,700, and the six sessions after that filing took the price down 9.34%. The report those sessions were reacting to is the one where operating profit rose from KRW 25.12bn to KRW 30.54bn and consolidated net income rose from KRW 17.41bn to KRW 30.95bn.
Separating the numbers I built from the numbers I was given
I want to close by sorting the figures above by who produced them, because leaving them mixed would let my arithmetic read like company disclosure.
Filed by the company: annual and quarterly revenue, operating profit, net income, equity, inventory, operating cash flow and capital expenditure; the KRW 600 dividend; the first-half 2026 report filed August 14, 2026.
Reported by Korean press: the 1,629,959 shares canceled and the KRW 79.38bn figure; the 2,444,939-share announcement of August 2025 and its three-year schedule; the KRW 22.0bn non-operating loss and the Shanghai manufacturing impairment; the quarterly revenue split by region.
Published by brokerages: the four 2026 revenue and operating profit estimates; the consensus earnings per share of KRW 6,417 and the average valuation of KRW 66,800.
Built by me: the pre-cancellation count of 10,253,850, the 1.189 share-count factor, the 814,980 remainder, the five inventory-days readings, the five cash-to-profit ratios, the 10.56 trailing multiple, the 31.53% payout, the KRW 318.22bn market capitalization, and every dollar figure on this page. All of it is arithmetic on the two paragraphs above it.
Not confirmed: the February 2, 2026 cancellation filing itself, the scheduled cancellation date, the impairment amount as worded in the original filing, and the reference date behind the 399,007 treasury shares shown on the company-data screen. Those stay blank.
Sources behind this entry
- Korean company-data screen for Dentium, giving 8,623,891 shares outstanding, 399,007 treasury shares, KRW 318.2bn market capitalization, and the 2026 consensus of KRW 6,417 earnings per share and KRW 66,800 average valuation from five houses, as of August 25, 2026
- Korean press report of the August 2025 announcement to cancel 2,444,939 treasury shares
- Bloter report on the 1,629,959 shares canceled and related-party purchases, March 2026
- Korean business press on the fourth quarter of 2025 and the Shanghai manufacturing impairment, March 2026
- Korean investment press summary of Kiwoom, Samsung and LS estimates, March 2026
- Korean capital-markets press on the Daishin Securities estimates, December 2025
- A Korean research-summary site carrying the same Daishin Securities note. It repeats the December 2025 material without adding to it, so I count the two as one independent source.
- Envista Holdings key statistics, August 25, 2026 close
- Financial statements are consolidated figures as filed with Korea’s electronic disclosure system, half-year 2026 receipt 20260814002940 and full-year 2025 receipt 20260401003696. Price and holding data come from a Kiwoom feed on the August 25, 2026 close. Where a Korean source is quoted the wording is my paraphrase in English, not a translation of a published quotation.
- Currency conversions use KRW 1,382.4 to one US dollar, the Seoul close for August 24, 2026 as carried in a Korean bank’s August 25, 2026 currency note. That is one session behind the equity close used throughout, and every dollar figure on this page uses that single rate.
- SK Networks Divestiture: What Is Left to Earn After the Sale
- Insun ENT Valuation: Clean Harbors Margins at an Enviri Price
- Hanmi Pharmaceutical Q2 Earnings and the Beijing Hanmi Slump