Exicon First Half: Profit Reported, Operating Cash Flow Negative
Exicon stock closed at 42,950 won on September 23, 2026, which puts the company at about 560.5 billion won of market value (roughly $413 million). From January to June it reported 8.52 billion won of net profit, and over the same six months its operating cash flow was minus 8.31 billion won. I do not own the shares, and this entry is about the gap between those two lines.
- ☑ Net profit, January to June 2026: 8.52 billion won
- ☑ Operating cash flow, same six months: minus 8.31 billion won
- ☑ Inventory, end of December to end of June: 28.94 to 46.49 billion won
- ☑ Trade receivables, same dates: 5.74 to 13.58 billion won
- ☑ Borrowings, same dates: 14.75 to 21.75 billion won
- ☐ Which income lines carried profit above the operating line (notes not opened)
- ☐ Whether the stock of goods turns into cash between July and December
My stance is watch only. The company is earning on paper and spending in cash, and I want to see the July to December cash line before I decide whether that is a timing issue or a pattern.
I first looked at this name in late 2024, when it was a loss-making memory tester maker on KOSDAQ, and I passed. Since then Exicon stock has climbed to more than four times its lowest close of the past year. When a price moves like that, the first place I go is not the income line but the cash line, because a tester maker that sells a few large machines a year can show profit long before customers pay for them. That is what I found here, and the pattern goes back further than this year.
Contents
Exicon Stock and Six Months That Paid Out Cash
Exicon is a Korean maker of test equipment for memory chips and solid state drives. It is listed on KOSDAQ, the Korean exchange for smaller and growth companies, which sits alongside the main KOSPI board somewhat the way Nasdaq sits alongside the NYSE. Almost all of its disclosed orders this year came from Samsung Electronics.
The six months to June look healthy on the income side. Net profit came to 8.52 billion won (about $6.3 million), and the operating line was positive as well at 2.17 billion won, according to the data I pulled from the Exicon quarterly income table on stockanalysis, which is built from DART, Korea’s electronic disclosure system.
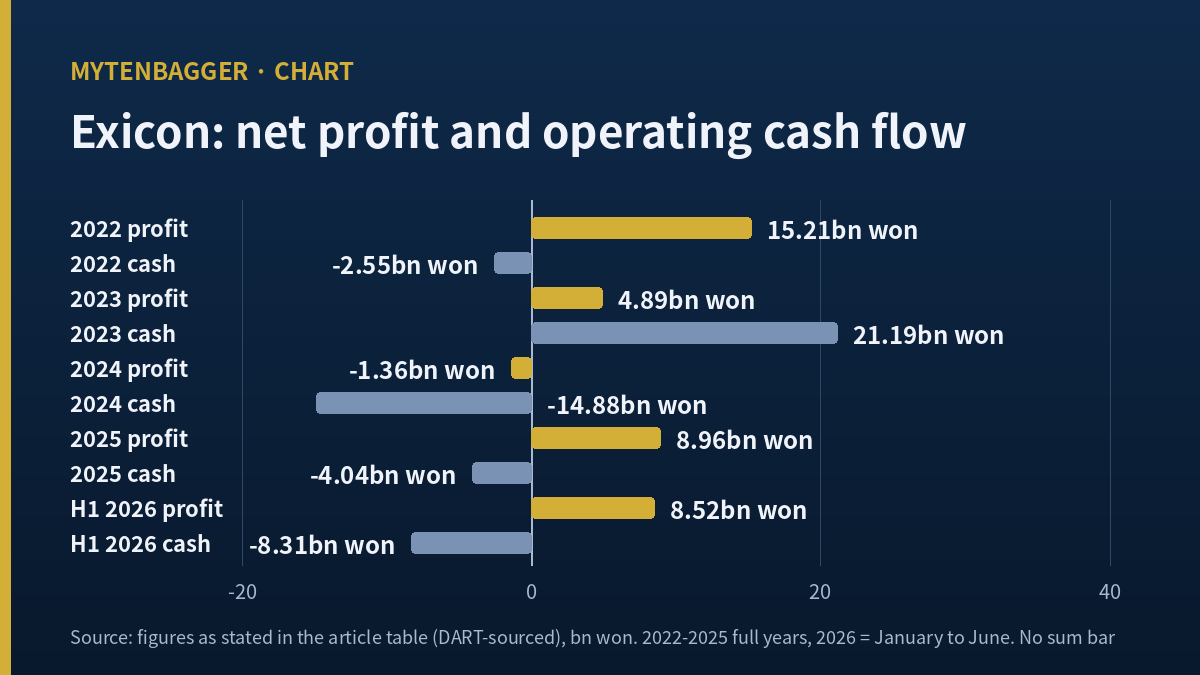
The cash side reads the other way. Operating cash flow for the same six months was minus 8.31 billion won (about $6.1 million out), according to the DART-sourced cash figures in the Kiwoom data feed I use. Put the two lines side by side and every won of reported profit came with close to a won of operating cash going out. Dividing one by the other gives minus 97.5 percent, by my arithmetic.
I do not treat one six-month period as a verdict. Equipment makers often ship in one period and collect in the next. So before drawing anything from this, I went back four years and six months.
Exicon Stock Since 2022: Profit and Operating Cash, Year by Year
Here are the annual group-level figures for net profit and operating cash flow, in billions of won, taken from the same DART-sourced feed and checked against the annual figures shown by Korea Economic Daily’s annual figures page.
| Period | Net profit (bn won) | Operating cash flow (bn won) |
|---|---|---|
| 2022 | 15.21 | -2.55 |
| 2023 | 4.89 | 21.19 |
| 2024 | -1.36 | -14.88 |
| 2025 | 8.96 | -4.04 |
| January to June 2026 | 8.52 | -8.31 |
| Sum, 4.5 years | 36.22 | -8.58 |
Sources: DART group-level figures via the Kiwoom data feed, annual net profit matched to Korea Economic Daily. The sum row is my own addition. USD values in the text use roughly 1,358 won per dollar.
Over those four years and six months Exicon reported 36.22 billion won of net profit, and its operating cash flow over the same stretch added up to minus 8.58 billion won. Only one year, 2023, produced more operating cash than profit, and that was a year when sales fell. Every other year that showed a profit showed operating cash going out. The clearest case is 2022, the best profit year in the table at 15.21 billion won. It was also a year of negative operating cash. The company’s strongest earnings year did not bring cash in, and a year of falling sales, 2023, did. For a business like this, I have come to treat a profitable year and a cash-generating year as two separate events that rarely fall on the same twelve months.
That is the part that changed my reading. If this were a one-off timing issue, I would expect the years to alternate more evenly. The cash has mostly lagged, and the one year it caught up was a shrinking year. It suggests that when this company grows, growth itself eats cash, and the cash comes back only when growth stops.
Where the Cash Went: Inventory First
To see where the money went this year, I compared the balance sheet at the end of December 2025 with the one at the end of June 2026, using the line items on the Valueline Korea balance sheet page for Exicon.
Inventory rose by 17.55 billion won
Inventory went from 28.94 billion won to 46.49 billion won, a rise of 60.6 percent in six months. That single line absorbed about twice the operating cash that left the company. At the end of June, inventory made up 18.5 percent of everything on the balance sheet, against 12.9 percent six months earlier, by my arithmetic.
For a tester maker this is not unusual by itself. Machines are built ahead of delivery, and orders disclosed in the spring and summer have to be assembled before they can be handed over. Still, inventory is where cash sits when it has not yet become revenue, and a 60 percent jump in six months is a large bet that the deliveries arrive on time.
Borrowing covered part of the gap
Borrowings rose from 14.75 billion won to 21.75 billion won, an addition of 7.00 billion won. Cash and cash equivalents fell from 45.82 billion won to 35.89 billion won, while short-term deposits went from zero to 5.00 billion won. Adding the two, the company’s liquid pile shrank by 4.93 billion won over the six months. Total liabilities grew from about 28.8 billion won to 47.88 billion won.
None of this is alarming in size. Equity at the end of June was 202.94 billion won, and liabilities are less than a quarter of that. The balance sheet can carry several more periods like this one. What I am watching is direction: in six months the company took on debt and ran down cash while reporting a profit.
I have seen the same sequence at other Korean chip equipment names. When I looked at how Wonik IPS stock ranked against seven peers on forward multiple and return on equity, the lesson there was that a low price can reflect weak returns on the capital already tied up. Exicon’s case is the mirror image: a high price that assumes the capital now tied up in stock and receivables comes back as cash soon.
Exicon Stock and the Receivables That More Than Doubled
Trade receivables rose from 5.74 billion won to 13.58 billion won, 2.37 times the December figure. Together with inventory, the two lines absorbed 25.39 billion won of cash over six months, three times the operating cash outflow, by my arithmetic. Other movements, including profit itself, filled the rest.
Receivables from a single large customer are not the same risk as receivables from many small ones. Samsung Electronics will pay. The question is only when. And because the customer is so large relative to Exicon, the timing is Samsung’s decision more than Exicon’s. A delay of one quarter on a few machines can move the operating cash line by several billion won either way.
This is also why I do not read the jump in receivables as a warning on its own. A company that just delivered a batch of machines in June should have more receivables at the end of June. The test comes in the July to September figures, when some of that 13.58 billion won should turn into cash. Other Korean chip suppliers have taught me to ask who a balance sheet line really belongs to. When I looked at why Hana Micron stock owns only two thirds of the equity it reports, the answer was minority partners abroad. Here the question is simpler: when does this money come home?
Exicon Stock Profit That Sits Below the Operating Line
There is a second gap in the six-month figures. Net profit of 8.52 billion won is almost four times the operating line of 2.17 billion won. Something below operating profit added about 6.35 billion won. The same thing happened in 2025, when operating profit was close to zero (0.08 billion won) and net profit was 8.96 billion won.
I could not open the notes to the six-month report on this pass, so I cannot say which income line carried the difference. The Kiwoom feed itself flags it: its quality check marks Exicon with a note that net profit exceeds five times operating profit and may include one-time gains. What I can see is two lines on the balance sheet that moved in the same direction as the gap.
The stake in affiliated companies
Investments in associates, meaning companies in which Exicon owns a meaningful minority stake, rose from 37.74 billion won at the end of 2024 to 41.58 billion won at the end of 2025 and 46.72 billion won at the end of June 2026. The six-month rise of 5.14 billion won is close to the 6.35 billion won gap between net profit and operating profit. That could mean Exicon recorded its share of an affiliate’s earnings. It could also mean the company put in new money. Without the notes I cannot separate the two, so I do not treat the associates line as a source of profit.
The deferred tax line
Deferred tax on the balance sheet rose from 12.19 billion won at the end of 2024 to 16.36 billion won at the end of 2025, and to 17.15 billion won at the end of June. When a company records a tax benefit it expects to use later, it can lift net profit without any cash coming in. The 2025 rise of 4.17 billion won is large next to an operating profit of 0.08 billion won. Again, I cannot confirm this from the notes, and I note it as a line to check. It is not yet a finding.
Whichever line it turns out to be, neither is the kind of profit that pays for the next batch of machines. The company’s cash comes from delivering testers and collecting on them. That is the only line that matters for whether the current price holds.
Exicon Stock Next to Teradyne’s Cash Record
For a US reader, the obvious comparison is Teradyne (NASDAQ: TER), one of the two large makers of semiconductor test equipment. I am not comparing size, valuation or growth. I am taking one ratio from the same six months.
Teradyne reported net income of $398.91 million for the quarter ended March 29, 2026 and $374.53 million for the quarter ended June 28, 2026, for a total of $773.44 million. Its operating cash flow over the same two quarters was $265.12 million and $469.14 million, a total of $734.26 million, according to the Teradyne quarterly cash flow table on stockanalysis. That is operating cash equal to 94.9 percent of net income, by my arithmetic.
Exicon’s equivalent figure for the same months is minus 97.5 percent. One company turned almost all of its reported profit into cash; the other paid out roughly as much cash as it reported in profit. Teradyne has a broad customer list and sells mature products, so it would be unfair to expect the same result from a small supplier in a build-up year. But the gap tells me how much of Exicon’s story still depends on events that have not happened yet.
Two Ways July to December Can Go
Before I write down what would change my mind, I want both outcomes on the page, with the figures each one would produce. I am not putting odds on them. The disclosed contracts give an end date for delivery and nothing about the month-by-month timing, and that timing decides which branch plays out.
The collection branch. Machines built between January and June go out between July and November, and Samsung pays on normal terms before the year closes. Inventory falls back toward the 28.94 billion won it was at the end of 2025, which by itself would release up to 17.55 billion won of cash. Receivables rise at first and then shrink as payments land. In this branch, operating cash flow for the full year turns positive for the first time since 2023, and the six-month gap I am writing about turns out to be a matter of weeks. The borrowings added this year could be repaid out of the company’s own collections.
The December branch. Most machines leave the factory in the last weeks of the year. Inventory falls, but receivables jump at year end because the invoices go out in December and the money arrives in 2027. Reported profit for 2026 could look strong, because revenue is recognized on delivery, while operating cash for the year stays negative for the third year running. The company would then need either more borrowing or a draw on its remaining 40.89 billion won of cash and deposits to build the next batch.
There is a precedent for each branch in Exicon’s own history. In 2023, when sales fell, the company collected more cash than it earned. In 2025, when sales recovered, most of the growth landed at year end and operating cash was negative. The 2025 pattern is the closer match to 2026 so far.
One more check keeps me honest about the balance sheet. Equity rose by 7.25 billion won over the six months. Net profit was 8.52 billion won, and the company paid a dividend of 100 won a share for 2025, about 1.31 billion won in total, by my arithmetic. Profit minus that dividend comes to 7.21 billion won, within 0.04 billion won of the actual change. So the equity line holds together, and nothing large moved through it outside profit and dividends. The pressure is entirely on the cash side.
What a KOSDAQ Listing Means for This Kind of Story
KOSDAQ names of this size often move on theme news more than on numbers. On September 21, 2026, Korean financial press reported Exicon among stocks that rose on interest in CXL, a memory interface for AI servers, after the company said it had finished developing a CXL tester (Pinpoint News, in Korean). Two sessions later the stock jumped by double digits in a single day to close at 42,950 won, and one Korean price site showed the stock under a market caution flag that day.
Theme money cares about what the next product might sell. My own interest is narrower. It is whether the machines already built and sitting in stock turn into collected cash. A caution flag on the price does not tell me anything about that, and neither does a product that has not yet sold a single unit on the record.
Exicon Stock: Three Points Against My Caution
- The orders are real and large. On July 10, 2026, Exicon disclosed a supply contract with Samsung Electronics for testers running to December 31, worth about three quarters of its 2025 sales, as Korean business press reported (Economy Times, in Korean). If those machines are delivered and paid for by year end, the cash picture can turn quickly.
- Inventory is what an order pipeline looks like before delivery. A rise in stock of goods right after a run of disclosed orders is what I would expect from a company about to ship. Seen that way, the June balance sheet is a pipeline, and the cash line is simply early.
- The one analyst who covers it has been right on the direction. Yuanta Securities analyst Kwon Myung-jun put out an October to December 2025 sales estimate in a January 8, 2026 note, as reported by the Korean outlet Etoday, and the actual figure came in above it. I found no named brokerage estimate for 2026 profit in this round of research, and no price objective either.
I take all three seriously. My caution is not that the business is weak. It is that the price has already moved as if the cash question were answered, and the figures that answer it arrive in November.
Nine Things That Would Change My View
I would move from watching to considering a position if the next report shows most of these. I would stay away longer if it shows the opposite.
- Operating cash flow for January to September 2026 turns positive.
- Inventory at the end of September is below 46.49 billion won.
- Trade receivables at the end of September are below 13.58 billion won.
- Borrowings stop rising above 21.75 billion won.
- Cash and short-term deposits recover above 40.89 billion won, their level at the end of June.
- The notes identify the income line behind the 6.35 billion won gap, and it is recurring.
- The associates line is explained by earnings, with no new money put in.
- A second customer appears in a disclosed supply contract.
- The price gives back part of the September run before the report, so that I am not paying for good news twice.
The first three matter most. If inventory and receivables fall while the operating cash line turns positive, the June balance sheet was a pipeline. If they keep rising, the growth is still being paid for out of the company’s own pocket.
Exicon Stock and What I Will Check on November 16
The report for July to September is due by November 16 (Mon), 2026 under Korean disclosure rules. I will open the cash flow table first, then inventory and receivables, then the notes on associates and deferred tax. Only then will I look at the income line.
The other name where I watched the same two lines part is Hana Tour, where cash left in the second quarter while profit stayed on the income statement. Different industry and a different reason, and I did not merge the two sets of figures. Reading them one after the other is what taught me to open the cash flow table before the income statement.
An income line was the first thing I trusted when I looked at this company in 2024. I saw a loss and walked away; now I see a profit and I am tempted to walk back in. Both times the income line was the wrong place to start. In 2024 the loss hid a gross profit rate that was about to recover. In 2026 the profit hides cash going the other way. I am writing this down so that in November I read the cash line before anything else.
If the July to September cash line comes back positive, I will say plainly in this journal that the June balance sheet was a pipeline and that my caution cost me part of a move. If it does not, I will have avoided paying 42,950 won a share for profit that had not yet reached the bank.
Prices reflect the September 23, 2026 close (42,950 won, confirmed on Kokstock). Market value is the close times the number of listed shares in the Kiwoom feed, an approximate figure. USD values are approximate, at roughly 1,358 won per dollar on the same date. Balance sheet lines are from Valueline Korea; profit and cash lines from DART-sourced data; sums and ratios are my own calculation.
Related reading
- Korea’s PHA: 40% of Pre-Tax Profit Is Below the Operating Line
- Nature Cell Convertible Bond Pricing After an 8-Year Court Win
- Shinheung SEC Debt: Interest Costs Run 3.4x Its Profit