
Wonik IPS Stock Has the Lowest Forward Multiple and Lowest ROE
Contents
Wonik IPS stock and the eight-row table I built
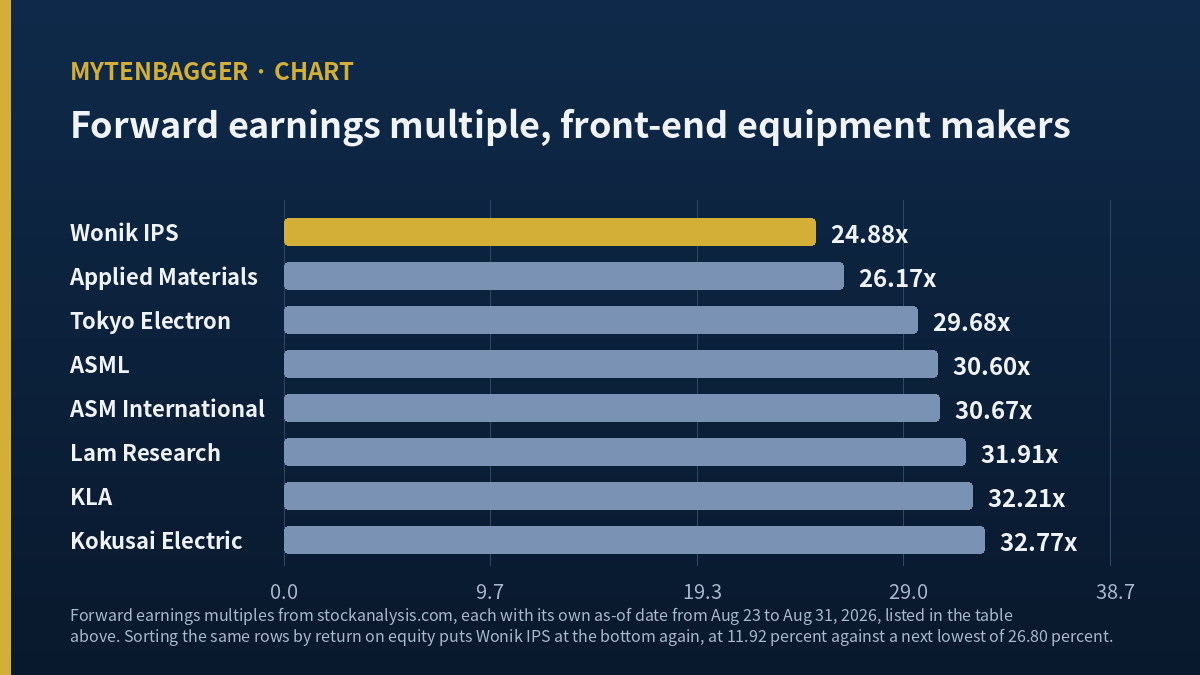
I built a table of eight semiconductor equipment makers, pulled every figure from one provider on close-to-matching dates, and then sorted it twice. The first sort was by forward earnings multiple, cheapest at the bottom. The second was by return on equity, weakest at the bottom. Wonik IPS stock finished at the bottom of both.
That is the finding, and I want to state it plainly before I decorate it: the company that looks least expensive on next year’s earnings in this group is also the company that turns the least profit on its own capital. I had expected the cheap name to be cheap for a reason I would have to go dig up. The reason was sitting in the next column.
What the two columns do when you sort them
| Measure | Wonik IPS | Where it sits among the eight |
|---|---|---|
| Trailing earnings multiple | 48.79x | Middle of the group (range 37.76x to 59.84x) |
| Forward earnings multiple | 24.88x | Lowest of the eight (next is 26.17x) |
| Price to book | 5.50x | Lowest of the eight (next is 9.09x) |
| Return on equity | 11.92% | Lowest of the seven that show one (next is 26.80%) |
All four figures come from stockanalysis.com. The Wonik IPS row is dated August 28, 2026, and the peer rows carry their own dates, which I list further down because they are not all the same day.
What Wonik IPS stock actually owns
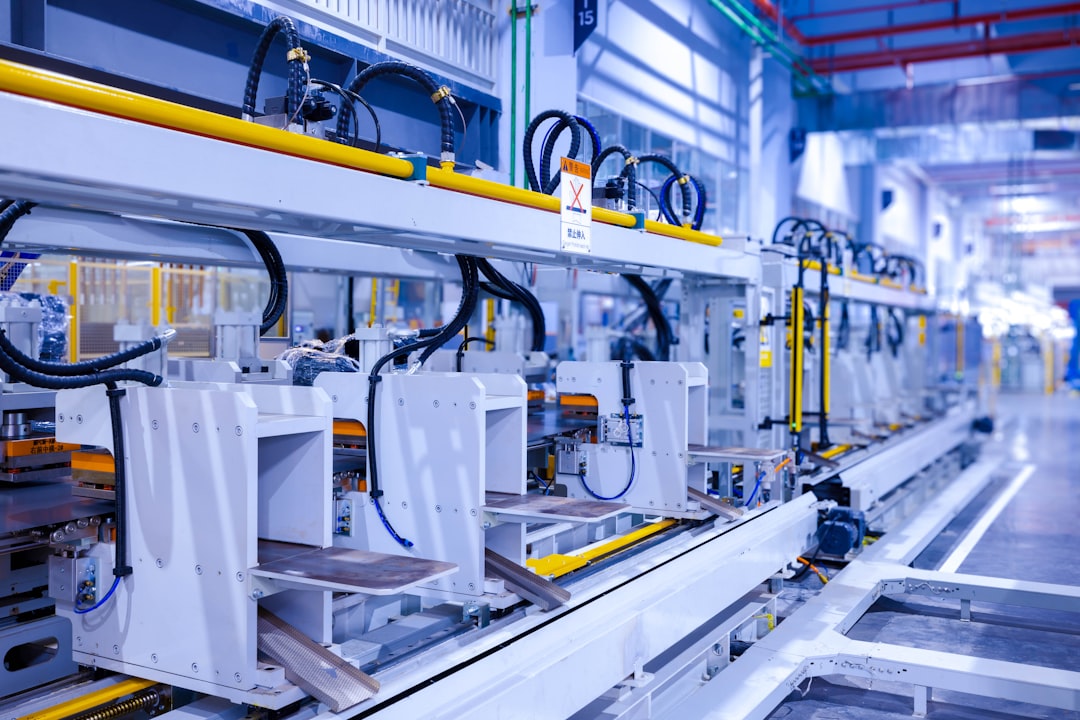
Wonik IPS makes front-end deposition equipment, the tools that lay down thin films on a wafer one layer at a time. Its customers are memory fabs. Two of them dominate its backlog, and both of them are Korean, which matters later in this note when I get to what a US reader is actually buying.
Deposition, and why taller NAND changes the demand
The company has said in public that atomic layer deposition becomes unavoidable once NAND stacks pass three hundred layers, and that it can feel the pull for those tools already. That statement is from a Korean trade outlet covering a February 2026 industry exhibition, so I am relaying a translated remark and not quoting an English original. I treat it as a directional claim from the seller of the tool, which is exactly the kind of claim that needs a second source before it earns weight in my thinking. I did not find that second source, so I am leaving it as context and not as evidence.
What KOSDAQ means if you have never held a Korean name
Korea runs two main boards. KOSPI holds the large industrials and the banks. KOSDAQ, where this company trades under the code 240810, is the smaller and more volatile board, closer in character to a growth exchange than to a main market. A KOSDAQ listing carries no warning by itself. It does mean thinner index membership, and it is one reason a US brokerage screen may show you nothing at all when you type the name in.
The peer table, one provider, one date each
Here is the group, with every figure taken from stockanalysis.com and each row carrying the date that provider had refreshed when I pulled it. I did not mix providers. Mixing them is how a peer table quietly becomes fiction.
| Company | Trailing P/E | Forward P/E | Price to book | Return on equity | As of |
|---|---|---|---|---|---|
| Applied Materials | 39.82x | 26.17x | 14.30x | 41.07% | Aug 31, 2026 |
| Lam Research | 52.41x | 31.91x | 30.29x | 65.07% | Aug 31, 2026 |
| KLA | 47.96x | 32.21x | 36.13x | 87.50% | Aug 31, 2026 |
| ASML | 54.89x | 30.60x | 26.76x | 53.94% | Aug 31, 2026 |
| ASM International | 37.76x | 30.67x | 9.09x | 26.80% | Aug 29, 2026 |
| Kokusai Electric | 59.84x | 32.77x | 9.25x | not shown | Aug 29, 2026 |
| Tokyo Electron | 40.08x | 29.68x | 11.52x | 30.93% | Aug 23, 2026 |
| Wonik IPS | 48.79x | 24.88x | 5.50x | 11.92% | Aug 28, 2026 |
Scale belongs in the reading too. Four of these companies report a market value in dollars at that provider: ASML at $666.04 billion, Lam Research at $377.06 billion, Applied Materials at $362.98 billion and KLA at $228.04 billion. Wonik IPS is carried at 5.41 trillion won, which at the exchange rate in my closing note is roughly $3.95 billion. The largest of the four dollar-reported names is therefore about 168 times its size, by my calculation. That gap is worth holding in mind while reading the return column, because a supplier selling into two customers in one country will not earn on capital the way a supplier selling into every fab on earth does. Some of the 11.92% is a description of how big this company is.
Where the dates disagree
Seven of the eight rows sit inside a four-day window. Tokyo Electron is the outlier at August 23, 2026, eight days behind the freshest rows, and I am flagging it instead of dropping it, because dropping a name to tidy a table is its own kind of editing. Kokusai Electric does not show a return on equity at that provider at all, so the return column really covers seven names; I have written every sentence below that way.
A second provider, a different definition, the same floor
A single provider’s return figure is a single provider’s arithmetic, so I checked the number against a Korean market data vendor before I built an argument on it. That vendor computes this company’s return on equity as 9.1% for the last closed financial year, and I was able to reproduce it: it divides profit attributable to owners by the average of opening and closing owner equity, where the other one uses the closing balance alone. Two divisors, two figures, one conclusion. Whether the answer is 11.92% or 9.1%, it sits far below the 26.80% that is the lowest return anywhere else in my table. I care about that more than I care about which of the two figures is correct, because a finding that survives a definition change is a finding I can lean on for at least one more step.
The comparison I refused to build
I wanted a revenue growth column too. I did not build one. Three of these companies report on fiscal years that do not end in December, and putting a Japanese fiscal year next to a Korean December year-end in the same column produces a number that looks comparable and is not. So the table has four measures instead of five, and the missing fifth is a decision I made; I did not forget the column.
A capital spending number landed on August 10, 2026
On Monday, August 10, 2026, as Korean financial press reported that day, SK Hynix confirmed two domestic fab investments in a single filing: about 35.2 trillion won for the Yongin Y2 site and about 19.1 trillion won for the Cheongju M17 site, roughly 54.3 trillion won in total. Korean equipment names moved together that day. For a company whose backlog leans on two domestic memory customers, a confirmed multi-year build is the closest thing to visibility this industry offers.
What that filing does not settle
It does not say who supplies which tool, or when. A fab announcement fixes the size of a future pot and says nothing about the shares. I have seen enough Korean equipment cycles to know that the gap between an announced fab and a booked tool sale runs years, and that the announcement is priced long before the purchase order exists. So I file this as a reason the group re-rated in August, and not as a reason my own return-on-equity problem goes away.
Wonik IPS stock climbed all summer and gave it back
I do not want the peer table to imply a calm chart. The share price closed at 111,500 won on Monday, August 31, 2026, and getting there was not quiet. On Wednesday, July 1, 2026 it closed at 165,600 won. On Tuesday, July 28, 2026 it closed at 89,500 won, a fall of 45.95% in under four weeks, by my calculation. On Thursday, August 13, 2026 it was back at 120,000 won.
The July drop had a cause outside this company. A large Chinese memory maker listed, and a Chinese effort to localize lithography equipment drew attention the same week, and Korean memory names and the equipment names attached to them fell together. None of that changes what Wonik IPS builds. A separate Wonik group listing, the quartz component maker Wonik QnC, gave me a different reading problem in the same industry: its own filing split one quarter two ways and the two splits do not add to the same total, which I worked through in Two Ways to Split One Quarter at Wonik QnC. All of it changes what people were willing to pay for a Korean memory supplier in the last week of July.
Three averages, three different answers
The averages tell the same story more calmly. Against its 20-day average of 106,340 won the price sits 4.85% high. Against its 60-day average of 123,325 won it sits 9.59% low. Against its 120-day average of 121,668 won it sits 8.36% low. Short term recovering, medium term still underwater. I have no interest in trading that pattern, but I do want it on the record, because a peer multiple pulled on one day of a chart like this is a snapshot of a moving thing.
Why no house valuation figure appears in this note
Five named Korean brokerages have published on this company inside the last twelve months, and several of them print a specific number they think the shares are worth. I am not reproducing any of those numbers. A valuation figure is somebody’s conclusion, and I cannot check a conclusion; I can only check the inputs that produced it. The one input I will use is the aggregated 2026 revenue estimate carried at stockanalysis.com, about 1.30 trillion won across fourteen contributing analysts as of August 28, 2026, because that is a quantity I can hold against a reported result later and see who was right.
The other side of my reading of Wonik IPS stock
I have four objections to my own reading here, and they run below in the order of how much weight I give them.
Four things that would move me off this reading
- Return on equity is a trailing measure and this is a cyclical business. A company at the trough of a memory capital cycle will print a poor return on capital and then print a very good one two years later without changing anything about itself. If the 11.92% marks a cycle position and not a permanent level, my argument softens considerably. And the trough case is not hypothetical here. This company reported an operating loss for its 2023 financial year and only a slim profit for 2024, so the stretch of history feeding the trailing return column contains a genuinely bad patch. A reader who thinks the memory equipment cycle is turning up should treat my return column as the rear-view mirror it is.
- The forward multiple already assumes a recovery. Forward 24.88x against trailing 48.79x means the contributing analysts expect earnings to roughly double. So the low forward figure is not the market calling this company cheap; it is the market accepting a specific forecast. If that forecast lands, the multiple was right. If it does not, the forward column in my table was never real. Fourteen analysts feed the aggregate I am reading, which is enough contributors that the figure is not one person’s opinion, and not so many that a single influential revision cannot move it. I would treat a change in that aggregate as news about the analysts before I treated it as news about the company.
- Seven names is a small sample and the seven are not equals. Applied Materials, Lam Research, KLA and ASML sell into logic and foundry as well as memory, and they sell globally. Wonik IPS is concentrated in memory and concentrated in one country. A return on equity gap between a diversified global supplier and a concentrated domestic one partly describes scale and only partly describes quality.
- Kokusai Electric has no return figure at my provider. That name is the closest peer by product mix in the whole group, and it is the one row where my key column is blank. If Kokusai’s return sits near the bottom too, then “lowest of seven” describes a product category and not this company, and my finding shrinks.
I have looked at Korean chip supply names enough times to know the failure mode here. When I compared a materials supplier against two different benchmarks earlier this year, the answer changed depending on which comparison I ran, and I nearly wrote the wrong conclusion. And when I looked at a Korean tool maker with a dominant share of one bonding market, the share was real and the earnings still went the other way. Both notes taught me the same thing about this industry, which is that position and profitability come apart more often than the sector’s own storytelling admits.
Access, if you are reading this holding dollars
There is no US-listed American depositary receipt for this company. To own the shares you need a broker that routes to the Korean exchanges directly, and you need the KOSDAQ board specifically, which is a smaller set of brokers than the one that will sell you a Korean large cap. What I can say is that I found no path to this specific company that does not involve a Korean-market brokerage relationship.
The tools do not arrive in a US fab
Here is the part I find more interesting than the paperwork. This company’s equipment goes into Korean memory fabs, and the August capital spending confirmation that moved the group was a Korean domestic build. So for a US reader this is not proxy exposure to the American capital spending cycle you already read about in your own market. It is exposure to a different country’s memory build, denominated in a currency you do not hold, on a board your broker may not reach. Three separate distances, and only one of them is about the company.
Where I stand on Wonik IPS stock, and how a rebuttal would reach me
My position
I do not own it, I have no order working, and I am watching. The company is outside the top hundred by value on its market, which is where my default is to watch and not to buy. But the default is not why I am watching this one. I am watching because I built a table to find out whether a discount was an opportunity, and the table answered a different question than the one I asked. It told me the discount has a matching number in the return column, and until I can explain why that number should move, buying the discount would just be buying the return.
The document that would tell me I was wrong
Nobody is going to tell me I got this wrong. There is no announcement for it. So I am naming the place a rebuttal would appear, and the place is the same table I built.
If I reload that provider’s page for this company and the trailing return on equity has moved above the current group floor of 26.80%, my reading is finished and I should start again from the beginning. If it sits where it is now while the forward multiple falls further, the gap I described is widening instead of closing, and I would want to know why before I did anything at all. Either way the signal arrives as a refreshed cell in a table nobody sends me. I have to go and look. Writing down which cell means I know where to look, and it means I cannot quietly forget that I named one.

Prices and multiples in this note reflect the close of Monday, August 31, 2026 as checked at the time of writing, and this piece may reach you later than that, so live quotes can differ. Korean won is the reference currency throughout; where a dollar figure would help, roughly 1,368.6 won bought one dollar at the Seoul market close on that same date, an approximate rate reported by Korean financial press and used here only for scale. Multiples and return figures for all eight companies come from stockanalysis.com, with the peer rows drawn from the same provider’s pages for Applied Materials, Lam Research, KLA, ASML, ASM International, Tokyo Electron and Kokusai Electric. The Korean capital spending confirmation was reported by Seoul Economic Daily, the summer move in Korean equipment shares by its English edition, and the July selloff in Korean memory names by YTN. Company filings are listed on the issuer’s own disclosure page, which is in Korean. Daily closing prices and moving averages are my own, computed from the exchange series.