Insun ENT Stock: A Margin Like Clean Harbors, a Price Like Enviri
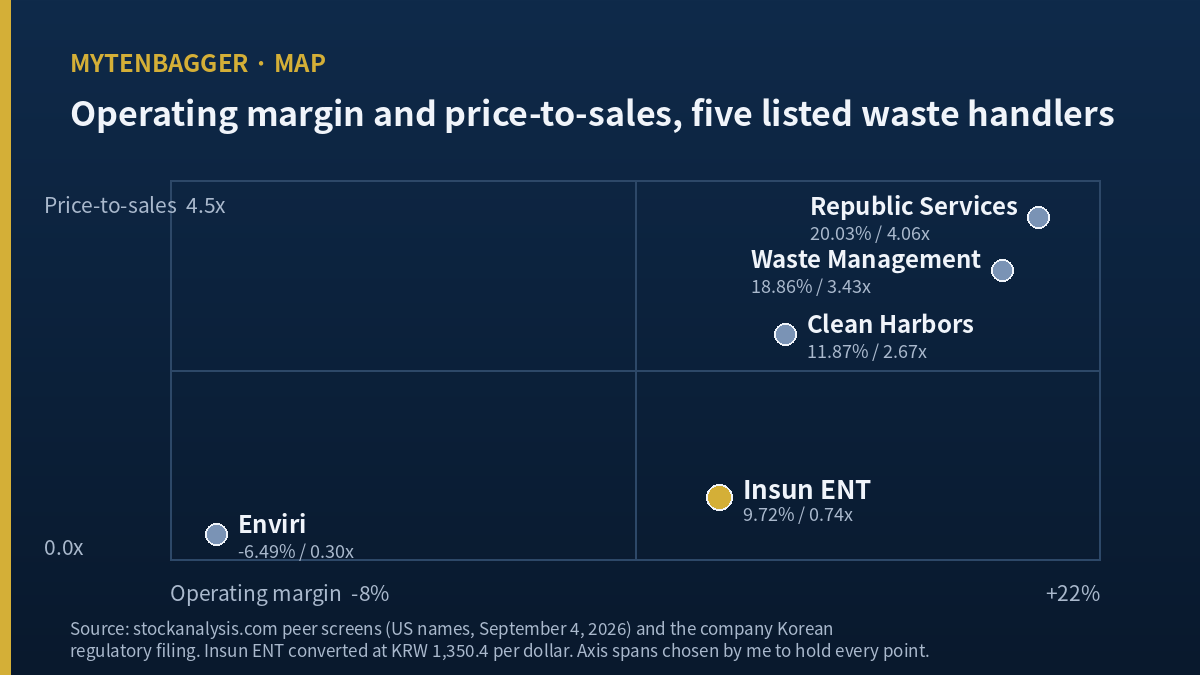
I keep a short list of companies where two ordinary valuation measures put the same business in very different places, and Insun ENT stock went onto that list the afternoon I built the peer table below. Measured by operating margin, this Korean waste handler sits close to Clean Harbors. Measured by what the market pays for each unit of its revenue, it sits close to Enviri, a company that currently reports no operating profit at all. Both statements come from the same five rows. I spent most of this piece trying to work out which of the two I should believe.
Contents
What I counted on Insun ENT stock at the September 4, 2026 close
| What I checked | What I found |
|---|---|
| Price-to-sales | 0.74x, against 2.67x to 4.06x for three profitable US peers |
| Operating margin | 9.72%, which is 2.15 points below Clean Harbors and 16.21 points above Enviri |
| Where the losses sit | Three straight fourth quarters, with positive operating profit in each of them |
| Analyst estimates | None. No rating, no valuation, no forward earnings figure in the last three months |
The screen values I started from
Insun ENT trades on KOSDAQ, the junior board of the Korea Exchange, under the code 060150. KOSDAQ is the smaller of Korea’s two main equity markets, roughly comparable in role to the Nasdaq of the early 1990s: technology and mid-tier industrials, thinner liquidity, and far less analyst attention than KOSPI, the senior board. Insun ENT is majority controlled by IS Dongseo, a Korean construction and materials group, which holds 45.95%.
| Item | Value | Basis |
|---|---|---|
| Close | KRW 3,040 (about $2.25) | September 4, 2026 (Fri) |
| Market value | KRW 138.50bn (about $102.6M) | 45,559,211 shares, by my calculation |
| Revenue, FY2025 | KRW 187.15bn (about $138.6M) | Korean regulatory filing, consolidated |
| Price-to-sales | 0.74x | Trailing four quarters |
| Operating margin | 9.72% | Trailing four quarters |
| Debt to equity | 49.03% | End of June 2026, consolidated |
| Earnings per share | KRW -235 | Trailing four quarters |
| Dividend | Not disclosed; yield 0.00% | Korean vendor screen |
Prices and ratios in this piece reflect the September 4, 2026 close as I checked them at the time of writing. This page may go live later, so live quotes will differ. Dollar figures are approximate, converted once at roughly KRW 1,350.4 per dollar, the Seoul market rate at 3:30 p.m. that same day. Korean won is the reference currency throughout, and the dollar figures exist only so the sizes are legible.
Why I re-measured the 250-day range myself
My data source reports a 250-day high of KRW 4,850 and a low of KRW 2,680, under a field name saying those are adjusted closing prices. They are not closing prices. Walking the daily bars across the same window myself, the highest close was KRW 4,840 on September 12, 2025 and the lowest close was KRW 2,770 on July 29, 2026 (Wed). The intraday low of KRW 2,680 was printed the following session, so even the date changes.
This matters because the derived percentages move with it. On intraday values the stock is 37.32% below its high and 13.43% above its low. On closing prices, measured the same way as the close in my table, those become 37.19% and 9.75%. The gain from the bottom shifts by 3.68 points. I use the closing figures throughout.
What I did not use
The twelve-month change on my screen reads -35.73%, which implies a starting price of KRW 4,730. That is the close from August 22, 2025, not from twelve months before the measurement date. Using the actual September 4, 2025 close of KRW 4,735 gives -35.80%. The gap is only 0.07 points, but once I know the starting date is off I keep the figure out of any argument. The one-month, three-month and six-month changes each traced back to a real session and I used those.
Insun ENT stock on the margin line: a close neighbor of Clean Harbors
Here is the comparison I built. Every company in it is a listed waste handler, and every row carries its own basis date because the US names were not all captured at the same moment.
| Company | Market value | Revenue | Price-to-sales | Operating margin |
|---|---|---|---|---|
| Insun ENT (KOSDAQ: 060150) | $102.6M | $138.6M | 0.74x | 9.72% |
| Republic Services (NYSE: RSG) | $68.47B | $16.89B | 4.06x | 20.03% |
| Waste Management (NYSE: WM) | $87.38B | $25.67B | 3.43x | 18.86% |
| Clean Harbors (NYSE: CLH) | $16.64B | $6.24B | 2.67x | 11.87% |
| Enviri (NYSE: NVRI) | $640.7M | $2.12B | 0.30x | -6.49% |
Basis dates: RSG and WM were captured during US trading hours on September 4, 2026, so those two are live prices and not closes. CLH and NVRI are September 2, 2026 closes. Insun ENT is the September 4, 2026 Korean close. Revenue is trailing twelve months for the US names and fiscal 2025 for Insun ENT, whose fiscal year ends December 31.
Why these four companies and no others
My selection rule was narrow on purpose. Each comparison company had to be a listed waste handler whose operating margin and price-to-sales figure I could read from one source, with a stated price date within three sessions of my own. That is what produced Republic, Waste Management, Clean Harbors and Enviri, and it is also why the table has no Korean company in it. I looked for a domestic peer with a separately disclosed waste segment margin and could not verify one at the segment level, so I left the row out entirely instead of estimating it.
The rule has an obvious cost. It selects for size, because large US issuers are the ones with clean, single-source figures. The three companies ranked above Insun ENT in my table are between 162 and 852 times its size (by my calculation), and even Enviri, which ranks below it, is 6.2 times larger. I have listed that as a weakness further down instead of pretending the comparison is like for like.
How the five sort
Sorted by operating margin the order runs Republic 20.03%, Waste Management 18.86%, Clean Harbors 11.87%, Insun ENT 9.72%, Enviri -6.49%. Sorted by price-to-sales the order runs Republic 4.06x, Waste Management 3.43x, Clean Harbors 2.67x, Insun ENT 0.74x, Enviri 0.30x. The rank is identical in both, which is the first thing I checked and the first thing that made me slow down. The Korean company is fourth of five either way. Nothing about its position in the sequence is anomalous.
Where the anomaly actually is
The sequence is fine. The spacing is where it goes wrong. On margin, Insun ENT is 2.15 points below Clean Harbors and 16.21 points above Enviri. That is 7.54 times closer to the profitable end of the group than to the loss-making end (by my calculation). On price-to-sales the same company is 1.93 below Clean Harbors and 0.44 above Enviri, which is 4.39 times closer to the loss-making end (by my calculation).
So the two measures agree on the ordinal position and disagree on where inside the group that position actually sits. One of them puts this company 7.54 times nearer the profitable end. The other puts it 4.39 times nearer the end where there is no operating profit. Those two statements are about the same five rows and they pull in opposite directions. If a business earns roughly what Clean Harbors earns on each unit of revenue, and the market pays roughly what it pays for a business earning nothing, something in that pair is carrying information I have not identified.
On the price line, a close neighbor of Enviri
What a loss-making company is doing in the table
Enviri is the useful company in this comparison precisely because it is the one that is losing money at the operating line. It reported a -6.49% operating margin and a -24.38% profit margin, and the market values it at 0.30 times revenue. That is what a business with no operating profit gets priced at in this industry, on a US exchange, in September 2026.
Insun ENT gets 0.74 times. Higher, yes. But it is much nearer to that number than to the 2.67 times awarded to Clean Harbors, whose margin it very nearly matches.
What would have to be true for the pricing to be right
I can construct three explanations that would make the market’s view correct, and I want to write them down because I cannot rule any of them out.
The first is that the 9.72% margin is not durable. It came from a trailing four-quarter window, and this company’s annual margin has fallen for four consecutive years: 13.98% in 2022, 11.68% in 2023, 11.10% in 2024, and 9.74% in 2025. A falling series does not deserve the same treatment as a stable one.
The second is that operating margin is the wrong line to compare at all, because the company’s net result has been negative in each of the last two full years despite that margin. I get to this in the next section.
The third is structural and has nothing to do with the business. This is a KRW 138.50bn company on the junior Korean board with average daily turnover of about $116,500, and Korean small caps trade at persistent discounts to US listed comparables for reasons of liquidity, governance and index inclusion that no single company can fix. If that is the whole story, the gap is real but permanent, which makes it useless as an argument for owning the shares.
Where Insun ENT stock loses money: the December quarter, three years running
This is the fact I inherited from the Korean-language work I did on this company first, and it is the one that stopped me from treating the price-to-sales gap as an opportunity.
| Quarter | Operating profit | Net result |
|---|---|---|
| Q4 2023 | +KRW 3.60bn | -KRW 16.74bn |
| Q4 2024 | +KRW 8.25bn | -KRW 27.42bn |
| Q4 2025 | +KRW 5.90bn | -KRW 5.37bn |
| H1 2026 | +KRW 5.10bn | +KRW 2.96bn |
Consolidated, from Korean regulatory filings. Fourth quarter figures are the full year minus the nine-month cumulative total, by my calculation, because Korean filings do not report Q4 separately.
Operating profit was positive in all three
Every one of those three fourth quarters produced an operating profit. The losses arrived below that line, and the gaps are KRW 20.34bn, KRW 35.67bn and KRW 11.26bn respectively (by my calculation). Interest cannot account for them: the entire 2024 interest expense was KRW 7.00bn against a KRW 35.67bn gap in the fourth quarter alone.
What three years of nine-month reports showed
| Year | Net result, nine months | Net result, full year |
|---|---|---|
| 2023 | +KRW 18.45bn | +KRW 1.71bn |
| 2024 | +KRW 8.57bn | -KRW 18.86bn |
| 2025 | -KRW 5.56bn | -KRW 10.93bn |
In 2023 the company earned KRW 18.45bn through September and finished the year with KRW 1.71bn, so 90.73% of it went in the final quarter (by my calculation). In 2024 a profitable nine months ended in an annual loss. Only 2025 was already loss-making at the nine-month stage, and even there the fourth quarter roughly doubled the deficit. Two of the three years were reversed outright by the December quarter, and the third was deepened by it.
What Korean press reported about the 2024 loss
For the 2024 result there is a published explanation. Korean financial press, in a February 26, 2025 report carried by Money Today, traced the swing to an impairment assessment on goodwill and intangible assets, describing it as a non-cash accounting entry. The operating profit and net loss quoted there line up with the figures I pulled from the filings.
The report does not give an amount or name the subsidiary, and I have not opened the note-level disclosures in either the annual or the interim filing. I cannot say whether the 2023 and 2025 fourth quarters arose the same way. If the three years have three different causes, then the only thing they share is a date, and my reading of them weakens a great deal. I have looked at exactly this pattern once before, in a Korean dental implant maker whose plant impairment sat underneath a large buyback, and there the note-level detail changed how the headline number read.
The first half of 2026, and what that half does not settle
The first six months of 2026 look better on every line I care about. Revenue of KRW 92.78bn, operating profit of KRW 5.10bn, net profit of KRW 2.96bn, against a KRW 4.36bn net loss in the same half of 2025. Both quarters were profitable at the net line.
The trouble is that the same was true of the nine months to September in 2023 and again in 2024, and the nine-month table in the previous section shows what the December quarter then did to each of those years. I therefore file the 2026 first half under unsettled and not under improved. Those are different categories, and the difference is the whole reason I have not bought anything.
Revenue stopped falling, or nearly
Annual revenue declined four years running, from KRW 237.62bn in 2022 to KRW 187.15bn in 2025, a drop of 21.24% (by my calculation). But the first half of 2026 came in at KRW 92.78bn against KRW 93.73bn a year earlier, down 1.02%, and the second quarter alone was down 0.20%. The slope has gone nearly flat. Two quarters is a short window. I will not call it a recovery. I will say that the sentence “revenue keeps falling” stopped being true in 2026.
Operating cash flow went the other way
Here I made a mistake in my first pass and want to record it. I compared the KRW 4.76bn of first-half operating cash flow to the KRW 27.76bn full-year 2025 figure and started writing that this is a second-half-weighted business. Matching the periods properly kills that. First-half 2025 operating cash flow was KRW 17.07bn, so the 2026 half came in at 27.86% of the comparable period (by my calculation). It did not look thin because of seasonality. It was thin.
That cuts against my own framing, since it means the half that turned profitable at the net line produced barely a quarter of the prior year’s cash. I could not determine why. I have written before about a Korean paper maker whose cash line and reported result told opposite stories for years, and the lesson I took from that one was to check the cash line before believing the profit line, which is what I am doing here.
Insun ENT stock has no sell-side coverage, and that costs this piece something
There are no analyst valuations in this article because there are none to quote. The Korean vendor screen I use states plainly that no rating, no valuation and no estimated earnings figure has been published in the last three months. The same vendor’s research listing has been discontinued. Forward earnings, forward earnings ratio and peer ratio fields are all empty in my data source.
What the absence of estimates cost this article
For a company this size that is unremarkable. It also means this piece has no informed opposition in it. Every counterargument below is one I constructed, so the angles I failed to think of are simply missing, and no professional is publishing a number that would correct the price if it is wrong.
The balance sheet and the share count
Two things on the balance sheet run in the company’s favor, and I would be writing a dishonest piece if I left them out.
Debt to equity has fallen at every year-end in the table: 60.96%, 58.61%, 53.65%, 50.34%, and 49.03% at June 2026. Total liabilities fell from KRW 208.37bn at the end of 2022 to KRW 152.93bn at June 2026, down 26.61% (by my calculation), while equity fell 8.76%. The quarter-to-quarter path is not a straight line, though: the ratio was 48.25% at March 2026 and rose to 49.03% three months later.
Second, the company canceled 1,000,000 treasury shares on May 8, 2026 (Fri), a decision taken on April 24, 2026 (Fri) and reported in Korean media as 2.15% of shares outstanding, drawn from a treasury holding of roughly 2.65 million shares. The arithmetic closes: adding the canceled block back to the current 45,563,612 shares gives 46,563,612, and one million divided by that is 2.1476% (by my calculation). Paid-in capital of KRW 23.28bn also reconciles at a KRW 500 par value on the pre-cancellation count, which is what should happen since a treasury cancellation does not reduce stated capital.
Why the cancellation’s size is missing here
I have deliberately left the cancellation’s monetary size out. Korean reports of the same event carry figures that differ by roughly an order of magnitude, and without knowing whether the number quoted is a carrying amount or a market amount I would be repeating something I have not verified.
Where this reading of Insun ENT stock breaks
1. My peer table is built from two sources measured on two different days, and two of the five rows are live intraday prices instead of closes. I have said so in the note under the table, but a comparison assembled that way carries more slack than the two-decimal figures suggest.
2. Comparing a KRW 138.50bn Korean company to businesses six to eight hundred times its size is a stretch in itself. Scale changes cost structure, contract length, and access to capital. The margin similarity to Clean Harbors may be a coincidence of two very different businesses arriving at a similar percentage.
3. Revenue definitions vary. I did not compare accounting policies line by line, and the operating profit line in Korean filings can include other operating income that a US filer would present elsewhere. If those definitions differ materially, the 2.15 point distance I have leaned on is softer than it reads.
4. Three fourth quarters is a sample of three. Calling it a pattern is a stretch, and the 2025 case is weaker than the other two because that year was already loss-making at the nine-month stage. Only two of the three years show a profitable nine months reversed by the final quarter.
5. Equity rose in the first half of 2026, from KRW 308.95bn to KRW 311.91bn, after three years of decline. That is a point in the company’s favor that my framing does not accommodate.
6. I never looked at the underlying demand variable. Construction waste volumes follow building starts, and this article does not cite a single figure on Korean construction activity. I read the income statement and skipped the thing that drives it.
What I am doing about Insun ENT stock, and what would prove me wrong
I own none of this and have no order working. At about $102.6M of market value it sits far outside the range where I take positions, and this is an observation file and not a purchase record.
My position in one line: I separate a verdict that has not been delivered from a verdict that came back favorable, and the 2026 first half is the former. For this company the verdict has arrived in the December quarter three years running, and the report that will contain it is not due until March 2027. The Q3 filing due November 16, 2026 (Mon) will not settle it. I am stating that as the finding of this piece and I do not mean it as a complaint about how Korean issuers are required to report.
Two conditions that would make me wrong
First, if the fiscal 2026 annual report shows a profitable fourth quarter on a standalone basis, my December-quarter reading fails at the fourth observation and I will record it as three years of coincidence.
Second, if fiscal 2026 net profit exceeds KRW 5.92bn, double the KRW 2.96bn already earned in the first half, then the second half outperformed the first. That has not happened in any of the last three years. If it happens, the seasonal structure I have described does not exist.
Both conditions are good news for the company and a miss for me, and I record those two outcomes at different weights.
Related reading