Young Poong Stock: Most of the Profit Is Not From Operations
Young Poong stock closed at 39,450 won on Monday, September 7, 2026, which is the price every figure in this article is anchored to. At that close the company is worth about 726.3 billion won, roughly US$542 million. What kept me on the filings was not the price. It was that the operating line and the profit line of this company have been pointing in different directions for four fiscal years in a row, and I could not close the distance between them from public documents alone.
The two things worth carrying out of this piece
- In the first half of 2026 this company reported net profit of 407.0 billion won on operating profit of 44.8 billion won. The distance is 362.2 billion won, or 88.98 percent of net profit, and it did not come from smelting zinc.
- The four zinc names I put beside it all earn from operations. Their operating margins run from 16.86 to 46.63 percent by my calculation. Young Poong’s trailing twelve-month operating margin is negative 1.87 percent, also by my calculation.
Contents
Young Poong stock and the line that does not explain the profit
Young Poong is a KOSPI-listed zinc smelter. KOSPI is the main board of the Korea Exchange, the larger of the country’s two listed markets, and a Korean company on it files quarterly and semi-annual reports to a public regulatory system in Korean. The half-year report I worked from carries filing number 20260814002751 and was submitted on Friday, August 14, 2026.
Here is what that report says at the two lines a reader normally compares. Operating profit for the six months to June 30, 2026 was 44.8 billion won. Net profit for the same six months was 407.0 billion won. A company whose profit is nine times its operating profit is not primarily an operating business during that period, whatever its factory does.
I want to be careful about what that sentence claims. It does not say the smelter is unimportant. It says that if I value this company by looking at zinc, I am looking at a small part of what produced its reported earnings in that half year, and I should know what the large part is before I decide anything.
Four years in which the two bottom lines disagreed
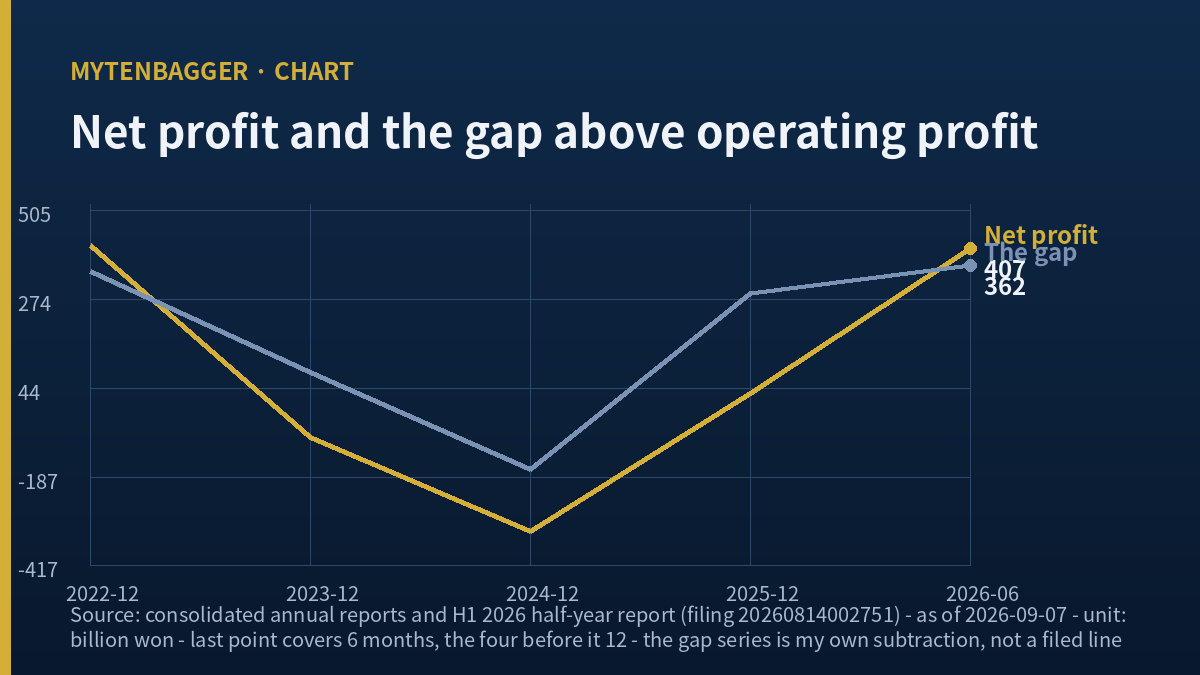
The gap, year by year
I built this table myself. The right-hand column is net profit minus operating profit, and I computed every cell of it. Nothing in this column appears in the filings as a line item; it is a subtraction I performed, and I am labeling it that way so nobody mistakes it for something the company published.
| Period | Net profit | Net minus operating (my calculation) |
|---|---|---|
| FY2022 (12 months) | +415.6 bn won | +346.7 bn won |
| FY2023 (12 months) | -83.4 bn won | +86.4 bn won |
| FY2024 (12 months) | -327.8 bn won | -167.1 bn won |
| FY2025 (12 months) | +30.9 bn won | +290.6 bn won |
| H1 2026 (6 months) | +407.0 bn won | +362.2 bn won |
Four of the five rows cover twelve months and the last row covers six. That is a real break in the table and I am not going to paper over it by annualizing anything. The last row is there because it is the most recent reported period available and because it carries the largest gap in the set. It does not belong on the same axis as the four above it. Read the bottom row as a half year and the four above it as full years, and the comparison still works for the question I am asking, which is directional: does the distance between these two lines shrink when the smelter recovers? In the first half of 2026 the smelter did recover and the distance grew.
FY2024 is the row I keep returning to. In that year the gap was negative 167.1 billion won, meaning the things outside operations made a bad operating year considerably worse. Whatever this second engine is, it runs in both directions.
Where the money outside operations comes from, as far as I could get
Young Poong holds 25.42 percent of Korea Zinc, another Korean zinc smelter, and it holds that position through a wholly owned subsidiary that is consolidated into these accounts. Korean press covering the company’s earnings has reported that the dividends receivable from that holding run above 100 billion won (Korean-language business press, July 8, 2026). That is the outline of the answer. I am stating it as an outline, and it is not a measured figure.
What I could not open
I did not reach the note that itemizes non-operating income for the half year. The regulatory filing portal blocks direct document URLs from the tooling I use, and the summarized financial dataset I pulled gives the totals without the note detail. So I can say the gap exists, I can measure it, and I can point at the most likely single source. I cannot tell you how much of 362.2 billion won is dividend income, how much is equity-method income, how much is a valuation movement on financial assets, and how much is something else. A reader who wants that breakdown has to open the Korean half-year report and read the notes.
The honest version of my position is therefore narrower than the headline: this company’s reported earnings depend mostly on holdings outside its smelting business, and I have not verified the composition. Anyone building a valuation on the 407.0 billion won figure without opening those notes is doing something I decided not to do.
Young Poong stock against four zinc names that earn from operations
I wanted to see what a zinc business looks like when the operating line carries the company. Four peer names in four reporting currencies, set beside this company in a fifth, and one of the four closes its books in a different month. I have not converted anything. Every margin in the last column is mine.
| Company | Revenue | Operating income | Operating margin (mine) | Period and currency |
|---|---|---|---|---|
| Young Poong (KRX: 000670) | 3,441,540 | -64,438 | -1.87% | TTM to Jun 30, 2026; millions KRW; summed by me from four filings |
| Boliden (STO: BOL) | 103,657 | 17,476 | 16.86% | TTM to Jun 30, 2026; millions SEK |
| Nexa Resources (NYSE: NEXA) | 3,463 | 686.93 | 19.84% | TTM to Jun 30, 2026; millions USD |
| Hindustan Zinc (NSE: HINDZINC) | 391,920 | 182,740 | 46.63% | FY ended Mar 31, 2026; millions INR |
| Teck Resources (NYSE: TECK) | 13,991 | 4,555 | 32.56% | TTM to Jun 30, 2026; millions CAD |
Four cautions belong with this table. First, the currencies differ and I have made no attempt to bring them together, so nothing here supports a claim about which company is larger. Second, one row covers a fiscal year ending in March while three cover a trailing twelve months ending in June, and the Indian company’s operating profitability is flattered by a mine-heavy business model that the three smelter-weighted names do not share. Third, the four peer figures come from a single aggregator, with last-updated stamps that range from March to August 2026 (Boliden, Nexa Resources, Hindustan Zinc, Teck Resources). Fourth, Teck and Hindustan Zinc are mining companies with zinc among several metals, so the comparison reaches the industry, and it does not reach the same activity.
The Young Poong row deserves its own note because I assembled it; no screen gave it to me. There is no trailing twelve-month presentation in Korean filings, so I took the 2025 full year, subtracted the first half of 2025, and added the first half of 2026, doing that for revenue and for operating profit separately. Four filed periods went into two numbers. That is why the row says summed by me, and why a reader who wants to check it has to redo the same subtraction, because no published figure exists to look up.
What survives all four cautions is the sign. Every one of the four earns money from running its business. This company does not, over a window that overlaps all of theirs, and it still reported a large profit.
Young Poong stock, the balance sheet, and one identity that is off by a million won
At June 30, 2026 the company reported total assets of 6,357.5 billion won, total liabilities of 1,907.0 billion won, and total equity of 4,450.5 billion won. Of that equity, 3,996.6 billion won belongs to the parent’s shareholders and 453.9 billion won to non-controlling interests. Dividing liabilities by total equity gives 42.85 percent, which matches the ratio shown on my data screen exactly, and that match tells me the screen ratio is built on the consolidated equity figure and leaves the parent-only figure aside. This is worth ten seconds of checking every time, because the two bases produce different answers on companies with large minority interests, and this is one of them.
One small thing. Adding the two equity components gives 4,450.507 billion won against a reported total of 4,450.508 billion won. The one-million-won difference is rounding inside the source data. I mention it because I checked the identity and did not assume it, and because a reader who repeats my check should not think a stray million means something.
Against 3,996.6 billion won of parent shareholders’ equity, the market is paying 726.3 billion won. That is 18.17 percent of book value by my calculation. I am not going to call that cheap in this piece, for the reason the whole article has been circling: I have not verified what most of the earnings are, and a book value that is largely a holding in another listed company is worth exactly what that other company is worth on any given day.
The values I left out
Inventory days came in at 57.8 for the June quarter. I did not put inventory against market value, which is the natural next move and would have produced a striking number here, because I used that exact structure for another Korean metals company two weeks ago, and running the same comparison twice in a row would tell you more about how I work than about either company. The screen also offers a three-year revenue growth rate, a payout ratio that disagrees with its own raw field, and an interest-coverage multiple whose lower-half account the data source marks as unknown. None of the three carries any weight in my judgment here.
The interest expense field is worth one paragraph on its own, because of how it fails. The dataset reports 220.6 billion won of interest expense for the three months to March 2026 and 58.8 billion won for the six months to June 2026. A cumulative expense cannot fall as the period lengthens. Either the two filings tag different accounts under the same label, or one of the two figures captures something that reversed, or the field is picking up a broader finance-cost line in one period and a narrower one in the other. I do not know which, and the source itself marks the basis of its coverage multiple as unknown. So I dropped the multiple. I am writing down why, and a quiet omission would have been the easier move, because a reader who pulls the same screen will see a coverage figure sitting there looking perfectly usable.
Cash actually arrived in the first half
One quarter did most of it
Reported profit and arriving cash are separate questions, so I checked the second one. For the six months to June 30, 2026 the company generated 256.5 billion won of operating cash flow and spent 102.5 billion won on capital expenditure, leaving 154.0 billion won of free cash flow. Set that against the market value of 726.3 billion won and the free cash flow yield is 21.20 percent, which agrees with the figure my data source publishes.
The distribution inside the half year is lopsided. The June quarter alone produced 338.3 billion won of operating cash, which means the March quarter consumed cash on that measure. A single strong quarter is not a run rate, and the company’s own full-year 2025 operating cash flow was 47.1 billion won against capital expenditure of 157.8 billion won, so the prior year burned free cash. Two data points in opposite directions, twelve months apart, are a reason to wait for the third.
What Young Poong stock does not have: a single published estimate
The Korean data terminal I use carries a consensus panel for most listed names. For this one the panel says there has been no published opinion in the past three months. There is no average forecast, no forward earnings figure, no institution named, no number for me to quote or to argue with. My own research gate asks for forward estimates from at least two named houses before I write, and on this company that requirement simply fails. I am writing anyway and telling you the gate failed, which is the arrangement I hold myself to.
That absence is information. A 726.3 billion won company on the main Korean board with no covering analyst is either an oversight the market will correct or a name institutions have decided they cannot stand behind an opinion on. The second reading fits a company whose earnings come mostly from a stake in a business it is in a well-reported governance dispute with. I lean toward the second reading and I hold it loosely.
Where I could be wrong about Young Poong stock
- I have not opened the non-operating income note. The entire central claim of this piece rests on a subtraction, and subtractions do not explain themselves.
- The final row of my gap table covers six months while the four above it cover twelve. I said so, and a reader could still reasonably say the table should not exist in that form.
- Equity-method income from an associate is a legitimate part of consolidated earnings. Calling it “outside operations” is accurate as accounting and slightly loaded as English.
- The 100 billion won dividend figure comes from Korean-language press reporting the company’s situation, and I did not find the underlying disclosure.
- The smelter turned to operating profit in the first quarter of 2026 and stayed there in the second. My framing risks understating a real operational recovery.
- Zinc prices rose through the first half of 2026 and Korean coverage puts part of the recovery down to price. Metal prices are not a business improvement.
- Plant utilization fell back in the second quarter after rising in the first. The direction of the operating recovery is not settled.
- Environmental regulation of this specific plant has been a live political issue in Korea for years and could interrupt production again.
- My peer table mixes miners with smelters and mixes fiscal periods. I labeled both, which limits the damage without removing it.
- The peer figures come from one aggregator whose update stamps range across five months. I did not check any of them against primary filings.
- Free cash flow of 154.0 billion won in one half year sits against negative free cash flow for the whole of 2025. I have shown two points and no trend.
- An 18.17 percent price-to-book figure is only meaningful if the book is worth its carrying amount, and most of this book is a stake whose market price moves daily.
- The absence of analyst coverage cuts both ways and I have chosen a reading of it without evidence for that choice.
- Last one, and it is about me. I ran the gap subtraction, saw 88.98 percent, and was pleased with it for about twenty minutes before I asked the obvious next question, which was what the money actually is. I wrote most of the structure of this article on the strength of a number whose contents I had not looked into. The correction is in the piece now, but the order in which I did the work was backwards, and I have caught myself doing that with derived columns before.
Related reading: a governance discount sitting on top of record operating earnings
Prices and multiples reflect the Monday, September 7, 2026 close as checked at the time of writing. The single dollar figure in this article is approximate, converted at about 1,340.5 won per dollar on that same date. Korean won is the reference currency throughout, and every other number stays in the currency its source reported. Financial data comes from Korean regulatory filings including the half-year report numbered 20260814002751; peer data comes from the aggregator pages linked above; cells marked as mine are arithmetic I performed.