LG Household Stock Trades Below the Equity on Its Own Screen
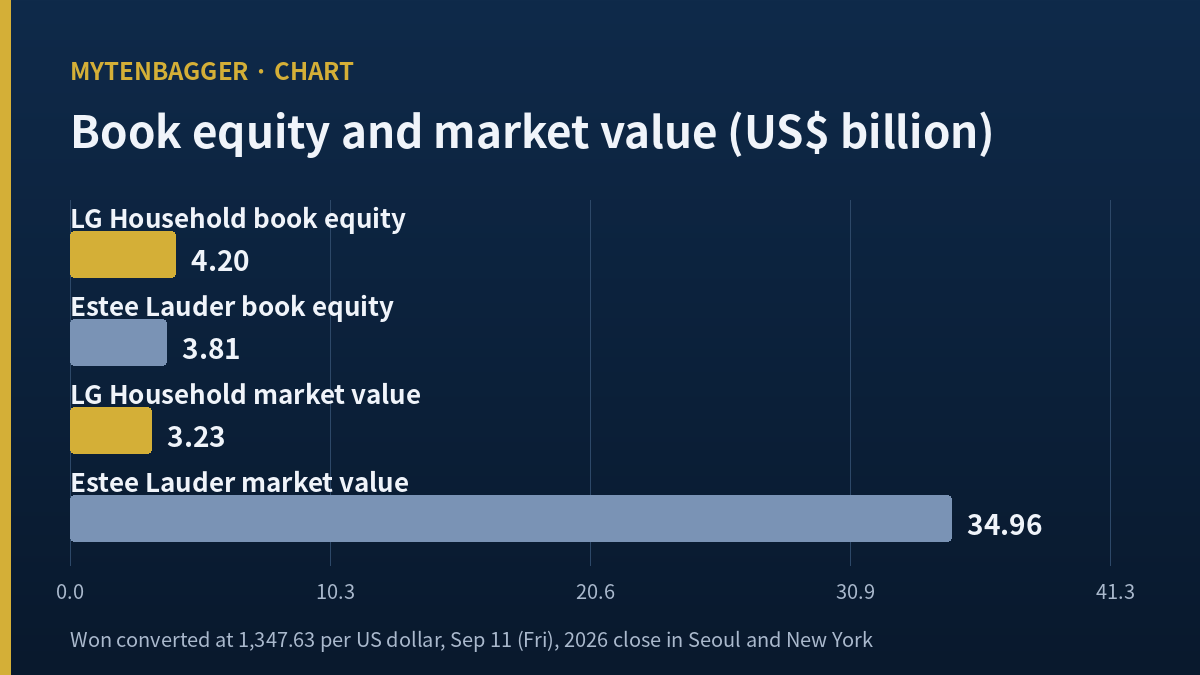
Two companies sell cosmetics. Both watched their trailing earnings collapse over the past two years, and both are now priced on what someone expects them to earn next year instead of what they earned last year. One carries book equity of roughly 3.81 billion dollars and a market value of 34.96 billion. The other carries book equity of roughly 4.20 billion dollars and a market value of 3.23 billion. The second one is larger on the balance sheet and smaller in the market by a factor I had to recompute twice before I believed it. The first is Estee Lauder. The second is LG Household and Health Care, listed in Seoul under 051900, and I spent this session on its balance sheet alone.
                 LG Household   |   Estee Lauder

  book equity           4.20    |      3.81       US$ billion
  market value          3.23    |     34.96       US$ billion
  price to book         0.89    |      9.17
  beta                 -0.03    |      1.27

  One spine, two sides. The equity line matches. Nothing else does.
Contents
What LG Household stock is worth against what it owns
The Seoul close on Friday, September 11, 2026 was 291,000 won, down 4,000 won on the day. Multiply that by the 14,975,523 common shares outstanding and I get 4,357.88 billion won of market value, which lines up with the 4,357.9 billion the company monitor screen prints. At 1,347.63 won per dollar, the Friday close on the Seoul currency market as recorded by this rate history, that is US$3.2337 billion by my arithmetic.
Now the other side. As of June 30, 2026 the controlling share of consolidated equity was 5,656.32 billion won, or US$4.1972 billion at the same rate. The company’s owners hold a claim on more book value than the entire common float is worth at Friday’s close. That is the sentence this piece exists to check, and checking it turned out to be harder than writing it.
Five balance sheets, read across
What the asset side did
I pulled five period ends from the balance sheet screen and worked across each row myself. All figures in billion won.
| Period end | Assets | Liabilities | Equity | Controlling share |
|---|---|---|---|---|
| Dec 2022 | 7,302.93 | 1,834.09 | 5,468.84 | 5,339.28 |
| Dec 2023 | 7,220.28 | 1,671.35 | 5,548.93 | 5,433.45 |
| Dec 2024 | 7,405.78 | 1,719.86 | 5,685.92 | 5,566.26 |
| Dec 2025 | 6,869.38 | 1,299.08 | 5,570.30 | 5,449.47 |
| Jun 2026 | 7,222.27 | 1,446.63 | 5,775.64 | 5,656.32 |
Assets minus liabilities equals equity in every row, and I checked all five by hand before I used any of them. The screen gives assets, liabilities and the controlling share; the equity column is mine, produced by subtracting one from the other.
What the liability side did
Liabilities over equity moves from 33.54 percent at the end of 2022 to 30.12, then 30.25, then 23.32 at the end of 2025, then 25.05 as of June 2026. All five are my own division. The same movement read against assets instead of equity gives 25.11 percent at the end of 2022 and 20.03 percent as of June 2026, both my own division, so the direction holds whichever base I choose. The shape is a company that paid down obligations through a bad stretch instead of borrowing through it. I want to be careful about what that proves. It says the balance sheet did not lever up while earnings fell; it does not say the assets on the other side are worth what the page says they are worth.
There is a separate piece in this corpus that ranks three Korean cosmetics manufacturers by debt instead of margin. That one builds a ranking. This one does not rank anything, because I only have one balance sheet open and a foreign peer whose obligations sit on a completely different accounting base.
What moved between the last two rows
The most recent two rows are the ones doing the work, so I differenced them. Between December 2024 and December 2025 total assets fell by 536.40 billion won, or 7.24 percent. Liabilities fell by 420.78 billion won over the same twelve months, which means roughly four fifths of the shrinkage on the asset side was matched by obligations coming off. Equity absorbed the remaining 115.62 billion won and ended the year smaller.
Then the first half of 2026 reverses the direction. Assets rise 352.89 billion won, or 5.14 percent. Liabilities rise 147.55 billion. Equity rises 205.34 billion, which is more than the whole of the previous year’s decline. Six months undid twelve months on the equity line, and the controlling share finished June 2026 at its highest level of the five periods I pulled.
I want to name what this does not establish. A balance sheet that expands in six months can expand because operations generated cash, because working capital was rebuilt ahead of demand, or because an asset was revalued upward. The screen I used gives me totals without the movement schedule that would separate those. What I can say is narrow and I will keep it narrow: the equity base behind each share was larger on June 30, 2026 than on any of the four earlier dates I checked.
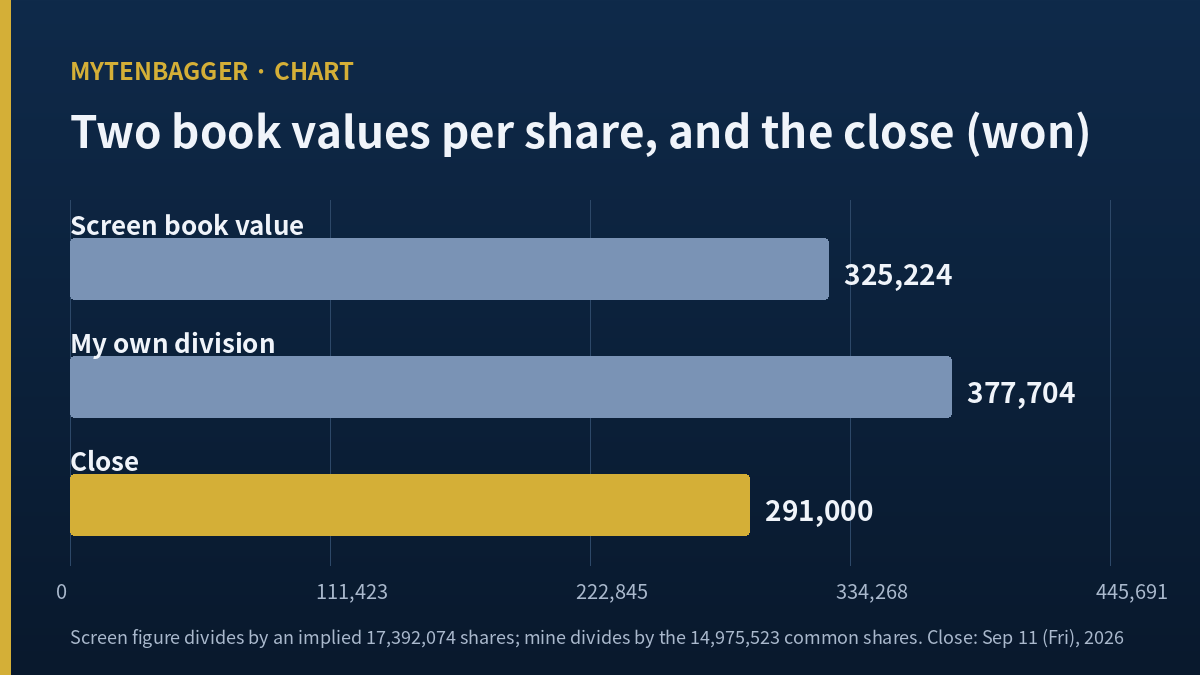
That last sentence can be made per-share, and it is the part I find hardest to look away from. Dividing the controlling share by the 14,975,523 common shares at each period end gives 356,534 won, 362,822, 371,691, 363,892 and 377,704, all my own division. Book value behind a share rose 5.94 percent across the four years even through the year the earnings line broke. The market price did not follow that line, which is the entire reason a ratio below one exists here at all.
Two book values for LG Household stock, and why they differ
The company monitor screen prints book value per share of 325,224 won and a price to book of 0.89. My own division of 291,000 by 325,224 gives 0.8948, so the screen’s ratio reproduces against its own per-share figure. What did not reproduce was the per-share figure itself.
Take the June 2026 controlling share of 5,656.32 billion won and divide by the 14,975,523 common shares. I get 377,704 won per share, not 325,224. Against Friday’s close that is a price to book of 0.7704 by my arithmetic. The two numbers disagree by about 16 percent, and the disagreement is entirely in the count each one divides by.
So I worked backwards. Divide 5,656.32 billion won by 325,224 and the count that comes out is 17,392,074 shares. Subtract the common shares and 2,416,551 is left over. This company has a separately listed preferred line, and a preferred count in that neighborhood would close the gap exactly. That is where the screen’s number comes from.
It is also where my trouble starts.
A share count I never saw published
A share count I never saw published is now holding up the tidiest paragraph in this piece. The only preferred figure I could actually retrieve was 2,096,259 listed shares, and the screen carrying it was dated Friday, August 14, 2026, five weeks before the close I am using. My back-calculated 2,416,551 exceeds it by 320,292. A plausible reading is that the larger figure counts shares issued while the smaller counts shares currently listed, with treasury holdings in between, but I did not open a filing and confirm that. I inferred a number, watched it land neatly, and felt the specific pleasure of a calculation closing.
That pleasure is the thing I have learned to distrust. A quantity that arrives by taking one figure away from another and then fits is no kind of evidence. It is a candidate. So I have carried both the screen’s 0.89 and my own 0.7704 through this piece instead of picking one, and I have not multiplied the preferred count by any price to produce a combined market value. A third screen prints 0.79, which resolves to Thursday’s close over the December 2025 equity base, and I set that one aside because it mixes two dates. I would rather publish a range I can explain than a single figure I cannot.
Estee Lauder and LG Household stock hold almost the same equity
Estee Lauder closed at US$96.62 on Friday, September 11, 2026, up 14 cents. Its quote page and statistics page give me shares outstanding of 361.80 million, a market value of $34.96 billion, book value per share of $10.52, a price to book of 9.17, trailing earnings per share of $0.50, a trailing multiple of 192.94 and a forward multiple of 29.03. Multiplying price by share count returns $34,957 million, which matches. Dividing price by book value per share returns 9.1844 against the printed 9.17, inside the rounding the page shows. Dividing price by earnings per share returns 193.24 against the printed 192.94, the gap coming from a per-share figure shown to two decimals.
I put the two companies next to each other as five definitions instead of a table, because a table would invite comparisons I cannot support on an income statement I deliberately left out of this piece.
- Book equity
- LG Household: 5,656.32 billion won, US$4.1972 billion at 1,347.63 won per dollar. Estee Lauder: $3.806 billion, which is $10.52 multiplied by 361.80 million shares. The Korean company is 1.1028 times larger, by my arithmetic.
- Market value
- US$3.2337 billion against $34.96 billion. Estee Lauder is 10.81 times larger, by my arithmetic. This is the same pair of companies as the line above.
- Price against book
- 0.89 on the Korean screen, 0.7704 on my own count of common shares, against 9.17. Whichever of my two I use, the peer sits above ten times mine.
- What the trailing earnings line does
- Neither company is being valued on it. Estee Lauder prints 192.94 on earnings of half a dollar a share; the Korean company prints nothing at all, because the figure it would divide by is below zero. The forward numbers are doing the work on both sides.
- Beta
- Negative 0.03 against 1.27. One of these names has moved with the market over five years and the other has barely moved with anything.
Two more things are worth saying before I leave the peer. Estee Lauder’s operating margin is 11.02 percent, its profit margin 1.21 percent, its return on equity 4.75 percent and its ratio of debt to equity 2.43, on revenue of $15.05 billion and net income of $182.00 million over the trailing twelve months. Gross margin is 75.49 percent, which is what a prestige beauty business looks like when the top of the income statement is healthy and everything below it is not. A Korean furniture name in this corpus turned on exactly that distance between gross margin and what survives to the bottom; the mechanism here is the same even though the industry is not.
And the drawdowns do not match. Estee Lauder sits 20.57 percent under its 52-week high of $121.64 and 45.91 percent above its low of $66.22, both my own division. I will come to the Korean side of that in a moment, and the two numbers are further apart than I expected for two companies that share a customer and a decade.
Where LG Household stock sits in its own range
The 52-week high is 335,500 won and the low is 210,000. Friday’s close of 291,000 is 13.26 percent under that high and 38.57 percent over that low, by my arithmetic, and the high divided by the low is 1.5976. Compare that with the American peer, which is more than twenty percent below its own high and more than forty-five percent above its own low. The Korean name has traveled through a narrower band this year while carrying a much cheaper book multiple. Foreign investors hold 31.74 percent of it.
Then there is the beta of negative 0.03. I do not want to over-read a five-year regression coefficient from a vendor page, and I have no way to audit how it was fitted. Taken at face value it says this stock has been close to uncorrelated with the index it belongs to. For a consumer name with a heavy China exposure that is odd, and I can construct two stories for it: either the stock spent the window falling on company-specific news while the index did other things, or the vendor’s window straddles a regime change that washes the coefficient out. I cannot separate those two with what I have.
One more piece of arithmetic belongs here, and I want to be precise about what it is and is not. If the printed ratio were to reach 1.00 against the current book, price and book value per share would have to meet at 325,224 won on the screen’s count or 377,704 won on mine, which are 11.76 percent and 29.80 percent above Friday’s close respectively, by my own division. I am not forecasting either level and I hold no view that the ratio should reach 1.00. I am naming where the arithmetic crosses, because a reader who knows where the crossing sits can judge the rest of this piece without taking my framing on trust.
For completeness on the peer side: Estee Lauder’s current ratio is 1.22 and its return on assets 5.23 percent. I mention both and use neither, for the same reason I left the income statement of the Korean company out. A liquidity ratio and an asset return computed on a United States filer with a different fiscal year are not comparable to anything I have opened in Seoul, and putting them in a comparison would be borrowing precision I have not earned.
What would have to be true for me to be wrong about LG Household stock
Five suppositions, each one a way this piece falls over.
Suppose the assets are stale. A price to book under one is only interesting if the book is real. Consumer companies carry goodwill and brand intangibles from acquisitions made in better years, and those carrying values are management estimates tested annually. If a meaningful slice of the 7,222.27 billion won of assets is goodwill that has not yet been written down, then the equity I am comparing against market value is a number waiting to shrink, and the discount I think I see is the market pricing a write-down I have not modeled.
Suppose the count is wrong. My reconstruction of 17,392,074 shares behind the screen’s per-share figure is a reverse calculation and never a disclosure. If the real structure differs, then 325,224 came from somewhere else and my whole reconciliation of the two book values collapses, taking the 0.7704 with it.
Suppose the comparison is wrong. Estee Lauder reports under a different standard, in a different currency, with a different fiscal calendar and a debt to equity ratio of 2.43 against something far lower in Seoul. A company that has bought back stock for two decades will always show thin book equity, and a company that has not will always show thick book equity. If that is the whole story, then my headline observation is an accounting difference dressed up as an insight.
Suppose cheap is correct. Korean holding-style consumer companies have traded under book for years for governance reasons that have nothing to do with the assets. If the discount is structural and has been there through several cycles, then noticing it in September 2026 is not analysis, it is arriving late to a permanent condition.
Suppose I have the causation backwards. This is the one that cuts my own argument. I read the falling ratio of liabilities to equity as discipline. It could just as easily be a company shrinking: fewer payables because less is being bought, less short-term debt because less inventory is being carried. A balance sheet that gets cleaner because the business gets smaller is not the same thing as a balance sheet that gets cleaner because management chose it, and the page I used cannot tell me which one happened.
Reaching LG Household stock from outside Korea
There is no American depositary receipt for this name, so an overseas investor who wants it has to reach the Korea Exchange directly through a broker offering Korean market access. I am not going to name a broker, because which one is available to a reader depends on where that reader files taxes and I have no way of knowing that. The Korea Exchange runs two boards: the KOSPI, which holds the large established names including this one, and the KOSDAQ, which is where the smaller technology and biotech listings sit. This company trades on the first.
The index route deserves one specific warning here, and it is particular to this piece instead of generic. Broad Korea funds weight their holdings by market value. A company whose interest lies precisely in the distance between its market value and its book value is, by construction, one that such a fund holds in proportion to the smaller of those two numbers. The cheaper it gets on book, the less of it an index investor owns. Whatever this piece has found, an index vehicle is the one route guaranteed not to deliver it.
Basis and footnote
Prices and ratios reflect the Korean close of Friday, September 11, 2026 as checked at the time of writing, which was the small hours of Saturday, September 12 in Seoul, making Friday the most recent trading day. The Korean won is the reference currency throughout and dollar conversions are approximate, at roughly 1,347.63 won per dollar on that same date. Balance sheet items are as of June 30, 2026 and the 2025 comparison is as of December 31, 2025, so three dates sit inside the price to book calculations above and I have named each one where it is used. Peer figures are United States market data for the same Friday, drawn from the two pages linked above, The company’s own results release is linked for anyone who wants the income statement this piece deliberately leaves out; no figure from it appears above. Every figure I describe as my arithmetic is a value I produced from two published numbers, never one I found printed.