Haesung DS Stock Sits on Three Years of Borrowed Plant
- 359,137 million won went into plant and equipment across 2023, 2024 and 2025.
- 270,692 million won is what operations produced in the same three years.
- 136,288 million won of net new debt is what closed the distance.
- 44,205 million won left as dividends while that distance was open.
I hold no position in Haesung DS stock and I have no order working. The first number is the reason I looked, and the third is the reason I stopped.
I found this company the way a lot of people found it in the same week. On Wednesday, September 16, 2026, it closed at 57,400 won, up 19.09 percent, the largest single day gain on the KOSPI that session as tallied by the Korean business outlet EBN. No company filing landed that day. Buying moved through Korean chip names broadly, and this one carried the most of it. The next session, Thursday, September 17, it closed at 54,400 won, 3,000 won lower. Two sessions of that size with nothing from the company in between told me to go look at what the company itself had put on paper.
KOSPI is Korea’s main board, roughly what the S&P 500 is to a US reader in role if not in size, and Haesung DS is a mid cap on it. It makes lead frames, the stamped metal skeletons that carry a chip inside its package, and package substrates, the layered boards that do the same job for more complex parts. Both are physical, capital hungry businesses. That is where the cash statement becomes the interesting document.
Contents
What Haesung DS stock paid for between 2023 and 2025
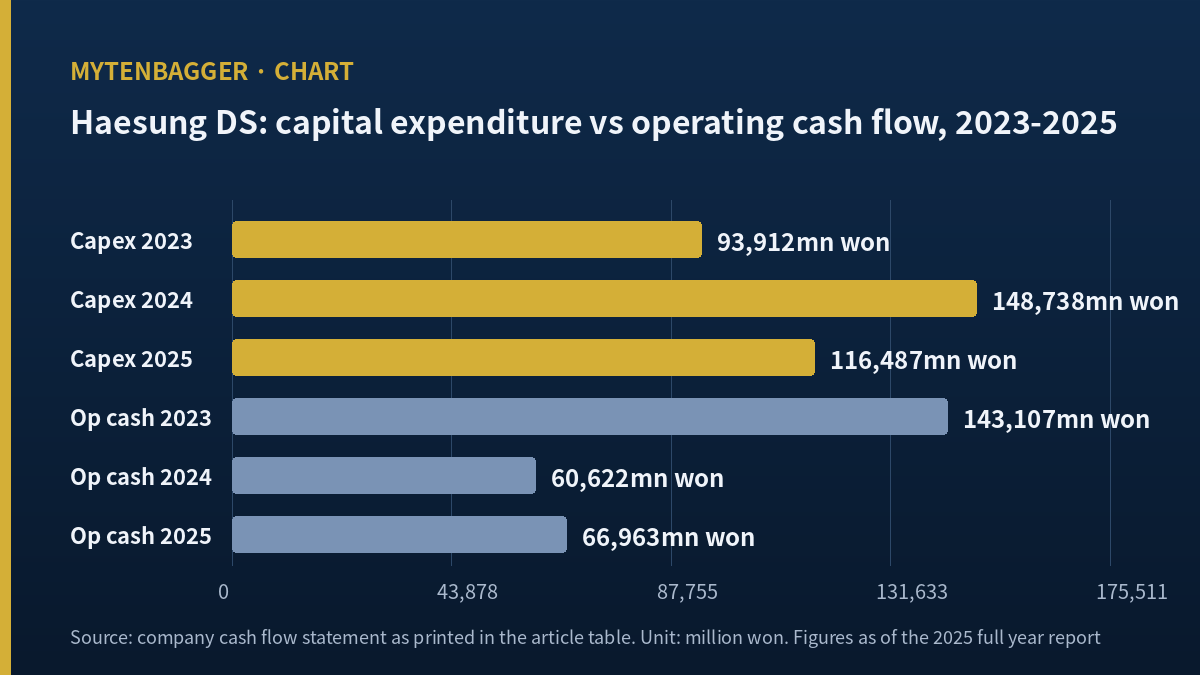
Three fiscal years of capital expenditure, taken from the cash flow statement: 93,912 million won in 2023, 148,738 million won in 2024, 116,487 million won in 2025. The sum is 359,137 million won, about 260.7 million US dollars at 1,377.54 won per dollar.
Operating cash flow over the same three years was 143,107 million won, 60,622 million won and 66,963 million won. That sums to 270,692 million won, about 196.5 million dollars. Subtracting one from the other leaves 88,445 million won, about 64.2 million dollars, that the building program needed and operations did not supply. I took one total from the other myself, so I mark it as derived.
Five years of the same four lines
| Million won | 2021 | 2022 | 2023 | 2024 | 2025 |
|---|---|---|---|---|---|
| Net income | 71,262 | 159,400 | 84,426 | 58,697 | 23,821 |
| Depreciation and amortization | 32,941 | 39,029 | 44,669 | 50,204 | 57,680 |
| Operating cash flow | 57,113 | 196,854 | 143,107 | 60,622 | 66,963 |
| Capital expenditure | 27,581 | 78,112 | 93,912 | 148,738 | 116,487 |
| Free cash flow | 29,532 | 118,742 | 49,195 | minus 88,116 | minus 49,524 |
| Net debt issued | minus 8,102 | minus 17,125 | 3,962 | 42,358 | 89,968 |
| Total debt at year end | 77,894 | 75,677 | 80,050 | 127,392 | 222,100 |
Sources: cash flow statement page and balance sheet page at the data site stockanalysis. Cash flow page dated August 14, 2026; balance sheet page dated March 31, 2026. Capital expenditure is shown on the source as a negative outflow and is written here as a positive amount spent.
Why the cash statement is the document I opened first
For most companies I start with the income statement, because that is where a business explains itself. Here I did not, and the reason is structural and not a matter of taste. A lead frame plant is a stamping and plating operation and a package substrate plant is a multi level board operation, and both of them convert money into machinery before they convert machinery into product. A company in the middle of that conversion reports a profit figure that is being pressed down by the depreciation of assets it has only just finished paying for, and a revenue figure that has not yet been given the capacity it bought. Neither of those two lines describes the decision the board actually made. The cash statement does, because it shows the money leaving in the year it left.
There is a second reason, which is that this company told the market what it intended to spend before it spent it. That gives me something rare: a plan on paper and an outturn to set beside it.
The plan on paper and the money that left
On January 16, 2023 the company disclosed a new facility investment of 318,500 million won, described as 108.22 percent of its own equity at the time and tied to an investment agreement with the city of Changwon. Later that year, on November 27, 2023, a trade publication put the full program at 388,000 million won, split into 174,000 million won of facilities and 214,000 million won of equipment, aimed at roughly 20 percent more capacity, with partial operation from December 2024 and completion in October 2025.
The cash actually spent on plant across 2023, 2024 and 2025 was 359,137 million won. Against the 388,000 million won program that is 92.5611 percent, which I calculated myself. The timing lines up too: the heaviest single year was 2024 at 148,738 million won, which is the year partial operation was supposed to begin, and the figure steps down in 2025 as the completion date arrives. This is one of the few times I have been able to watch a Korean mid cap announce a number, spend against it, and land within eight percent of it. Whatever else is arguable about this company, it did the thing it said it would do, on the scale it said and close to the schedule it said.
Two years where Haesung DS stock had negative free cash flow
Free cash flow, operating cash minus capital expenditure, was positive in 2021, 2022 and 2023, then went to minus 88,116 million won in 2024 and minus 49,524 million won in 2025. The two negative years add to minus 137,640 million won.
Net new borrowing in those same two years was 42,358 million won and 89,968 million won, or 132,326 million won together. That covers 96.1392 percent of the two year hole. The match is close enough that I want to be careful with it: cash flow lines do not settle against each other that neatly by design, and the company also had 139,794 million won of cash on the balance sheet entering 2024. The company could have drawn on that instead. It ended 2025 with 108,305 million won of cash and 222,100 million won of total debt, so on net it did both.
Total debt went from 80,050 million won at the end of 2023 to 222,100 million won at the end of 2025. That is 2.7745 times in two years, a rise of 177.4516 percent.
The dividend line stayed lit
The cash flow statement does not label a dividend line, but it can be recovered. Financing cash flow minus net debt issued leaves the rest of financing: 15,299 million won out in 2023, 15,301 million won out in 2024, 13,605 million won out in 2025. The company has 17 million shares. A dividend of 900 won a share is 15,300 million won and a dividend of 800 won a share is 13,600 million won. The declared dividend for fiscal 2022 was 900 won, for fiscal 2023 it was 900 won, and for fiscal 2024 it was 800 won, each paid the following April. The recovered amounts and the declared amounts sit on top of each other.
So the three years add up like this. Operations made 270,692 million won. Plant took 359,137 million won. Shareholders took 44,205 million won. Lenders supplied 136,288 million won of net new money. I like that the arithmetic recovers a number the statement did not print. I like less that the number it recovered was a payout made while the building program was running past what the business earned.
What depreciation says about the same years
Depreciation and amortization was 44,669 million won in 2023, 50,204 million won in 2024 and 57,680 million won in 2025, adding to 152,553 million won. In 2025 that non cash charge was 2.4214 times the reported net income of 23,821 million won. Operating cash flow of 66,963 million won was 2.8111 times net income for the same reason. When a company is halfway through absorbing a new plant, this is what the statement looks like: profit thin, cash flow thicker, and the gap sitting in the depreciation row.
That is also the honest version of the bull case. The building is largely paid for. The charge that is currently pressing on reported profit is the accounting shadow of money already spent. I covered a Korean board maker where the bottom line moved for a reason that had nothing to do with operations at all, and what I took from that piece is to ask which statement is answering the question before reading any of them.
What Haesung DS stock has shown since the spending
The first half of 2026 is the first stretch where the operating side answers. Second quarter revenue was 211.1 billion won, up 34.1 percent from a year earlier, with operating profit of 24.9 billion won, up 202.2 percent, as reported by the Korean financial wire Newspim. Within that quarter, lead frames contributed 164.0 billion won and package substrates 47.1 billion won, which adds to the 211.1 billion won total. First quarter revenue was 188.7 billion won with operating profit of 11.0 billion won.
Trailing twelve month figures through the second quarter give revenue of 758.3 billion won and net income of 53,584 million won. The trailing twelve month operating cash flow on the cash statement is 54,684 million won against capital expenditure of 46,480 million won, so free cash flow has turned positive again at 8,204 million won. One rolling year of positive free cash flow follows two negative ones. Stacking all five reported years plus the rolling one gives cumulative free cash flow of 68,033 million won since the start of 2021, which is a number I added up myself and which is smaller than the 118,742 million won the company produced in 2022 alone. Five and a half years of this business, net of what it spent on itself, have not yet replaced one good year.
Cash tied up in the operating cycle
Plant is not the only place money goes when a factory gets bigger. Inventory and trade receivables together were 193,417 million won at the end of 2023, 224,428 million won at the end of 2024, and 268,776 million won at the end of 2025. Through the first quarter of 2026 the pair stands at 295,201 million won. From the end of 2023 to the end of 2025 that is 75,359 million won more of the company’s cash sitting in goods and unpaid invoices, a rise of 38.9619 percent. All four sums and both percentages are mine, taken from the two balance sheet rows.
Set that beside the 127,585 million won of operating cash the company generated in those same two years and the squeeze becomes legible. It was not only building. It was also funding a bigger operating cycle at the same time, out of the same pocket, in years when the pocket was thinner than it had been in 2022 or 2023. A growing operating cycle in a growing business is ordinary and often healthy. What makes it worth writing down here is that it landed in the same two years as the negative free cash flow, and both were funded the same way.
I want to be exact about what this does and does not show. It does not show a collection problem or a demand problem, and I have no evidence for either. Receivables rising while revenue rises is arithmetic before it is anything else. What it shows is that the 88,445 million won gap I opened this piece with is the narrow version of the story. The wide version adds the working capital, and the wide version is the one the lenders funded.
The market has already marked some of this. The stock closed Thursday at roughly half its 52 week high of 108,500 won while published estimates for the current year were being lifted. I bought a different Korean chip name during exactly that kind of divergence last quarter, so I know how the argument for doing it here runs. The difference is that in that case I could state the thesis in one line, and here I cannot yet.
What three named houses wrote for 2026
Analyst Oh Kang-ho of Shinhan Investment kept a buy view in an August 11, 2026 note summarised by the Korean daily Edaily, and the figure in that note is 90,000 won, moved up from 80,000 won in the previous one. The 2026 estimates there are revenue of 878.9 billion won, operating profit of 100.5 billion won, and an operating margin in the low teens. Analyst Yang Seung-soo of Meritz Securities published a company brief on April 13, 2026 with a buy view and a fair value of 75,000 won, estimating 2026 revenue of 815.8 billion won and operating profit of 89.5 billion won, and 2027 revenue of 927.1 billion won and operating profit of 133.0 billion won. Analyst Kim Sun-bong of KB Securities issued a February 24, 2026 piece with no rating, carrying 2026 revenue of 784.3 billion won and operating profit of 108.9 billion won.
I read all three as secondary coverage. I opened the Meritz document itself and the other two through Korean press summaries, so the Shinhan and KB numbers reach me one step removed. I am recording that difference instead of smoothing it over. On the matter of how far apart independent estimates for the same fiscal year can sit, I have written a whole piece about a Korean chip name where two houses were 2.3 times apart, so the spread here strikes me as a narrow one.
The one ranking table I have
For a global reader the useful comparison is the lead frame business, where this company competes directly with Japanese and Taiwanese makers. I have exactly one ranking table. A Korean trade publication reported on November 27, 2023 that in the first half of 2023 the lead frame revenue order was Mitsui High-tec of Japan at 208 million dollars, Haesung DS at 180 million dollars, Chang Wah Technology of Taiwan at 160 million dollars, and Shinko Electric of Japan at 146 million dollars. The company said at the time it was aiming for the top position by 2027.
I chose those two peers for a plain reason: in the only ranking I can point to, they are the name directly above and the name directly below. Haesung DS at 180 million dollars was 86.5385 percent of Mitsui High-tec and 1.1250 times Chang Wah Technology. That is the entire comparison I am willing to make. I am not converting anything into either peer’s home currency, I am not putting any priced figure from either peer next to this company, and I am not building a size table, because the only shared line I have is three years old and covers half a year. A comparison built on one stale half year of one product line is a direction, and I am treating it as one.

Where I could be wrong about Haesung DS stock
These are the reads that weaken or reverse what I have written above.
- Every cash flow figure in this piece comes from one data site. I did not open the audited statements line by line against it.
- The income statement page at that same site is dated March 31, 2026 and the cash flow page is dated August 14, 2026, so their trailing twelve month windows are different. I noticed that and kept using both anyway.
- Capital expenditure that is finishing is not capital expenditure that is continuing. Trailing twelve month capital expenditure of 46,480 million won is well under half the 2024 figure.
- Free cash flow has already turned positive on a trailing basis at 8,204 million won.
- Second quarter 2026 operating profit rose 202.2 percent from a year earlier. Two more quarters like that would settle the question without any of my arithmetic.
- The lead frame line posted its best quarter on record in the second quarter of 2026, by the company’s own description.
- The company pointed to a continuing memory cycle and wider European support for electric vehicles as demand behind lead frames.
- Part of the new Changwon plant started running in the second half of 2026, which is what the spending was for.
- Package substrate utilization was estimated to move from the 30 percent range in the first half of 2025 to above the 70 percent range in 2026.
- A domestic customer approval at the Onyang site cleared, with a Suzhou approval described as following.
- Borrowing to build capacity that is then filled is a normal outcome and no warning by itself.
- Total debt of 222,100 million won sits against equity of 564,370 million won, which is 39.3536 percent, which is not a strained balance sheet on its face.
- Cash of 108,305 million won nets the debt down to 113,795 million won.
- Equity still grew 9.5758 percent from the end of 2023 to the end of 2025 while total assets grew 27.8636 percent.
- The dividend has never been cut in the ten declared years I can see, and a board that keeps a payout through a build may simply have been confident about the build.
- Two of the three named houses put 2026 operating profit near 100 billion won.
- One house puts 2027 operating profit at 133.0 billion won, which would be roughly two thirds of the 2022 peak shown in the table above.
- Three years is a short window. Choosing 2023 as the start makes the spending look heaviest, because 2023 is when it began.
- My dividend recovery assumes that financing cash flow contains only debt and dividends. Share issuance, lease payments or transaction costs inside that line would change the split.
- The stock trades at roughly half its 52 week high of 108,500 won, so a good deal of expectation has already been removed from the price.
- I am reading a capital cycle from five rows of one statement. Anyone with the segment notes in front of them has a better view of this than I do.
Where my read on Haesung DS stock breaks
I am watching this one. I do not hold it. The document that settles this is the third quarter 2026 report, specifically the borrowings note and the current liabilities note.
- If total debt at the end of the third quarter is below the 222,100 million won it ended 2025 at, the build is being paid down out of operations and my concern shrinks with it.
- If nine month capital expenditure stays under the 116,487 million won of full year 2025, the spending phase is genuinely closing and has not merely paused.
- If nine month operating cash flow exceeds nine month capital expenditure, free cash flow is positive on a reported basis and not only on a rolling one.
- If the borrowings note shows maturities concentrated inside twelve months, the size of the debt matters less than when it falls due, and I would rewrite this piece around the maturities.
- If all four of those land well and the fiscal 2026 dividend is raised, I will still wait one more report, because a single quarter does not bend a three year cash statement.
What I would not have known without writing this
A ranking table is what caught me out. When I first read the 2023 line that put this company at 180 million dollars, I set it beside the company’s own 2023 revenue of 672.2 billion won and could not make the two agree at all. I spent some time looking for the error before seeing that the 180 million dollars was half a year of one product line and the 672.2 billion won was a full year of everything. I had taken a part for a whole, which is the plainest kind of mistake and the easiest one to make when two numbers arrive in the same paragraph wearing different clothes.
The thing I would have sworn I already knew is that this was a company with a big capital program. I did know that. What I did not know, and had assumed I did, is which side of the balance sheet had carried it. I would have guessed retained earnings. It was lenders, for 136,288 million won across three years, while 44,205 million won went out the other door to shareholders. The board kept paying shareholders through it, which is either confidence or routine, and the third quarter report is the first document that will tell me which. That is the sentence I did not have when I opened the file this morning.
Prices and figures reflect the September 17, 2026 close of 54,400 won. Dollar amounts are approximate, converted at roughly 1,377.54 won per dollar from the September 16, 2026 close, and are rounded.
Related reading
- Hyosung Advanced Materials Stock and Five Years of Capex
- NAVER Stock at a 52-Week Low: Record Profit, AI Fear