Korea’s TS Corporation Earnings After Five Flat Years of Revenue
- Over five reported years, revenue stayed inside a band 9.2541 percent wide.
- In one of those years, revenue slipped and operating profit rose by 52.8674 percent, and no named brokerage has published an estimate against either figure.
- For the next reporting period, the number I want is the one due by November 16, 2026, and until it exists I am watching and not buying.
Five years of revenue at this Korean sugar refiner never left a band 9.2541 percent wide. That is the first thing I counted about TS Corporation stock, and it is the reason I kept reading. The lowest annual figure in my five-year window is KRW 1,261,349.33 million and the highest is KRW 1,378,075.52 million, which is a spread of KRW 116,726.19 million. Against that narrow revenue line sits an operating profit line that moved from KRW 36,996.73 million to KRW 56,555.93 million, a band 52.8674 percent wide. The profit band is 5.7129 times as wide as the revenue band that produced it.
I do not own this name and I have no order working. I am watching it. What pulled me in is the width of those two bands, because a company whose top line barely moves and whose operating profit swings by more than half in a single year is telling me that everything interesting happens between the two lines, in the cost base. That is where I spent my time.
One more thing before the numbers. This company reports in Korean won, and the won is the reference figure throughout. Dollar amounts below are approximate conversions at the September 21, 2026 close of the Seoul market, and I flag them as rounded where they appear.
Contents
The five-year revenue band behind TS Corporation stock
Here is the whole revenue series as the Korean financial press reports it, in millions of won: 1,261,349.33 for the year ended December 2021, then 1,378,075.52, then 1,332,349.88, then 1,373,829.11, then 1,356,276.03 for the year ended December 2025. Four of those five readings sit within about three and a half percent of each other. Only the first one is meaningfully lower, and even that is under ten percent below the highest.
What sits behind that flat line is three businesses. The company refines cane sugar, mixes animal feed and distributes meat, and it has been one of the three refiners that have supplied most of Korea’s sugar for roughly six decades. A Korean business outlet described that arrangement as an oligopoly of long standing, and it is the reason a company this size can hold its revenue steady for five years without growing.
Put in dollars, the scale is this. The five-year revenue range runs from about USD 913 million to about USD 998 million, and the operating profit range inside it runs from about USD 26.8 million to about USD 41.0 million, both converted at the rate in the footnote. The market puts roughly USD 176 million of value on the equity. That means the whole company is priced at about 0.1793 times one year of its sales, and a swing of a single point in the operating share of revenue is worth roughly USD 9.8 million of annual operating profit, which is a large fraction of that market value. For a business whose top line does not move, the operating share of revenue is therefore almost the entire valuation question, and that is the number I will be reading in November.
I want to be precise about what a narrow revenue band does and does not tell me. It does not tell me that demand is stable, because volume and price both move inside a revenue figure and they can offset. It tells me something smaller and more useful: that any change in profit over this window did not come from selling more. If profit moved, the cost base moved.
A profit line 5.7129 times as wide as the line above it
| KRW million | 2021 | 2022 | 2023 | 2024 | 2025 |
|---|---|---|---|---|---|
| Revenue | 1,261,349.33 | 1,378,075.52 | 1,332,349.88 | 1,373,829.11 | 1,356,276.03 |
| Operating profit | 42,051.84 | 38,051.12 | 47,216.91 | 36,996.73 | 56,555.93 |
| Reported operating profit as a share of revenue, percent | 3.33 | 2.76 | 3.54 | 2.69 | 4.17 |
| Same share, recomputed by me | 3.3339 | 2.7612 | 3.5439 | 2.6930 | 4.1699 |
Source: Hankyung corporate financials, consolidated, fiscal years ending December. The fourth row is the second row divided by the first, done by me; all five of my results land on the reported row to two decimals.
The recomputation in that last row matters more to me than it looks. When a figure I work out myself lands on a number the source publishes on its own, I can use its other rows with more confidence, because the two of us are working from the same definition of revenue. All five years came back inside a hundredth of a point. So when I write that 2025 was the strongest of the five years on this basis, I am not leaning on a single reported figure I cannot check.
What I did with the cost base, and what I refused to do with it
Revenue minus operating profit gives total operating cost. For 2024 that is KRW 1,336,832.38 million and for 2025 it is KRW 1,299,720.10 million. I built those two figures and then stopped, and I want to explain the stopping, because it is a rule I imposed on myself and not a limit in the data.
Comparing the rate at which revenue fell against the rate at which costs fell is a clean piece of arithmetic, and it would have carried this whole article. I have written exactly that structure recently for another Korean food company, and running it again a month later would make two pieces with one skeleton. Having the ingredients is not a reason to cook the same dish twice. So the cost base appears here as context and not as the spine, and the spine is the width of the two bands instead.
The year revenue slipped and operating profit rose, and what TS Corporation stock did about it
Take the last two years of the table on their own. Revenue went from KRW 1,373,829.11 million to KRW 1,356,276.03 million, a fall of 1.2777 percent. Operating profit went from KRW 36,996.73 million to KRW 56,555.93 million, a rise of 52.8674 percent. Those two directions are opposite and the magnitudes are nowhere near each other.
Below the operating line, the same year produced a net loss. Two Korean outlets reported that loss at slightly different sizes, roughly 150 million won apart, and I could not establish which of the two figures is the consolidated total and which is the parent shareholders’ portion. I therefore use the fact of the loss and not its size, and I do not build the width of the gap between operating profit and net result into my thesis. Another company in this same sector, which I wrote up in August, already carries that exact frame, and I am not repeating it here.
What I will say is narrower. A record operating result in a year of falling revenue, sitting above a loss, means the interesting question is not whether the business improved. It is whether the improvement lives in the part of the income statement that repeats.
The one quarter where somebody broke the segments out
Korean small caps often report segment revenue without segment profit. This company is luckier than most, because a Korean business outlet published a segment-level read of the first three months of 2025 with operating profit for each line. Consolidated revenue in that period was KRW 329.4 billion against KRW 325.2 billion a year earlier, and consolidated operating profit was KRW 8.3 billion against KRW 5.4 billion.
Inside that, the sugar and food line earned KRW 8.3 billion on revenue of KRW 168.4 billion, against KRW 0.2 billion on KRW 164.2 billion a year earlier. That is the whole of the consolidated operating profit coming from one line of business. The feed line earned less than it had, and so did the meat distribution line, and the remaining activities turned from a small profit into a loss.
I read that as a concentration problem and not a rebound. One line carried the period. If the reason that line did well was the price of the raw material it buys, then those three months tell me about the sugar market. They do not tell me what this company can earn on its own.
Why I did not turn those segment figures into a table
The outlet published those lines for a single three-month period. I have no comparable breakout for the four full years in my main table, so putting the two together would produce a picture whose left half is annual and consolidated and whose right half is three months and segmented. I keep them in prose, in this order, so a reader can see which part of my reasoning rests on twelve months and which on three.
The mix under TS Corporation stock moved even while the total did not
Here is the part of this company that surprised me. The five-year revenue line is flat, but the composition underneath it is not. A Korean trade piece written in 2019 about the 2018 financial year put the food line at 45.1 percent of sales, feed at 29.4 percent, meat distribution at 20.3 percent and other activities at 5.2 percent. A data service reading the same company in 2026 puts food at 48 percent, meat distribution at 29 percent, feed at 18 percent and other at 5 percent.
Feed and meat distribution have effectively traded places over roughly eight years while the total barely moved. I hold this loosely for one reason: the older figures were described as standalone and I could not confirm the basis of the newer ones, so the two sets may not rest on the same basis. I use the direction and not the differences. But the direction is clear enough to change the question I ask about this business. It is no longer purely a sugar refiner with a feed sideline; meat distribution now carries close to a third of what it sells.
Two earlier posts of mine that changed how I read this one
Two pieces of my own work fed into this one. The first is the note where I found that a Korean food company’s capital spending tracked the cash its operations produced almost year for year. That taught me to ask where the money for an investment or a repayment came from before treating either as a sign of strength, and I asked that question here.
The second is the note where I checked a return on equity that was being earned on roughly half of the equity the company reported. That one taught me to check which base a headline percentage is standing on. It is the reason the fourth row of my table exists at all: before I use a percentage somebody else worked out, I try to get to it myself.
World sugar and the cost base under TS Corporation stock
A refiner buys raw sugar and sells refined sugar, so the world price of the input is most of the story on the cost side. A June 2026 market outlook drawing on United States Department of Agriculture data put domestic American production for 2026/27 at 8.810 million short tons raw value, imports at 3.260 million and demand at 12.259 million, and reported that the International Sugar Organization sees a surplus in 2025/26 turning into a shortfall in 2026/27.
Those two forecasts point opposite ways for a buyer of raw sugar. A surplus year is the kind of year in which a refiner’s input bill falls without the refiner doing anything clever. A shortfall year is the kind in which it rises. If the strength in this company’s 2025 operating result came from cheap input, then the same mechanism running the other way is the single largest thing that could undo it, and no amount of operating discipline inside the company would stop it.
This is also why I treat the record operating result as information about a market and not about management. I have not found company disclosure that separates the two, and I am not going to assign the credit without it.
What I left out of my read on TS Corporation stock
Three frames were available and I dropped all three, each because an earlier piece of mine already used it.
- The distance between a record operating result and a bottom-line loss. A company in this same sector, written up in August, is built on that comparison.
- The difference between the rate revenue moved and the rate costs moved. That was the spine of a piece published a month ago.
- The single figure that produced a loss. That, too, belongs to an August piece.
Beyond those, I left out per-share figures. The source that carries this company’s book value per share leaves it empty for the most recent year, and I do not put a multiple on top of an empty value. I also left out this year’s interim income figures, because one data service labels a particular year-on-year rate as the first three months and another labels the same rate as the second three, and I could not tell which period I was looking at.
What this piece corrected in me
A word did the damage this time, and the word was oligopoly. Three companies have refined most of Korea’s sugar for about six decades, and when I read that sentence early in my reading I started treating the pricing power as settled. Then I looked at the segment quarter and saw that the profitable line was the one exposed to a world commodity price, and that the two domestic-facing lines were both earning less than the year before. A protected market share does not mean protected earnings if the input is priced in New York. My correction: when I meet the word oligopoly, I go and find which line actually earns, before I let the word do any work in my reasoning.
One company I am naming and not tabling
For a global reference I looked at Südzucker AG, a European sugar group whose shares trade in Frankfurt. It is the closest listed sugar refiner of comparable standing I found outside Korea. I am naming it and declining to put it in a table with this one, and the reason is simple: its financial year does not end in December, so I could not decide which of its reporting periods to line up against the December years in my table. Choosing one would have been an arbitrary choice presented as a comparison, so there are no figures from it here.
For readers who need the market context: this company’s shares change hands on the main board in Seoul, the market whose benchmark index is the KOSPI, Korea’s broad large-and-mid-cap index. Foreign ownership of this particular name reads as zero, which tells you how little outside attention it gets.
Eighteen things on the other side of TS Corporation stock
- My whole read rests on one source’s five-year series. I reproduced its percentages but not its underlying accounting.
- The strongest year of the five is also the year with a bottom-line loss, and I never found the cause of that loss.
- If the input price did the work, the same mechanism reverses when the market tightens.
- An institution’s own forecast says the world sugar balance turns from surplus to shortfall in the next crop year.
- A single three-month segment breakout is not a trend, and it is more than a year old now.
- In that period the two domestic-facing lines both earned less than a year earlier.
- The remaining activities line turned from profit to loss in the same period.
- My eight-year mix comparison joins a standalone figure to one whose basis I could not confirm.
- There is no named sell-side estimate for this company, so nothing external will correct me if my reading is wrong.
- The Korean consensus board I checked came back with no results when I looked for this company.
- Foreign ownership at zero can mean a market that has not looked, or a market that looked and left.
- The company announced a treasury share trust arrangement in July 2026, and I could not confirm its size or its term.
- A share buyback arrangement is not a cancellation, and no cancellation resolution is confirmed.
- The book value per share cell for the latest year was blank in the source I used, which limits what I can say about valuation.
- Revenue this flat for five years can also be read as a business that cannot grow.
- A refiner with a strong domestic position and a weak feed position is two businesses with different economics, and the weaker one is roughly a fifth of sales.
- I am reading this company entirely from third-party prints and news, because the regulator’s filing viewer would not open for me.
- Everything above is a year-end and period-end picture. It says nothing about the business as it trades today.
Six places where my read on TS Corporation stock breaks
- Earliest to answer. The interim report due by November 16, 2026. If the operating result as a share of revenue is running below the 2.6930 percent of 2024, then the strong year was the outlier and my band comparison loses its point.
- Next. The same report’s cost base. If my subtraction of profit from revenue no longer reproduces a plausible cost figure, my whole method here is unsound and I stop using it on this name.
- Then. Segment disclosure. If the company or an outlet publishes segment profit for a full year, I replace my three-month reasoning with it, and if that annual picture contradicts it I drop the concentration argument.
- Then. The cause of the 2025 loss. If it reads as recurring, the operating band I worked out here is the wrong band to be looking at.
- Then. The treasury trust. If the size turns out to be large relative to the float, the share count and every per-share figure need rebuilding.
- Latest. Raw sugar. If the shortfall forecast for the next crop year verifies and refined prices do not follow, the 2025 operating strength does not repeat.
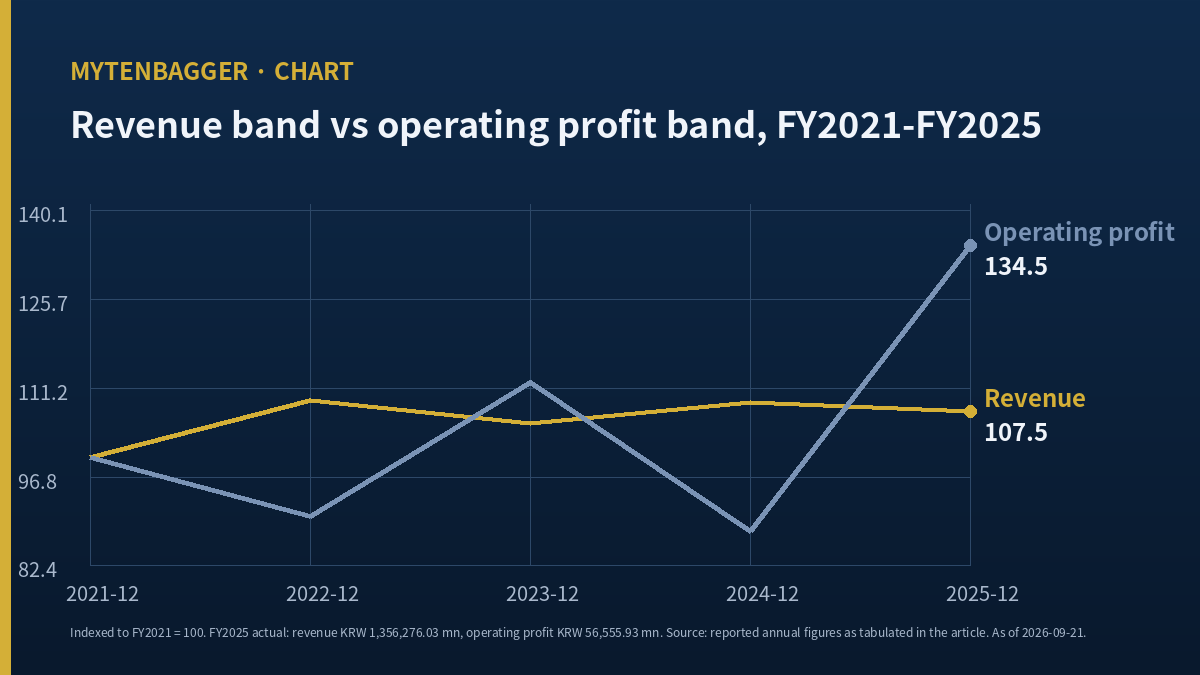
So here is where I end up. I am not buying this one. What I have is one clean count, that the profit band is 5.7129 times as wide as the revenue band, and two open items I could not close: why the strong operating year carried a loss, and how much of the strength belongs to the price of raw sugar and how much to the company. The count is mine and I trust it. The two open items are why the count is not enough.
The last figure I nailed down was the 2024 operating share of revenue, 2.6930 percent, and until I had it I could not write the sentence that matters most to me here: that the celebrated year is not being compared with a good year, it is being compared with the weakest of the five. That reframes the achievement without erasing it.
Prices and conversions reflect the September 21, 2026 close in Seoul, with dollar figures converted at roughly KRW 1,381.0 per dollar as quoted by two Korean outlets that afternoon. All percentages are my own, rounded to four decimals, and the won figures are as reported by the sources named above.
Related reading