Dongkook Pharmaceutical Debt Ratio Rose Again in First Half
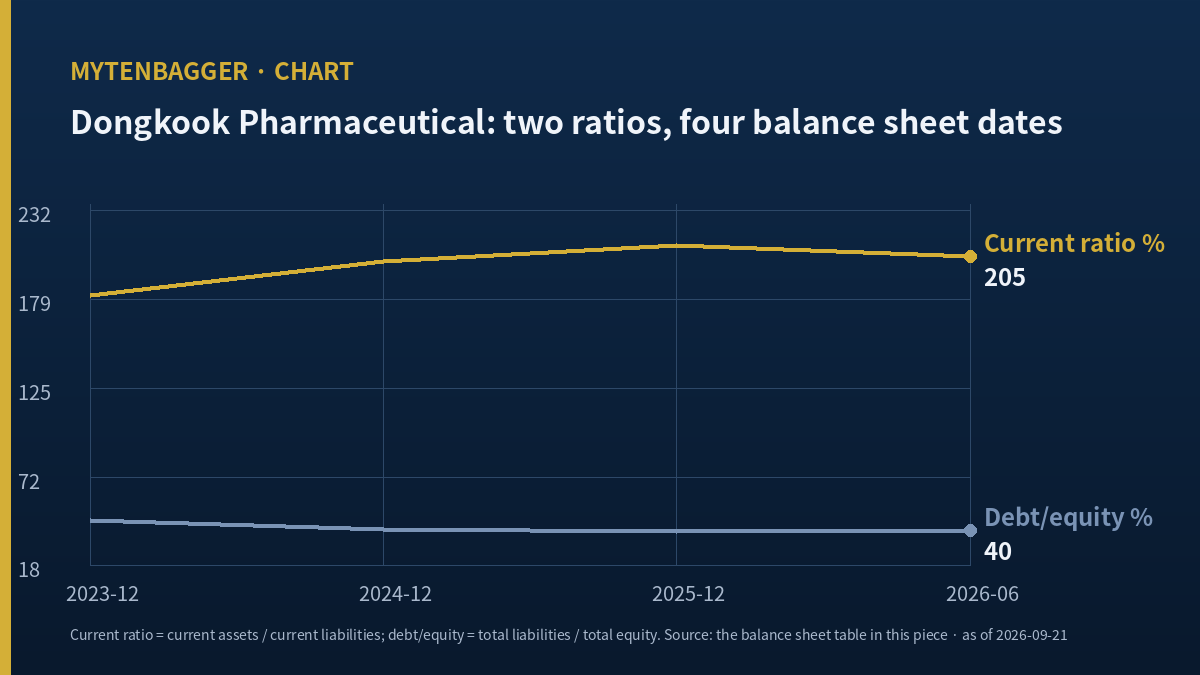
- A first measure behind Dongkook Pharmaceutical stock, liabilities as a share of equity, fell at three straight balance sheet dates and then rose again in the first half of 2026.
- A second measure, current assets against current liabilities, rose at those same three dates and then fell in that same half.
- An unexplained 82.70 billion won sits inside the equity increase. Retained earnings account for 62.6552 percent of it and I could not source the remainder.
I did not start with the price. I started with four dated columns of a balance sheet, because this is a Korean drug maker whose fastest growing business is skin cream, and I wanted to know what that mix does to the statement of financial position before I formed any view of the share price.
What came out was narrow and specific. Two of the oldest tests any reader applies to a balance sheet both improved at December 2023, December 2024 and December 2025. Both then reversed at June 2026. Not one of them. Both, in the same six months, for the first time in the period I can see.
The reference price is 20,650 won at the September 18, 2026 regular session close. On 45,230,420 shares that is a market value of 934,008,173,000 won, or roughly USD 675.20 million at about 1,383.3 won per dollar on the same date. The company trades on KOSDAQ, the smaller of Korea’s two main boards and the one that carries most of the country’s mid-cap healthcare names, so it sits outside the KOSPI indices that most Korea funds track.

Contents
What I Read Before Dongkook Pharmaceutical Stock: Four Balance Sheet Dates
Here is the raw material. Every figure below is printed in hundreds of millions of won by the source I used, and I converted each one to billions so that the four dates sit on a single scale. Nothing in this table is derived.
| Line (KRW bn) | Dec 2023 | Dec 2024 | Dec 2025 | Jun 2026 |
|---|---|---|---|---|
| Current assets | 419.19 | 470.00 | 565.39 | 586.45 |
| Property and equipment | 272.70 | 299.45 | 312.22 | 339.83 |
| Intangibles | 16.16 | 42.49 | 42.21 | 42.68 |
| Total assets | 839.53 | 953.16 | 1,062.89 | 1,117.66 |
| Current liabilities | 231.15 | 232.69 | 267.41 | 286.55 |
| Total liabilities | 263.36 | 274.18 | 299.15 | 320.03 |
| Paid-in capital | 22.61 | 22.61 | 22.61 | 22.61 |
| Retained earnings | 507.31 | 558.20 | 612.97 | 646.06 |
| Total equity | 576.17 | 678.97 | 763.73 | 797.62 |
Source: Valueline balance sheet, a Korean market data service, printed in hundreds of millions of won. The conversion to billions is mine.
Two things jump out before any arithmetic. Paid-in capital does not move at all across two and a half years, which tells me there was no equity issue and no change in the share count. And intangibles sit at 16.16 in December 2023 and at 42.49 twelve months later, which is a different kind of jump from everything else on the page.
Three Improvements, Then One Half That Reversed Both
I built the two percentages myself from the lines above, and I did it because I wanted to know the basis before I trusted anyone else’s version.
| Date | Liabilities over equity | Current assets over current liabilities |
|---|---|---|
| Dec 2023 | 45.7087% | 181.3498% |
| Dec 2024 | 40.3818% | 201.9855% |
| Dec 2025 | 39.1696% | 211.4319% |
| Jun 2026 | 40.1231% | 204.6589% |
Both columns are mine, derived from the statement lines in the table above.
The leverage measure fell three times and then rose
Liabilities over equity goes 45.7087, 40.3818, 39.1696, and then back up to 40.1231. The reversal is 0.9535 percentage points. The whole of 2025 improved this measure by 1.2122 points, so six months gave back 78.6586 percent of a full year’s work.
Before I read anything into that, I checked whether my arithmetic agreed with someone else’s. A Korean financial portal prints this same measure at 45.71, 40.38 and 39.17 for the three December dates, and my figures round to exactly those. That match told me two useful things: the source and I are working on the same consolidated basis, and the December 2025 value is not a data error.
The current cover rose three times and then fell
Current assets over current liabilities goes 181.3498, 201.9855, 211.4319, and then down to 204.6589. The reversal is 6.7730 percentage points. The company added 9.4464 points to this measure during 2025, so the half gave back 71.6993 percent of that gain.
The mechanics are not mysterious. Between December 2025 and June 2026, current assets rose by 21.06 and current liabilities rose by 19.14. Both climbed, but the smaller base climbed by almost as much in absolute terms, and that is enough to push the percentage down. This is arithmetic, and it is why a single half is thin evidence of anything. What makes me note it at all is that the other measure turned in the same six months.
Where the Asset Growth Went, and What It Means for Dongkook Pharmaceutical Stock
Total assets grew from 839.53 to 1,117.66 over the two and a half years, an increase of 278.13 or 33.1293 percent. That is real growth for a company this size, and it was funded almost entirely from inside: paid-in capital never moved, and total liabilities grew by only 56.67, or 21.5181 percent.
The equity increase I could only partly source
Total equity grew by 221.45 across the four dates. Retained earnings grew by 138.75 in the same period, which is 62.6552 percent of the equity increase. That leaves 82.70 that came from somewhere else on the equity page, and I could not tell you where. The service I used prints a condensed equity page and does not carry the full statement of changes in equity, and I did not open the original filing.
I am flagging this and declining to guess at it, because the plausible answers point in very different directions and a condensed page gives me no way to choose between them. One clue sits nearby and I am deliberately leaving it as a clue: book value per share derived from total equity at June 2026 comes to 17,634.59 won on 45,230,420 shares, while a Korean financial portal prints book value per share for the 2025 year at 14,674.67 won. Two numbers that should be close are 20 percent apart, which usually means they are not measuring the same claim on the company. They are not even on the same date, and that is part of why I am leaving this as a clue. A piece where I did unpick who owns which slice of the profit is my note on Chong Kun Dang, and the reason I am not repeating that work here is simply that I could not get the underlying statement.
Plant grew slower than receivables and inventory
Inside the 278.13 of asset growth, property and equipment added 67.13, a gain of 24.6168 percent. Cash added 13.91, a gain of 22.9727 percent. Trade receivables went from 178.88 to 256.91, an increase of 78.03 or 43.6270 percent. Inventory went from 138.34 to 192.02, an increase of 53.68 or 38.8031 percent. Those two working capital lines together added 131.71, which is 1.9621 times what the plant added over the same four dates.
Current assets as a whole grew 39.9008 percent while total assets grew 33.1293 percent, so the current side of the page grew faster than the page. Every one of those comparisons is my own subtraction from the first table, and I am setting them out this way because the aggregate growth number on its own hides which kind of asset the company ended up holding more of.
For a company whose growth engine is a consumer skin care brand sold through expanding retail and export channels, receivables and inventory rising faster than plant is close to what I would expect. It is not by itself a warning. It does mean that a growing part of the asset base is money the company has not collected and goods it has not sold, and that both of those are more sensitive to a demand slowdown than a factory is. A piece where I tried to separate volume growth from revenue growth in a Korean drug maker is my note on SK Biopharm, and the same question applies here in a form I cannot answer yet.
A peer the exchange files as a drug maker
For context I looked for a company on a US exchange whose filed industry label and whose own segment names disagree, because that gap is the thing I find hardest to price in a business like this one. Perrigo Company plc (NYSE: PRGO) fits. The exchange files it under Drug Manufacturers, Specialty and Generic, while the company’s own reporting segments are named Consumer Self-Care Americas and Consumer Self-Care International (exchange classification and company description).
I bring across the two labels and nothing else. No multiples, no margins, no growth figures. The point is only that a company can be filed as a drug maker and describe itself as a consumer health business at the same time, and that when it happens the sector average is a weak reference for either of them. The Korean company I am looking at has the same shape and the same problem. A piece where the mismatch between what a company signs and what it sells every day drove the whole read is my note on Hanmi Pharmaceutical.
An intangible line that grew 2.63 times and then held still
The last thing I want on the record is the strangest line on the page. Intangibles go 16.16, then 42.49, then 42.21, then 42.68. The step from December 2023 to December 2024 is a factor of 2.6293, an increase of 26.33. The eighteen months after that move the line by 0.19, or 0.4472 percent.
So something specific happened in one financial year and then nothing happened for six quarters. That pattern reads like a single acquisition or a single recognized asset and no spending plan spread across years. I looked for the event and found one candidate in brokerage coverage, a majority stake taken in a home beauty device maker in the spring of 2024, and the consideration described there was an order of magnitude too small to account for 26.33 billion won. So I have a shape without a cause, and I am recording it that way.
Paths I Can See From Here
I do not put numbers on how likely each of these is, because I have four dated columns and no model. What I can do is write down what each one would look like on the next statement, so that when the filing arrives I am reading it against something I committed to in advance.
The December statement puts both measures back on their old path
Liabilities over equity returns below 39.2 percent and current cover climbs back above 211 percent. This is the reading in which the June figures are an interim effect: inventory built ahead of a second-half selling season, payables and short-dated items sitting high at the half-year date and unwinding by December. Korean interim statements do this routinely, and the fact that non-current liabilities at June 2026 sit at 33.48, below the 41.49 of December 2024, is consistent with it. In this case nothing structural happened and my note becomes a piece of housekeeping.
Only the leverage measure recovers
Liabilities over equity falls back but current cover stays near 204 percent or drifts lower. That combination would tell me the reversal was not about borrowing at all. It would be about the mix inside current assets, with receivables and inventory carrying more of the load while short-dated obligations grow alongside them. This is the reading I would find most informative, because it would point at collection and at stock turn, with the capital structure left out of it.
Neither recovers and receivables keep outrunning revenue
Both measures stay where June left them or worsen, and trade receivables grow faster than reported revenue for a second consecutive period. Receivables have already grown 43.6270 percent against total asset growth of 33.1293 percent over the same four dates, so a second reporting period pointing the same way would make the gap hard to call seasonal. That is the path where I would want the collection period broken out before I did anything else with this name.
The equity page turns out to be the story
The 82.70 I could not source resolves into something that changes the denominator of my leverage arithmetic, and the two book value per share figures that sit 20 percent apart turn out to be measuring different claims on the company. In that case both of my percentages need rebuilding on whichever basis is correct, and the interesting question stops being the reversal and starts being how much of this equity belongs to the shareholders of the listed parent.
Four conditions that would break my read
- The December 2026 balance sheet shows both measures back on their old path. Liabilities over equity below 39.2 percent and current cover above 211 percent together would make the June reversal a seasonal effect, and my note would have been noise.
- The Q3 2026 filing includes a statement of changes in equity that sources the 82.70. If that gap turns out to be an ordinary line I simply could not see on a condensed page, the most cautious thing in this piece disappears.
- Trade receivables stop growing faster than revenue. The working capital observation above only matters if collection is lengthening, and one more reporting period will say.
- Intangibles move again. A second step on that line would tell me the 2024 jump was part of a pattern and no one-off event, and that changes what the whole asset build means.
The statutory deadline for the Q3 2026 filing is November 16, 2026, so the first two of those are answerable before the end of the year.
Twenty Things on the Other Side of Dongkook Pharmaceutical Stock
- Total assets grew 33.1293 percent in two and a half years with no equity issue. That is a good outcome by any reading.
- Paid-in capital never moved, so nothing in this piece is distorted by a changing share count.
- Retained earnings grew across all three intervals between the four dates. The company has not had a loss-making period in the window I can see.
- Total liabilities grew 21.5181 percent while assets grew 33.1293 percent, so leverage fell over the full period even with the June reversal.
- Cash at June 2026 is the highest of the four dates at 74.46.
- The June 2026 reversal is one half. Korean interim balance sheets carry seasonal working capital effects that a December statement does not.
- Both of my percentages are derived. I built them from statement lines, and a different definition of current assets or liabilities would move them.
- The 6.7730 point fall in current cover still leaves the measure above its December 2023 level by 23.3091 points.
- I have four dates. Three intervals is not a trend in any statistical sense.
- Non-current liabilities at June 2026 are 33.48, below the 41.49 of December 2024, so the reversal is concentrated in short-dated items.
- I did not open the original regulatory filing for any of these figures. Everything came from a market data service and from press coverage.
- The 82.70 unexplained portion of the equity increase may be entirely ordinary. I am recording an absence of information; a finding is a different thing.
- The book value per share discrepancy of roughly 20 percent is unresolved in this piece, and resolving it could change how I read the equity page.
- Intangibles at 42.68 are only 3.8187 percent of total assets, so the odd line is small in the whole.
- The company reported record first-half revenue for 2026 and higher earnings at every level. Nothing on the income statement contradicts the growth story.
- A Korean brokerage analyst wrote a 40,000 won figure into a May 18, 2026 note, down from 45,000 won on April 28, 2026. I have not used that number anywhere in my own arithmetic.
- Trading on KOSDAQ means lower index inclusion and thinner institutional coverage than a KOSPI peer of the same size, which cuts both ways.
- The Perrigo comparison carries two labels and no numbers. It cannot tell you anything about valuation.
- I have no position and no order, so nothing in this piece is a defense of one.
- The weakest link is here: I noticed two measures turning together and treated the coincidence as worth writing down, but I have not shown that the two are independent of each other. Both have equity or current liabilities on one side, and a single balance sheet event could move both at once.
Where I Stand on Dongkook Pharmaceutical Stock Today
No position, no order, watching. The market value of about 675.20 million dollars puts this outside the top hundred names in the Korean market, and my default there is to watch while leaving the buying for later. In this case there is a second reason. What I found is a shape in the balance sheet, and the document that would tell me whether the shape matters is the one I could not open.
Numbers I left out
I left out every income statement figure except the first-half headline, because the arithmetic I wanted to do here lives on the other statement. I left out book value per share as a valuation input, because two versions of it are 20 percent apart and I could not settle which is right. I left out the dividend the company declared for the 2025 year, because a yield under one percent does not move a decision either way. And I left out any comparison of my two percentages against a sector average, because a business that is part drug maker and part skin care brand does not have a sector average that means anything, which is the whole point of the Perrigo labels above.
A second decimal place
A second decimal place is what went wrong in my process, and I want it on the record. When my leverage arithmetic matched a printed figure at 45.71, 40.38 and 39.17, I felt the table was confirmed and moved on. It was not the table that was confirmed, it was one column of it. Later, working on the equity page, I found an 82.70 billion won increase I could not source and a derived book value per share that disagrees with a printed figure by a fifth. The correction I am keeping: one column agreeing with my own arithmetic licenses that column and nothing else on the page. I had turned a single match into a general permission, and that is a habit worth naming before it costs me a number.
The sentence I carried into this piece was that a drug company whose skin care brand is growing fast must be strengthening its balance sheet. That sentence did not survive. The balance sheet did strengthen for three years and then gave part of it back in six months, and the part of the equity page I most wanted to read is the part I could not get. The sentence I am leaving with instead is smaller and I can actually defend it: two measures turning in the same half is worth a dated entry in my notes; a position is a different claim.
The shortest paragraph I wrote here is the one on intangibles, and I stopped it where I did on purpose. I have a factor of 2.6293 and eighteen months of stillness and no cause, and writing more about it would have meant writing past what I know. If that paragraph is longer next time, it will be because the Q3 filing told me something.
Prices and share counts reflect the September 18, 2026 close. The dollar figure is approximate, at roughly 1,383.3 won per dollar on the same date, and all percentages are rounded to four places from the statement lines shown above. Annual income figures are from the Korea Economic Daily corporate financials page; first-half 2026 results are as reported by Korean press on August 14, 2026; price and dividend figures are from a Korean market data service.
Related reading