Cosmecca Korea Q2 Results: One Margin, Two Opposite Scores
Here is one number: 14.20%. That is the consolidated operating margin Cosmecca Korea (KOSDAQ: 241710) posted in the second quarter of 2026. I scored it twice and got two opposite answers, and that split is what this piece is about. Cosmecca Korea stock closed at KRW 95,000 on Monday, August 10, 2026, down 0.94% on a day the KOSDAQ index jumped 6.97%.
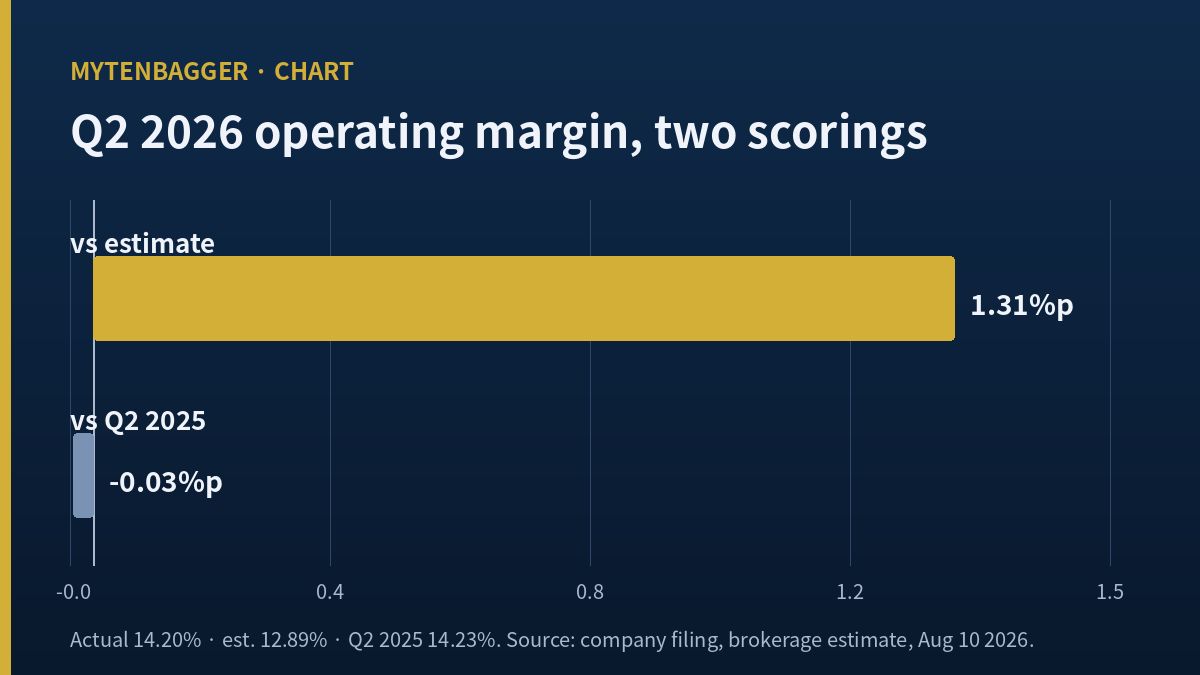
Score the margin against what the sell-side expected and it is a clear beat. Samsung Securities modeled KRW 204.1 billion of revenue and KRW 26.3 billion of operating profit for the quarter, which works out to a 12.89% margin by my calculation. Actual was 14.20%. That is 1.31 points better.
Score the same margin against the same quarter a year earlier and it is a miss. Q2 2025 operating profit was KRW 23.016 billion on the DART filing, against revenue I derive at KRW 161.7 billion, which is a 14.23% margin. This year the company put up 39.8% more revenue and produced 0.03 points less margin.
Contents
What Cosmecca Korea Stock Did on a Day the Index Jumped 6.97%
August 10, 2026 was a strange session in Seoul. The KOSDAQ closed at 854.47, up 55.66 points or 6.97%, with a buy-side sidecar triggered on the way up. The KOSPI added 0.65% to 6,299.66. The stock went the other way, closing down KRW 900 at KRW 95,000. The cosmetics sector rose 1.84% that session, so this was not a sector move either.
Then, less than an hour after the regular session ended at 15:30 local time, the company reported. Q2 consolidated revenue of KRW 226.1 billion (about USD 159 million), up 39.8%. Operating profit of KRW 32.1 billion (about USD 23 million), up 39.3%. Net profit of KRW 20.3 billion, up 88.0%. Management described new client wins combining with reorders and category expansion from existing small and mid-sized customers, and called the pattern a snowball effect.
So the closing price I am working from does not know about the earnings. Every multiple in this piece sits on a pre-announcement quote, and I say so instead of pretending the two arrived in the right order.
A note for readers outside Korea: KOSDAQ is the smaller of Korea’s two main boards, the venture and mid-cap market that sits alongside the large-cap KOSPI. Cosmecca Korea is a contract developer and manufacturer of cosmetics, which means it formulates and fills product that ships under someone else’s brand name.
One Margin, Two Scorecards
The forecast said the margin would fall
Samsung Securities analyst Jung Dong-hee raised the firm’s valuation on the name from KRW 90,000 to KRW 110,000 on Wednesday, July 8, 2026, and lifted 2026 and 2027 operating profit estimates by 2.4% and 3.0% respectively, citing the company’s competitiveness in winning orders from new indie brand houses. That report is where the quarterly estimate comes from: revenue up 26.2%, operating profit up 14.2%.
Read those two growth rates together and the implied view is that margin compresses. Revenue was modeled to grow almost twice as fast as profit. It did not happen. Revenue and operating profit both grew about 39%, and the margin held.
Last year said it would not rise
Against 2025, the picture inverts. Two figures moving at the same speed leave the ratio between them untouched, and that is what happened here. I want to be careful about how I got the 2025 base, because the DART quarterly file leaves the standalone Q2 2025 revenue line empty, so I derived it from the 39.8% growth rate the company disclosed.
Two independent lines support that derivation. Deriving operating profit the same way gives KRW 23.044 billion against a filed KRW 23.016 billion, a 0.12% gap. Deriving net profit gives KRW 10.798 billion against a filed KRW 10.796 billion, a 0.02% gap. When three company-published growth rates close against the original filing inside 0.2%, I will use the fourth at the same tolerance.
| Scored against | That margin | Gap to 14.20% | Verdict |
|---|---|---|---|
| Samsung Securities Q2 estimate July 8, 2026 (Wed) |
12.89% my calculation |
+1.31 pts | Beat |
| Q2 2025 actual DART filing plus derived revenue |
14.23% my calculation |
−0.03 pts | Miss |
I do not think one of these scorecards is the honest one and the other is a trick. Both are legitimate questions. Beating the estimate tells me the sell-side model of this business is too conservative. Matching last year tells me the business did not get more profitable per unit of revenue. Cosmecca Korea stock trades at 22.33 times trailing earnings, and I read that multiple as a price on the second question, not the first.
Where the Half-Year Improvement Actually Came From
Q1 did all of the work
Widen to six months and the margin story looks fine. First-half 2026 revenue of KRW 411.2 billion and operating profit of KRW 54.0 billion give a 13.13% margin. First-half 2025 was KRW 280.1 billion and KRW 35.3 billion, or 12.61%. That is a 0.52 point improvement, and a half-year headline would stop there.
Split it by quarter and all 0.52 points sit in the first three months.
| Quarter | Revenue growth | Operating margin, 2025 to 2026 | Change |
|---|---|---|---|
| Q1 | +56.41% (derived) | 10.38% to 11.82% | +1.44 pts |
| Q2 | +39.80% | 14.23% to 14.20% | −0.03 pts |
In the second quarter this company added KRW 64.4 billion of revenue, roughly USD 45 million, and converted none of it into a higher margin. In manufacturing, a 40% volume increase usually spreads fixed costs and pulls the margin up with it. I do not see that here. A plausible explanation is that a customer base weighted toward new and smaller indie brands means many small runs, which lifts revenue without lifting line efficiency. I cannot confirm that explanation with anything I have.
The four-year record makes clear what this company’s story has been. Operating margin of 2.60% in 2022, 10.44% in 2023, 11.51% in 2024, 13.03% in 2025, on DART consolidated figures. Operating profit went from KRW 10.4 billion to KRW 83.5 billion, an 8.06 times increase by my calculation. That is a staircase, and 22.33 times earnings with 4.01 times shareholders’ equity is a price on the staircase continuing. This quarter did not climb a step.
Cosmecca Korea Stock Ranked Second, Then Ninth, Then Thirty-First
A year of company, a month of sector
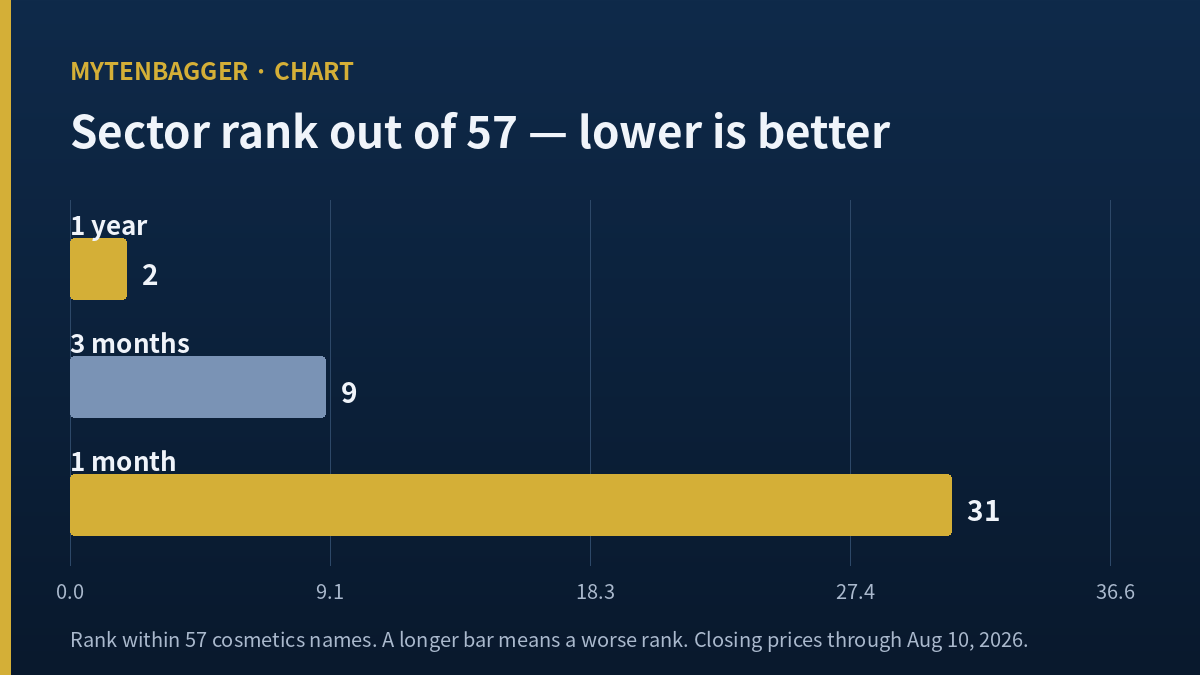
The same shape shows up in the price, and it is the reason I put the ranks in the headline. Over the twelve months to August 10, 2026 (243 trading days) the stock gained 52.0% on closing prices. KOSDAQ managed 5.25%. The cosmetics sector index fell 16.4%. That leaves 68.4 points of excess return over the sector, second place out of 57 names, against a sector median of −25.8%. The sector index here is an equal-weighted composite of those 57 names with this stock removed, so the comparison is not partly against itself.
In that window the sector wind was a drag worth −21.65 points and every bit of the excess came from the company. Being in cosmetics was a burden for twelve months, and something inside this business carried it anyway. That fits a margin that climbed from 2.60% to 13.03%.
Shorten the window and it turns over. In the month to August 10 (20 trading days) the stock rose 7.10%. The cosmetics sector rose 12.09%. Excess versus sector: −4.99 points. Rank 31 of 57, against a median of 7.36%, which is the middle of the pack. The breakdown says the sector drove it, with 51.0% of the move coming from the sector and not from the name.
Three months (May 11 to August 10) sits in between: stock +11.11%, KOSDAQ −29.23%, sector −6.87%, rank 9 of 57. Line the three ranks up and you get 2, then 9, then 31. The closer the window comes to today, the more ordinary this stock looks inside its own sector.
This is the margin problem again in a different form. Both answers are real. What I cannot do with the numbers currently on my screen is separate “this company is still executing” from “this company is now a sector average name that had a very good year.” Paying 22 times earnings without making that separation is the decision I have deferred.
When two numbers inside one quarter point in opposite directions, I wrote out how I handle it in the Kangwon Land piece on operating profit falling while net profit rose. When two growth rates point the same way at different speeds, that was the Studio Dragon piece on episode count outrunning revenue. This one is neither. Here there is a single number and two things to stand it next to.
The KRW 43.0 Billion Deal That Moved the Balance Sheet
The quarter was also broken out by entity. Korea: revenue KRW 178.8 billion, operating profit KRW 24.5 billion, a 13.70% margin by my calculation. United States, through subsidiary Englewood Lab: revenue KRW 51.9 billion (about USD 37 million), operating profit KRW 8.7 billion, 16.76%. China, through Cosmecca China: revenue KRW 7.7 billion and an operating loss of KRW 1.2 billion, −15.58%. The US entity is the most profitable of the three.
That US stake changed this year. On Tuesday, March 3, 2026 the company announced a tender offer for 3,311,310 Englewood Lab common shares at KRW 13,000 each, ran it for 21 days through Monday, March 23, and lifted its holding from 50% to 66.67%. At the offer price that is KRW 43.047 billion by my calculation, roughly USD 30 million.
The balance sheet carries a visible trace. Consolidated total equity was KRW 336.2 billion at the end of 2025 and KRW 312.0 billion at the end of Q1 2026, a drop of KRW 24.2 billion, and that is after Q1 net profit of KRW 19.6 billion came in. Add the profit, subtract the tender offer, and the residual is KRW 0.77 billion, which is 0.25% of total equity. The size lines up. Over the same stretch total liabilities went from KRW 295.6 billion to KRW 365.1 billion, and the debt-to-equity ratio moved from 87.91% to 117.01%.
I did not open the DART statement of changes in equity to confirm the mechanism. Where the difference between cash paid and the recorded value of a non-controlling interest ends up depends on the accounting treatment, and that detail shows up in the semi-annual notes. The sizes match, and that is as far as I will take it.
Cosmecca Korea Stock and e.l.f. Beauty, Two Ends of One Chain
Why I picked a customer, not a competitor
For the overseas comparison I did not look for another contract manufacturer. I looked for a listed company standing on the buying side of what this business sells. That is e.l.f. Beauty (NYSE: ELF), the US mass indie brand that outsources manufacturing and keeps brand and distribution. It is a stand-in for the economics underneath the phrase “new indie brand clients” that Cosmecca uses to explain its growth. I am not claiming e.l.f. is a Cosmecca customer. I am saying it occupies the position Cosmecca’s customers occupy.
| Cosmecca Korea Q2 2026 |
e.l.f. Beauty trailing twelve months |
|
|---|---|---|
| Revenue growth | +39.8% | +31.2% |
| Net profit growth | +88.0% | −39.1% |
| Net margin | 8.98% (derived) | 3.39% (derived) |
| Price to trailing earnings | 22.33x | 93.20x 29.91x forward |
The periods are not identical and I will say so plainly: Cosmecca is one quarter, e.l.f. is twelve trailing months, on figures displayed by stockanalysis.com as of August 10, 2026. With that caveat, the two are moving in opposite directions. The brand owner grew revenue 31% while net profit fell 39% and net margin came down to 3.39%. The manufacturer grew revenue 40%, grew net profit 88%, and sits at 8.98%. The usual arrangement in this chain is the reverse, with the brand holding the margin and the factory living on a thin one.
That inversion is my counter-argument to my own bullish reading. I take 22 times earnings on Cosmecca Korea stock as a price on continued margin expansion, and one step up the chain margin is already under pressure. When brand owners start cutting cost, that pressure eventually reaches contract pricing. And this company’s Q2 operating margin already failed to expand. Those two facts may be pointing at the same thing, or they may have landed in the same quarter by coincidence. I cannot tell yet.
Four Things That Keep Me Cautious on Cosmecca Korea Stock
1. A 12.5% US tariff. Korean daily Segye Ilbo reported on Saturday, July 25, 2026 that Korean goods entering the United States face a 12.5% tariff. In the same piece an industry source said that for value brands, where price competitiveness is the weapon, even a 2.5% increase is a burden, and Soongsil University professor Koo Ki-bo said consumer goods are price-sensitive enough that an additional 2.5% can have a real effect. Both quotes use 2.5% as the original article framed it, and the article does not explain how that figure relates to the 12.5% headline, so I have not reconciled the two. What complicates this for Cosmecca specifically is that Englewood Lab manufactures inside the United States, so some volume is exposed and some is not. Korean entity revenue was KRW 178.8 billion in the quarter, and the share of that heading to the US is not disclosed, so I could not size the exposure.
2. China keeps losing money. Cosmecca China posted KRW 7.7 billion of revenue and a KRW 1.2 billion operating loss in Q2. Revenue was up 21.3% on the prior quarter and it is still in the red. One of three entities is not yet earning, and this release contained no company guidance on when that changes.
3. Growth keeps consuming cash. Full-year 2025 operating cash flow was KRW 55.0 billion against capital expenditure of KRW 61.4 billion, which puts free cash flow at negative KRW 6.3 billion on DART consolidated figures. Q1 2026 flipped positive at KRW 24.6 billion of operating cash flow against KRW 10.9 billion of capex, but the debt-to-equity ratio still moved 29.1 points higher as described above. Interest coverage of 11.69 times says this is not a solvency question today. It does say that climbing this margin staircase has taken capital.
4. My own arithmetic could be wrong. The −0.03 point figure this piece is built on rests on two assumptions. One is that deriving Q2 2025 revenue from a published growth rate is sound, because the DART standalone revenue line is empty. The other is that I do not know how the entity-level disclosures reconcile to the consolidated ones. Add the three entities and revenue comes to KRW 238.4 billion, which is KRW 12.3 billion more than consolidated (5.16% of the sum), while adding operating profit gives KRW 32.0 billion against a consolidated KRW 32.1 billion, a difference of KRW 0.1 billion. Revenue eliminates and profit essentially does not, and I have not seen the workings. Shake either assumption and 0.03 points moves easily. This is a second-decimal argument and I am not going to pretend otherwise.
What Cosmecca Korea Stock Would Have to Show Me
Numbers I did not use
Two closing prices arrived for August 10. One vendor path returned KRW 99,900 and the primary field, along with a second path built on daily closes, returned KRW 95,000. The row containing 99,900 shows a session high of 96,800, which puts the close above the high and makes it arithmetically impossible. KRW 95,000 reproduces the price to trailing earnings of 22.33, the 4.01 multiple of shareholders’ equity, and the KRW 1,014.6 billion market value to the last won, and it matches the August 10 close of KRW 95,000 (down KRW 900, or 0.94%) shown on Hankyung’s quote page. I used 95,000.
The problem with one contaminated close is that it takes derived fields with it. Position against moving averages was displayed as +17.83%, +29.56% and +26.04% for the 20, 60 and 120 day lines, all computed off 99,900. Recomputed at 95,000 those become +12.05%, +23.21% and +19.86%. For the same reason I discarded the one, three, six and twelve month change figures on that screen and pulled them again from the closing-price series.
I dropped dividends entirely. The filing-based history stops at KRW 1,200 for 2018 and KRW 200 for 2017, while the screening field shows KRW 370 per share. I could not establish which describes the current policy, so neither the payout nor the yield appears above. On cash flow I split the difference: operating cash flow of KRW 24.552 billion and free cash flow of KRW 13.633 billion match the Q1 DART figures exactly, and the 1.34% free cash flow yield closes against the market value, so I used them. The EBITDA field on the same screen equals Q1 operating profit exactly, which would mean zero depreciation, so I left it out. The three-year revenue growth rate of 17.08% went unused because I could not confirm the period definition, and the total equity field was empty so DART filled in. Net asset value per share of KRW 23,663 times shares outstanding gives KRW 252.7 billion against a Q1 total equity of KRW 312.0 billion, a KRW 59.3 billion gap (19.01%) whose composition only the semi-annual filing settles. A Yuanta Securities report exists with a buy rating; I could not reach the text and have not cited it.
On access, this one has a wrinkle I have not run into before. The wrinkle is that the most profitable part of this company, the US manufacturing arm, is itself separately listed in Korea, not in the United States. That is why a tender offer for its shares was possible at all. So an American investor wanting exposure to American cosmetics manufacturing here ends up needing a Korean account either way.
Two houses are looking up from here. Samsung Securities moved to KRW 110,000 in July. NH Investment Securities analyst Jung Ji-yoon put KRW 120,000 alongside a buy rating on Monday, May 11, 2026, writing that Q1 beat consensus, that indie brand client diversification and large skincare orders were lifting productivity at the standalone entity, and that Q2 order volume was already running past Q1. I read both through secondary Korean press coverage and opened neither original document.
Two things would bring me back. First, a standalone third-quarter operating margin clearly above this quarter’s 14.20%, which would mean the flat quarter was temporary and not a limit imposed by a many-small-runs customer mix. Second, segment notes in the semi-annual filing that show how the entity figures reconcile and what share of Korean revenue ships to the United States. Both gaps I flagged above close there.
And my causal story might simply be backwards. I stood e.l.f. next to this company on the premise that margin pressure at the brand end eventually reaches contract pricing. If e.l.f.’s net margin recovers next quarter while Cosmecca’s operating margin stays near 14%, then the two were never connected and I put two unrelated curves side by side. In that case the thing to discard is not my conclusion but the frame that produced it. If instead e.l.f. compresses further and this company holds 14.20%, that means the manufacturer’s pricing power is sturdier than I assumed, and my caution was the error and not my reading.
What I actually did in this piece was choose which scorecard to use, and I am writing down that I have not chosen yet. Next quarter I will score this company against the year-ago quarter and not against the estimate, and I am fixing that choice now, before the number shows up.
Is Cosmecca Korea stock expensive at 22 times earnings?
Against the KOSDAQ cosmetics group it is not obviously cheap and not obviously stretched, and the seven-metric screen I run gives it 5 of 7 for 71 points, failing on price to earnings and on price to shareholders’ equity, where the cosmetics sector threshold is 3.0 and this trades at 4.01. Whether that is expensive turns on whether the margin staircase continues, which is exactly what this quarter declined to answer.
Why did the stock fall on the day of good results?
The release came after the close. The KRW 95,000 print does not contain the news, since the regular session ends at 15:30 and the reports appeared after 16:00 local time. The 0.94% decline that day should be read as unrelated to earnings, and every multiple here sits on that pre-release quote.
Net profit grew 88%. How is the margin flat?
Two different margins. Operating margin went from 14.23% to 14.20%, down 0.03 points. Net margin went from 6.68% to 8.98%, up 2.30 points, both derived. The improvement happened below the operating line, in some combination of financial income, currency, equity-method results and tax. The income statement in the semi-annual filing is what separates those. What I can say now is only that the improvement was not made in operations.
What is Englewood Lab and why does it matter here?
It is the company’s US manufacturing subsidiary, which produced KRW 51.9 billion of revenue and the highest margin of the three entities at 16.76% in Q2. Cosmecca raised its stake from 50% to 66.67% through a tender offer completed on March 23, 2026 for roughly KRW 43.0 billion. It matters twice over: it is where US tariff exposure is partly offset by domestic production, and it is the reason total equity fell in a quarter when the company was profitable.
| Cosmecca Korea (KOSDAQ: 241710) at the August 10, 2026 (Mon) close | |
|---|---|
| Market and sector | KOSDAQ, cosmetics |
| Close and market value | KRW 95,000 · KRW 1,014.6bn (about USD 715m), derived from 10,680,000 shares |
| Earnings, equity and sales multiples | 22.33x · 4.01x · 1.58x (Kiwoom trailing, reproduced at the same close) |
| Return on equity and net asset value | 19.3% · KRW 23,663 (DART consolidated 2025 return on equity was 17.2%) |
| 2025 revenue and operating profit | KRW 640.9bn (about USD 452m) · KRW 83.5bn, a 13.03% margin |
| Debt to equity, interest coverage | 117.01% at end-Q1 2026 · 11.69x |
| 250-day high and low | KRW 106,400 · KRW 56,800 (intraday). 89.29% of the high, 67.25% above the low, derived |
| Drawdown on closing prices | −7.77% from the KRW 103,000 peak of February 3, 2026 (Tue); maximum drawdown −37.96% |
| Foreign holding, margin balance | 21.92% · 0.6% |
| Share count events | 10,680,000 shares; no split, bonus issue or buyback cancellation found. The March 2026 tender offer bought subsidiary shares, so the parent count is unchanged |
Prices and multiples reflect the August 10, 2026 close as checked at the time of writing, and this piece reaches readers later, so the figures can differ from live quotes. Indicator data is Kiwoom (updated August 10, 2026) alongside DART consolidated filings, and each sentence names which one it came from. Ratios, growth rates and conversions that do not appear in the source documents are my own calculations and are marked as such. USD figures are approximate, at about KRW 1,418.4 per dollar, the Seoul foreign exchange market close on the same date, up KRW 2.3 from the prior session. The Korean won is the currency of record throughout.
The question of when an input cost actually reaches the income statement came up in a different consumer name, in the Lotte Wellfood piece on cocoa.
Sources: Money Today, Q2 results, August 10, 2026 · Digital Daily, entity breakdown · F Today, quarterly revenue · Asia Economy, Samsung Securities note · Newspim, NH Investment note · Herald Business, Englewood Lab tender offer · Segye Ilbo, 12.5% US tariff · Financial News, August 10 currency close · Business Korea, August 10 market close · Hankyung quote page · stockanalysis.com, e.l.f. Beauty